

5.9 Sensitivity Analysis |
137 |
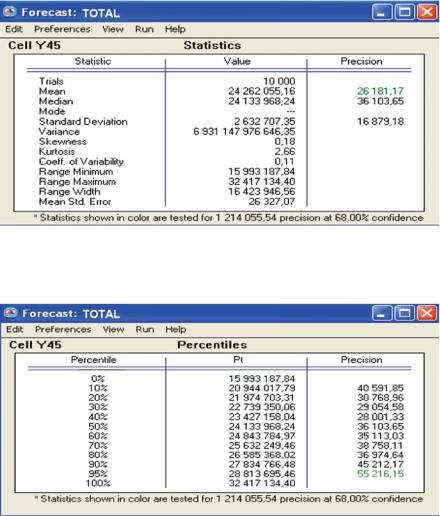
Fig. 5.11 Frequency chart of the TOTAL forecast, with 68% certainty level (Source: Own work)
Fig. 5.12 Frequency chart of the TOTAL forecast, with 95% certainty level (Source: Own work)
5.9Sensitivity Analysis
The data sensitivity analysis has been carried out. The data consists of impact categories characterising the total life cycle impact of the management of waste produced in MSP Power Plant, in an annual cycle. The procedure has been conducted by taking into account the variability of the analysed parameters and
138 |
5 Stochastic Analysis, Using Monte Carlo (MC) Simulation |
Fig. 5.13 The statistics report of the forecast of the total life cycle impact of the management of waste generated in the MSP Power Plant, from an annual perspective – Statistics (Source: Own work)
Fig. 5.14 The statistics report of the forecast of the total life cycle impact of the management of waste (TOTAL) generated in the MSP Power Plant, from an annual perspective – Percentiles (Source: Own work)
using MC simulation based on CB program. The sensitivity analysis is presented using the following three formats:
•Clustered bar chart (Fig. 5.15)
•Tornado chart (Fig. 5.16)
•Spider chart (Fig. 5.17).
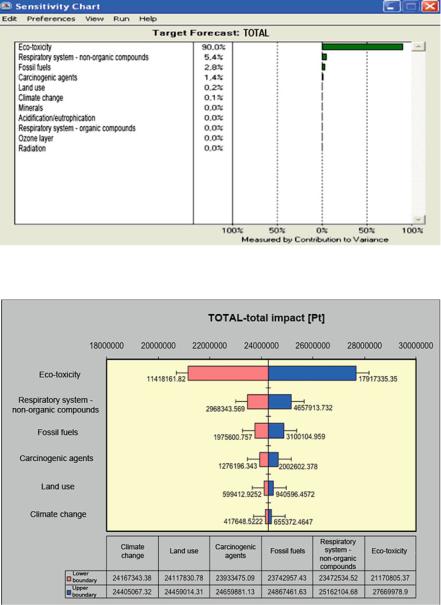
A conclusion can be drawn from Fig. 5.15 that the greatest impact, 90% share in the total life cycle impact of waste management, expressed in eco-points and equal
5.9 Sensitivity Analysis |
139 |
Fig. 5.15 The sensitivity analysis of the TOTAL forecast (Source: Own work)
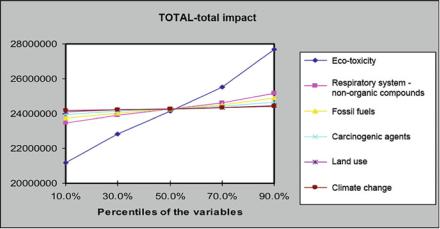
Fig. 5.16 Tornado sensitivity chart of the TOTAL forecast. The error bars indicate mean standard error (Source: Own work)
to 24.3 Mpt, on the LCA analysis results of the management of waste produced in 2005 in MSP Power Plant, divided into 11 impact categories, is created by ecotoxicity. The second most influential impact category – respiratory system – non-
140 |
5 Stochastic Analysis, Using Monte Carlo (MC) Simulation |
Fig. 5.17 Tornado sensitivity chart of the TOTAL forecast – the total life cycle impact of the management of waste generated in the MSP Power Plant, from an annual perspective (Source: Own work)
organic compounds – has only 5.4% share. The influence of the remaining impact categories does not exceed 2.8% share. The analysis has been performed using a method that defines the contribution of input variables of the model to variation, described in Chap. 4.13.
The tornado and spider charts have been created on the basis of data included in the newly built tables (Tables 5.6, 5.7), which are filled in with values resulting from an MC simulation performed after the activation of two decision fields (found in the Tornado Chart dialog window – see Fig. 4.15), respectively: Tornado chart and Spider chart. The impact categories, with the 0% share in the total life cycle impact of waste management on the results of the LCA analysis, are not included in the process of generating charts (Fig. 5.15). By analysing the charts shown in Figs. 5.16 and 5.17, it seems that eco-toxicity has the widest variability interval presented in the chart (Fig. 5.16) and is the most critical input variable – it corresponds to the line, which has the greatest incline towards the x axis, described in percentiles, which is mapping the location measure of distribution, presenting the total value of the life cycle impact of waste management.
In the fourth chapter of this monograph the Eco-indicator 99 method is described (see Chap. 4.7), which refers the impact of different damaging actions on natural environment to three types of damage categories: Human Health, Ecosystem Quality, and Consumption of Resources (SimaPro 2007). This chapter deals with the stochastic analysis used to calculate uncertainty of six impact categories (Carcinogenic agents, Respiratory system – organic compounds, Respiratory system – non-organic compounds, Climate change, Radiation, and Ozone layer), whose sum, 232.26 DALY, creates the Human Health damage category. Damage to human health is expressed in DALY units – they describe Disability Adjusted

Analysis Sensitivity 9.5
Table 5.6 The MC simulation results, using CB software, of the tornado sensitivity analysis of the TOTAL forecast – the total life cycle impact of the management of waste generated in the AMPSAK Power Plant, from an annual perspective – sensitivity table
Variable |
TOTAL – the total life cycle impact of waste management |
|
Input parameters |
|
|
||
Impact category |
Lower boundary |
Upper boundary |
Range |
|
Lower boundary |
Upper boundary |
Base value |
|
|
|
|
|
|
|
|
Eco-toxicity |
21170805.37 |
27669978.9 |
6499173.534 |
11418161.82 |
17917335.35 |
14528467.21 |
|
Respiratory system – non-organic |
23472534.52 |
25162104.68 |
1689570.163 |
2968343.569 |
4657913.732 |
3776919.81 |
|
compounds |
|
|
|
|
|
|
|
Fossil fuels |
23742957.43 |
24867461.63 |
1124504.202 |
1975600.757 |
3100104.959 |
2513754.09 |
|
Carcinogenic agents |
23933475.09 |
24659881.13 |
726406.0352 |
1276196.343 |
2002602.378 |
1623832.015 |
|
Land use |
24117830.78 |
24459014.31 |
341183.532 |
599412.9252 |
940596.4572 |
762692.9055 |
|
Climate change |
24167343.38 |
24405067.32 |
237723.9425 |
417648.5222 |
655372.4647 |
531415.9085 |
|
|
|
|
|
|
|
|
|
141

142 5 Stochastic Analysis, Using Monte Carlo (MC) Simulation
Table 5.7 The MC simulation results, using CB software, of the spider sensitivity analysis of the TOTAL forecast – the total life cycle impact of the management of waste generated in the MSP Power Plant, from an annual perspective – sensitivity table
Variable |
TOTAL – the total life cycle impact of waste management |
|
|||
Impact category |
10.0% |
30.0% |
50.0% |
70.0% |
90.0% |
Eco-toxicity |
21170805.37 |
22845811.69 |
24137412.33 |
25534446.33 |
27669978.9 |
Respiratory system – |
23472534.52 |
23907980.67 |
24243754.06 |
24606936.67 |
25162104.68 |
non-organic |
|
|
|
|
|
compounds |
|
|
|
|
|
Fossil fuels |
23742957.43 |
24032771.48 |
24256247.65 |
24497966.17 |
24867461.63 |
Carcinogenic agents |
23933475.09 |
24120688.84 |
24265049.74 |
24421194.81 |
24659881.13 |
Land use |
24117830.78 |
24205762.66 |
24273567.11 |
24346906.43 |
24459014.31 |
Climate change |
24167343.38 |
24228611.02 |
24275854.63 |
24326954.73 |
24405067.32 |
|
|
|
|
|
|
Table 5.8 The LCA analysis results for the management of waste generated by the MSP facilities in 2005 – brought to the form of human health damage category
Impact category |
Unit |
Total |
Carcinogenic agents |
DALY |
64.33 |
Respiratory system – organic compounds |
DALY |
0.10 |
Respiratory system – non-organic compounds |
DALY |
146.47 |
Climate change |
DALY |
21.11 |
Radiation |
DALY |
0.24 |
Ozone layer |
DALY |
0.01 |
Total |
DALY |
232.26 |
|
|
|
Source: The Polish Academy of Sciences study (Ocena 2009) |
|
|
Life Years. According to Adamczyk (2004), the DALY damage unit indicates a stream of hazardous substances in tonnes, in a year. The estimation scale of disability ranges between 0 and 1 and may be expressed in percentages. Zero refers to a full ability, whereas one means death. The details of the damage estimation can be found in Goedkoop et al. (2000), for instance.
The Eco-indicator 99 methodology, by relating the impact of the damaging effects on natural environment to one of the three impact categories, namely the human health damage category, allows to determine the relative amount of time by which human life is shortened, as a result of damaging waste management effects, and the number of deaths as well as the number of life years spent with disability (Kulczycka and Henclik 2009). These involve the following impact categories: carcinogenic agents, respiratory system – organic compounds, respiratory system – non-organic compounds, climate change, radiation, and ozone layer, which may be added up. Damage categories (not impact categories) are normalised on the European level (the damage caused by one European per year), on the basis of data collected in 1993 (the base year). This data has been updated for the most important types of emissions (Kulczycka and Henclik 2009). The data needed for the analysis can be found in Table 5.8. As far as the consumption of resources category is concerned, uncertainty analysis is not carried out (Eco-indicator 99). The process of
5.9 Sensitivity Analysis |
143 |
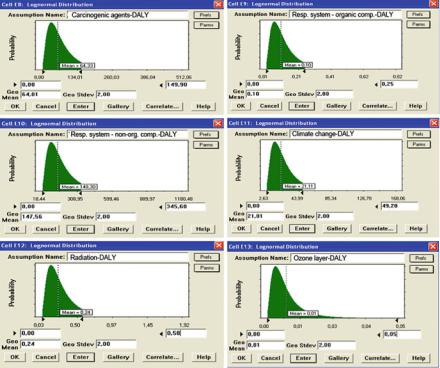
Fig. 5.18 The log-normal probability distributions tab windows of six impact categories, available in CB program, that form the human health damage category of the LCA analysis for the management of waste in the MSP Power Plant (Source: Own work)
estimating the impact categories, which are mentioned in Table 5.8 and form the damage category (human health) – expressed in DALY units – is assigned with lognormal probability distribution along with the quantities describing the functions of this distribution (geometric mean mg and geometric standard deviation sg with a 68% confidence level). Due to the lack of Polish data, geometric standard deviations that describe log-normal distribution are chosen in accordance with the data that can be found in the following: Sonnemann et al. (2004), Hofstetter (1998), Rabl and Spadaro (1999), and Hofstetter (1998). Different scenarios (chronic and protracted) of YOLL (Years Of Life Lost) are thoroughly analysed in the abovementioned publications, and especially in Rabl and Spadaro (1999), and in Friedrich et al. (2001). The recommended extreme values of geometric standard deviation sg are between 1.2 and 4. This study assumes that the value of geometric standard deviation is sg ¼ 2.0, similarly to what is suggested in one of the most detailed and extensive work of Rabl and Spadaro (1999). The remaining simulation output data is included in Fig. 5.18 (Table 5.9).