

4.13 Sensitivity Analysis |
91 |
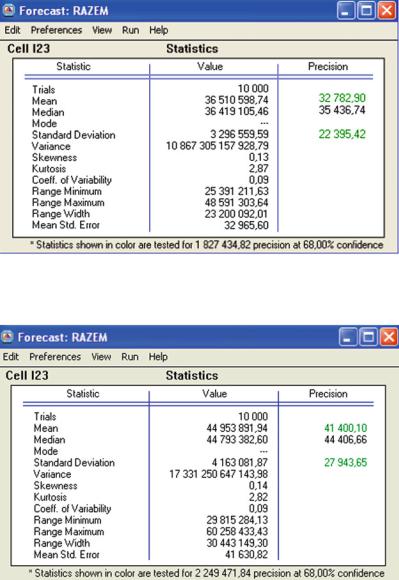
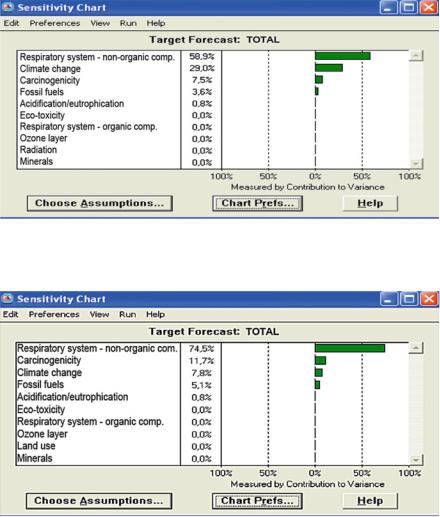
Fig. 4.28 The Forecast statistics report: S1 scenario TOTAL – Statistics (Source: Own work)
Fig. 4.29 The Forecast statistics report: S2 scenario TOTAL – Statistics (Source: Own work)
4.13.1 Tornado Chart
In order to construct tornado charts, certain parameters in the Tornado Chart dialog window need to be set by activating the two buttons (“use existing cell values” and
92 |
4 Stochastic Analysis of the Environmental Impact of Energy Production |
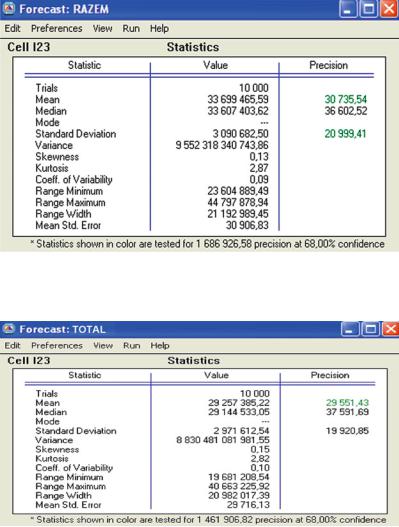
Fig. 4.30 The Forecast statistics report: S3 scenario TOTAL – Statistics (Source: Own work)
Fig. 4.31 The Forecast statistics report: S4 scenario TOTAL – Statistics (Source: Own work)
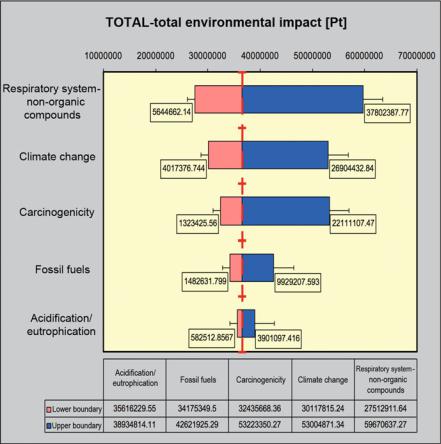
“percentiles of the variables”), as can be seen in Fig. 4.48, which shows the last, third, step, in modelling the process of building charts. When interpreting the charts presented in Figs. 4.36–4.39, it has been decided that impact categories, with zero per cent usefulness, are not included in further calculations. Tornado charts, presented in Figs. 4.40–4.43, have been constructed using data included in sensitivity tables (Tables 4.3–4.6). The wider the variability interval of the impact category, presented in different charts (horizontal bars), the greater the influence of that factor on the total value of the impact on the environment. Next to each bar
4.13 Sensitivity Analysis |
93 |
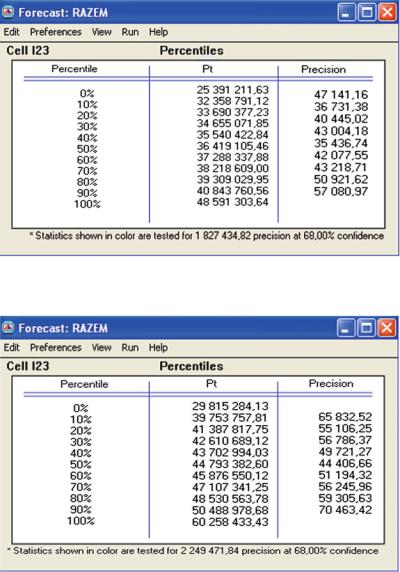
Fig. 4.32 The Forecast statistics report: S1 scenario TOTAL – Percentiles (Source: Own work)
Fig. 4.33 The Forecast statistics report: S2 scenario TOTAL – Percentiles (Source: Own work)
there is a calculated value of the parameters within the upper and lower interval ranges, calculated from the base value of individual impact categories, for the defined probability distribution. The explanation of the different colours of horizontal bars is included in Chap. 2. The red intermittent line points out the base value of the TOTAL expression – total influence on the environment. Error bars indicate standard error.
94 |
4 Stochastic Analysis of the Environmental Impact of Energy Production |
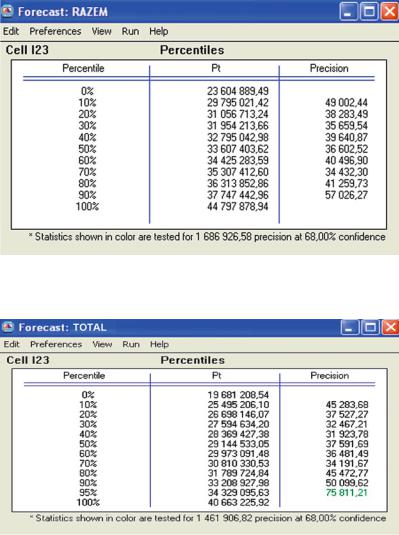
Fig. 4.34 The Forecast statistics report: S3 scenario TOTAL – Percentiles (Source: Own work)
Fig. 4.35 The Forecast statistics report: S1 scenario TOTAL – Percentiles (Source: Own work)
4.13.2 Spider Chart
Spider charts are created using the database, included in Tables 4.7–4.10, which have been completed with the results obtained in the MC simulation, after activating the button (Spider chart) in the Tornado chart dialog window (Fig. 4.16). The charts consist of five series of data. The reported key impact categories (excluding the impact categories of zero per cent usefulness that can
4.13 Sensitivity Analysis |
95 |
Fig. 4.36 Sensitivity analysis for the S1 scenario – present state – 62% of energy comes from hard coal, 38% from blast furnace gas (Source: Own work)
Fig. 4.37 Sensitivity analysis for the S2 scenario – an assumption that 100% of energy comes from hard coal (Source: Own work)
be omitted without any loss of quality) constitute these data series. They can be found in Figs. 4.44–4.47. The horizontal x axis maps the location measure of distribution expressed in percentages (it measures the concentration of units, as percentages) ranging from 10% to 90%. The greater the incline of the line describing the value of the total environmental impact, the more critical the input variable becomes.
Yet another form of graphic presentation of variables is a spider chart, or diagram, also known as radar chart or M2 chart, presented in Figs. 4.49 and 4.50. These charts
96 |
4 Stochastic Analysis of the Environmental Impact of Energy Production |
Fig. 4.38 Sensitivity analysis for the S3 scenario – an assumption that fuels are dosed in equal percentages (Source: Own work)
Fig. 4.39 Sensitivity analysis for the S4 scenario – an assumption that 30% of energy comes from hard coal, 70% from blast furnace gas (Source: Own work)
consist of four series of data including the total values of environmental impact in each of the four individual scenarios (scenario S1–scenario S4). The application of spider charts makes it possible to compare the four areas (scenarios) by simultaneously employing five key impact categories (Fig. 4.49) as well as all eleven (Fig. 4.50) impact categories (Keeshley et al. 1996). According to Zie˛bicki (2005), this type of diagram was first used by Eastman Kodak, a company that received the International Benchmarking Clearinghouse award for the development and pioneering application of the diagram (Bogan and English 1994). In the analysed
4.13 Sensitivity Analysis |
97 |
Fig. 4.40 Tornado sensitivity chart of the S1 scenario. Error bars indicate mean standard error (Source: Own work)
diagram the vertical lines describe measuring instruments (impact categories), criteria whose number can be anything between 4 and 16 (Harrington 1996). The lines shaping the “spider web” function as a scale that demonstrates the achieved value of a given criterion (main grid lines of the value’s axis). In the next step, the data concerning the given process’s scenario is placed in the graph and joined together. As a result, the spider chart enables the possibility to simultaneously compare the examined impact categories for all four scenarios. In a spider chart, the greater the distance between the lines representing different scenarios, the higher the sensitivity of the total environmental impact on the given input variable (in Fig. 4.49 the difference between scenario S2 and scenario S4 is the biggest for that category (the variable: Respiratory system – non-organic compounds)).
98 |
4 |
Stochastic Analysis of the Environmental Impact of Energy Production |
|||||||||||||||||||
|
|
|
|
|
|
|
|
|
|
|
|
|
|
|
|
|
|
|
|
|
|
|
|
|
|
TOTAL-total environmental impact [Pt] |
|
|
|||||||||||||||
|
35000000 |
40000000 |
|
|
45000000 |
50000000 |
55000000 |
||||||||||||||
|
|
|
|
|
|
|
|
|
|
|
|
|
|
|
|
|
|
|
|
|
|
|
Respiratory system - |
|
|
|
|
|
|
|
|
|
|
|
|
|
|
|
|
|
|
|
|
|
|
|
|
|
|
|
|
|
|
|
|
|
|
|
|
|
|
|
|
||
|
|
|
|
|
|
|
|
|
|
|
|
|
|
|
|
|
|
|
|
||
|
non-organic |
|
|
|
|
|
|
|
|
|
|
|
|
|
|
|
|
|
|
|
|
|
compounds |
|
16341291.08 |
|
|
|
|
|
|
|
|
|
|
|
25642691.34 |
|
|
||||
|
Carcinogenicity |
|
|
|
|
|
|
|
|
|
|
|
|
|
|
|
|
|
|
|
|
|
|
|
|
|
|
|
|
|
|
|
|
|
|
|
|
|
|
|
|
||
|
|
|
|
|
|
|
|
|
|
|
|
|
|
|
|
|
|
|
|
||
|
|
|
|
|
|
|
|
|
|
|
|
|
|
|
|
|
|
|
|
||
|
|
|
|
|
|
|
|
|
|
|
|
|
|
|
|
|
|
|
|
||
|
|
|
|
|
|
|
|
|
|
|
|
|
|
|
|
|
|
|
|
||
|
|
|
|
|
6797038.726 |
|
|
|
|
|
10665887.33 |
|
|
|
|
|
|||||
|
Climate change |
|
|
|
|
|
|
|
|
|
|
|
|
|
|
|
|
|
|
|
|
|
|
|
|
|
|
|
|
|
|
|
|
|
|
|
|
|
|
|
|
||
|
|
|
|
|
|
|
|
|
|
|
|
|
|
|
|
|
|
|
|
||
|
|
|
|
|
|
|
|
|
|
|
|
|
|
|
|
|
|
|
|
||
|
|
|
|
|
|
|
|
|
|
|
|
|
|
|
|
|
|
|
|
||
|
Fossil fuels |
|
|
|
5502580.817 |
|
|
|
8634628.734 |
|
|
|
|
|
|||||||
|
|
|
|
|
|
|
|
|
|
|
|
|
|
|
|
|
|
|
|
||
|
|
|
|
|
|
|
|
|
|
|
|
|
|
|
|
|
|
|
|
||
|
|
|
|
|
|
|
|
|
|
|
|
|
|
|
|
|
|
|
|
||
|
|
|
|
|
|
|
|
|
|
|
|
|
|
|
|
|
|
|
|
||
|
|
|
|
|
|
|
|
|
|
|
|
|
|
|
|
|
|
|
|
||
|
|
|
|
|
|
|
4357585.459 |
|
|
6837906.408 |
|
|
|
|
|
||||||
|
|
|
|
|
|
|
|
|
|
|
|
|
|
|
|
|
|
|
|
|
|
|
|
|
|
|
|
|
|
|
|
|
|
|
|
|
|
|
|
|
|
|
|
|
|
|
|
|
|
|
|
|
|
|
|
|
|
|
|
|
|
|
|
|
|
Acidification/
eutrophication
1663253.523 2609971.065
|
|
|
|
|
|
|
|
|
|
|
|
|
|
|
|
|
|
|
Acidification/ |
Fossil fuels |
Climate change |
Carcinogenicity |
Respiratory system - |
|||
|
non-organic |
|||||||
|
eutrophication |
|||||||
|
|
|
|
|
|
|
compounds |
|
|
|
|
|
|
|
|
|
|
Lower boundary |
44536366.86 |
43802431.3 |
43490534.76 |
43137924.67 |
40538071.92 |
|||
Upper boundary |
45483084.4 |
46282752.25 |
46622582.67 |
47006773.27 |
49839472.18 |
|||
Fig. 4.41 Tornado sensitivity chart of the S2 scenario. Error bars indicate mean standard error (Source: Own work)
The conducted LCA analysis has made it possible to determine to what extent the energy production processes in the Power Plant are affecting the environment. It is worth remembering that the processes chosen from the database and used during the analysis do not relate to Polish conditions and have been subjected to averaging, which may at times be a cause of incorrect results.
The potential environmental strain is the greatest when it is caused by the sulphur dioxide (SO2) and nitric oxide (NOx – when expressed in nitrogen dioxide) emissions – this has a negative impact on the respiratory system – non-organic compounds category. This concerns the S1, S2, and S3 scenarios and is connected to coal combustion (by burning less coal the SO2 emissions are reduced). The SO2 emitted from the Power Plant comes from two sources (Wniosek 2006):
1.Desulfurised hard coal with an average content of 0.7% S (according to an administrative decision coal with a content of 0.8% S should be burned)
2.Purified coke oven gas, containing approximately 0.5 H2S/Nm3. SO2 from coke oven gas constitutes the trace values (majority of which comes from coal).
4.13 Sensitivity Analysis |
|
|
|
|
|
|
|
|
|
|
|
|
|
|
|
|
|
|
|
99 |
|||
|
|
|
|
|
|
|
|
|
|
|
|
|
|
|
|
|
|
|
|
|
|
|
|
|
|
|
|
|
TOTAL-total environmental impact [Pt] |
|
|
|
|
|
|
||||||||||||
28000000.00 |
30000000.00 |
32000000.00 |
|
34000000.00 |
36000000.00 |
|
38000000.00 |
40000000.00 |
|||||||||||||||
Respiratory system - |
|
|
|
|
|
|
|
|
|
|
|
|
|
|
|
|
|
|
|
|
|
|
|
|
|
|
|
|
|
|
|
|
|
|
|
|
|
|
|
|
|
|
|
|
|
||
|
|
|
|
|
|
|
|
|
|
|
|
|
|
|
|
|
|
|
|
|
|
||
Non-organic compounds |
|
|
|
|
|
|
|
|
|
|
|
|
|
|
|
|
|
|
|
|
|
|
|
Climate change |
|
9938313.174 |
|
|
|
|
|
|
|
|
|
|
|
15595162.95 |
|
|
|
||||||
|
|
|
|
|
|
|
|
|
|
||||||||||||||
|
|
|
|
|
|
|
|
|
|
|
|
|
|
|
|
|
|
|
|
|
|
||
|
|
|
|
|
|
|
|
|
|
|
|
|
|
|
|
|
|
|
|
|
|
||
|
|
|
|
|
|
|
|
|
|
|
|
|
|
|
|
|
|
|
|
|
|
||
|
|
|
|
|
|
|
|
|
|
|
|
|
|
|
|
|
|
|
|
|
|
||
|
|
|
|
|
|
|
|
|
|
|
|
|
|
|
|
|
|
|
|
|
|
||
|
|
|
|
|
|
|
|
|
|
|
|
|
|
|
|
|
14300611.71 |
|
|
|
|
||
|
|
|
|
9113335.855 |
|
|
|
|
|
|
|
|
|
|
|
|
|
|
|
||||
Carcinogenicity |
|
|
|
|
|
|
|
|
|
|
|
|
|
|
|
|
|
|
|
|
|
|
|
|
|
|
|
|
|
|
|
|
|
|
|
|
|
|
|
|
|
|
|
|
|
||
|
|
|
|
|
|
|
|
|
|
|
|
|
|
|
|
|
|
|
|
|
|
||
|
|
|
|
|
|
|
|
|
|
|
|
|
|
|
|
|
|
|
|
|
|
||
|
|
|
|
|
|
|
|
|
|
|
|
|
|
|
|
|
|
|
|
|
|
||
|
|
|
|
|
|
|
|
|
|
|
|
|
|
|
|
|
|
|
|
|
|
||
|
|
|
|
|
|
3432135.714 |
|
|
|
5385694.221 |
|
|
|
|
|
|
|
||||||
Fossil fuels |
|
|
|
|
|
|
|
|
|
|
|
|
|
|
|
|
|
|
|
|
|
|
|
|
|
|
|
|
|
|
|
|
|
|
|
|
|
|
|
|
|
|
|
|
|
||
|
|
|
|
|
|
|
|
|
|
|
|
|
|
|
|
|
|
|
|
|
|
||
|
|
|
|
|
|
|
|
|
|
|
|
|
|
|
|
|
|
|
|
|
|
||
|
|
|
|
|
|
|
|
|
|
|
|
|
|
|
|
|
|
|
|
|
|
||
|
|
|
|
|
|
|
|
|
|
|
|
|
|
|
|
|
|
|
|
|
|
||
Acidification/ |
|
|
|
|
2588642.517 |
|
|
|
4062087.922 |
|
|
|
|
|
|
|
|||||||
|
|
|
|
|
|
|
|
|
|
|
|
|
|
|
|
|
|
|
|
|
|
||
|
|
|
|
|
|
|
|
|
|
|
|
|
|
|
|
|
|
|
|
|
|
||
|
|
|
|
|
|
|
|
|
|
|
|
|
|
|
|
|
|
|
|
|
|
||
|
|
|
|
|
|
|
|
|
|
|
|
|
|
|
|
|
|
|
|
|
|
||
|
|
|
|
|
|
|
|
|
|
|
|
|
|
|
|
|
|
|
|
|
|
||
eutrophication |
|
|
|
|
|
|
|
|
|
|
|
|
|
|
|
|
|
|
|
|
|
|
|
|
|
|
|
|
|
|
1033302.95 |
|
1621455.025 |
|
|
|
|
|
|
|
|
||||||
|
|
|
|
|
|
|
|
|
|
|
|
|
|
|
|
|
|
|
|
|
|
|
|
|
|
Acidification/ |
|
|
|
|
|
|
|
|
|
|
Climate change |
|
Respiratory system - |
|
|||||||
|
|
|
Fossil fuels |
|
Carcinogenicity |
|
|
|
non-organic |
|
|||||||||||||
|
|
eutrophication |
|
|
|
|
|
|
|||||||||||||||
|
|
|
|
|
|
|
|
|
|
|
|
|
|
|
|
|
|
|
compounds |
|
|||
|
Lower boundary |
33457060 |
|
33033385.76 |
|
|
|
32803618.36 |
|
31256060.4 |
|
31031336.72 |
|
||||||||||
|
Upper boundary |
34045212.07 |
|
34506831.17 |
|
|
|
34757176.87 |
|
36443336.25 |
|
36688186.5 |
|
||||||||||
|
|
|
|
|
|
|
|
|
|
|
|
|
|
|
|
|
|
|
|
|
|
|
|
Fig. 4.42 Tornado sensitivity chart of the S3 scenario. Error bars indicate mean standard error (Source: Own work)
As far as the S4 scenario is concerned, the large percentage share of combusted blast furnace gas increases the emissions of carbon dioxide (CO2), the factor influencing climate change, which leads to a situation where the climate change category in fact becomes a key impact category. In the case of S1 and S3, the climate change category is the second most important one. The second type of gas influencing the climate change impact category is methane (CH4), which is not included in the LCA analysis, as, despite the fact that it is a greenhouse gas mentioned in the emissions trading act, in the analysed period (i.e. the year 2005), methane was not subject to European trade regulations and was not mentioned in the application for an integrated permit (Wniosek 2006). If the European Commission recognises the need to limit methane’s emissions, it will then publish the allocation of emissions and the percentage of reduction in the next stage of trade. In addition, methane is not limited in the scope of the allowed emissions levels from individual emission sources and facilities. It is only subject to charges for the economic use of the environment – for the emissions to the atmosphere. According to the information received from the Department of Environmental
100 |
4 |
Stochastic Analysis of the Environmental Impact of Energy Production |
|||||||||||||||||||||||
|
|
|
|
|
|
|
|
|
|
|
|
|
|
|
|
|
|
|
|
|
|
|
|
|
|
|
|
|
|
|
|
TOTAL-total environmental impact [Pt] |
|
|
|
|
|||||||||||||||
|
24000000.00 |
26000000.00 |
|
28000000.00 |
|
30000000.00 |
|
32000000.00 |
34000000.00 |
||||||||||||||||
|
Climate change |
|
|
|
|
|
|
|
|
|
|
|
|
|
|
|
|
|
|
|
|
|
|
|
|
|
|
|
|
|
|
|
|
|
|
|
|
|
|
|
|
|
|
|
|
|
|
|
|
||
|
Respiratory system - |
|
10557634.22 |
|
|
|
|
|
|
|
|
|
|
|
|
|
|
|
|
16566999.17 |
|
||||
|
|
|
|
|
|
|
|
|
|
|
|
|
|
|
|
|
|
||||||||
|
|
|
|
|
|
|
|
|
|
|
|
|
|
|
|
|
|
|
|
|
|
|
|
||
|
|
|
|
|
|
|
|
|
|
|
|
|
|
|
|
|
|
|
|
|
|
|
|
||
|
|
|
|
|
|
|
|
|
|
|
|
|
|
|
|
|
|
|
|
|
|
|
|
||
|
|
|
|
|
|
|
|
|
|
|
|
|
|
|
|
|
|
|
|
|
|
|
|
||
non-organic compounds |
|
|
|
|
|
|
|
|
|
|
|
|
|
|
|
|
|
|
11576133.84 |
|
|
||||
|
|
|
|
|
7377110.696 |
|
|
|
|
|
|
|
|
|
|
|
|
|
|
||||||
|
Carcinogenicity |
|
|
|
|
|
|
|
|
|
|
|
|
|
|
|
|
|
|
|
|
|
|
|
|
|
|
|
|
|
|
|
|
|
|
|
|
|
|
|
|
|
|
|
|
|
|
|
|
||
|
|
|
|
|
|
|
|
|
|
|
|
|
|
|
|
|
|
|
|
|
|
|
|
||
|
|
|
|
|
|
|
|
|
|
|
|
|
|
|
|
|
|
|
|
|
|
|
|
||
|
|
|
|
|
|
|
|
|
|
|
|
|
|
|
|
|
|
|
|
|
|
|
|
||
|
|
|
|
|
|
|
|
|
2086168.149 |
|
|
3273607.059 |
|
|
|
|
|
|
|||||||
|
Fossil fuels |
|
|
|
|
|
|
|
|
|
|
|
|
|
|
|
|
|
|
|
|
|
|
|
|
|
|
|
|
|
|
|
|
|
|
|
|
|
|
|
|
|
|
|
|
|
|
|
|
||
|
|
|
|
|
|
|
|
|
|
|
|
|
|
|
|
|
|
|
|
|
|
|
|
||
|
|
|
|
|
|
|
|
|
|
|
|
|
|
|
|
|
|
|
|
|
|
|
|
||
|
|
|
|
|
|
|
|
|
|
|
|
|
|
2951756.05 |
|
|
|
|
|
|
|||||
|
Acidification/ |
|
|
|
|
|
|
1881062.494 |
|
|
|
|
|
|
|
|
|||||||||
|
|
|
|
|
|
|
|
|
|
|
|
|
|
|
|
|
|
|
|
|
|
|
|
||
|
|
|
|
|
|
|
|
|
|
|
|
|
|
|
|
|
|
|
|
|
|
|
|
||
|
|
|
|
|
|
|
|
|
|
|
|
|
|
|
|
|
|
|
|
|
|
|
|
||
|
|
|
|
|
|
|
|
|
|
|
|
|
|
|
|
|
|
|
|
|
|
|
|
||
|
eutrophication |
|
|
|
|
|
|
|
781321.4571 |
1226046.634 |
|
|
|
|
|
|
|
||||||||
|
|
|
|
|
|
|
|
|
|
|
|
|
|
|
|
|
|||||||||
|
|
|
|
|
|
|
|
|
|
|
|
|
|
|
|
|
|
|
|
|
|
|
|
|
|
|
|
|
|
|
|
|
|
|
|
|
|
|
|
|
|
|
|
|
|
|
|
|
|
|
|
|
|
|
Acidification/ |
|
|
|
|
|
|
|
|
|
|
|
Respiratory system - |
|
|
|
|
||||||
|
|
|
|
|
Fossil fuels |
|
|
|
Carcinogenicity |
|
Climate change |
|
|||||||||||||
|
|
|
|
|
|
|
|
|
non-organic |
|
|||||||||||||||
|
|
|
eutrophication |
|
|
|
|
|
|
|
|||||||||||||||
|
|
|
|
|
|
|
|
|
|
|
|
|
|
|
compounds |
|
|
|
|
||||||
|
|
Lower boundary |
29025304.61 |
|
28725735.33 |
|
28669864.59 |
|
27228612.74 |
|
26362238.66 |
|
|||||||||||||
|
|
Upper boundary |
29470029.78 |
|
29796428.89 |
|
29857303.5 |
|
31427635.89 |
|
32371603.61 |
|
|||||||||||||
|
|
|
|
|
|
|
|
|
|
|
|
|
|
|
|
|
|
|
|
|
|
|
|
|
|
Fig. 4.43 Tornado sensitivity chart of the S4 scenario. Error bars indicate mean standard error (Source: Own work)
|
|
TOTAL-total environmental impact |
||
|
|
|
[Pt] |
|
60000000 |
|
|
|
Respiratory system - |
|
|
|
|
|
|
|
|
|
non-organic compounds |
50000000 |
|
|
|
Climate change |
|
|
|
|
|
40000000 |
|
|
|
Carcinogenicity |
|
|
|
|
|
30000000 |
|
|
|
Fossil fuels |
|
|
|
|
|
|
|
|
|
Acidification/ |
20000000 |
|
|
|
eutrophication |
|
|
|
|
|
10.0% |
30.0% |
50.0% |
70.0% |
90.0% |
|
Percentiles of the variables |
|
||
Fig. 4.44 Spider sensitivity chart of the S1 scenario (Source: Own work)
4.13 Sensitivity Analysis |
101 |
Fig. 4.45 Spider sensitivity chart of the S2 scenario (Source: Own work)
|
|
TOTALtotal environmental impact |
|
||
|
|
|
[Pt] |
|
|
38000000 |
|
|
|
|
|
|
|
|
|
|
Respiratory system- |
36000000 |
|
|
|
|
non-organic compounds |
|
|
|
|
|
Climate change |
34000000 |
|
|
|
|
Carcinogenicity |
|
|
|
|
|
|
32000000 |
|
|
|
|
Fossil fuels |
|
|
|
|
|
|
30000000 |
|
|
|
|
Acidification/ |
10.0% |
30.0% |
50.0% |
70.0% |
90.0% |
Eutrophication |
|
Percentiles of the variables |
|
|
||
Fig. 4.46 Spider sensitivity chart of the S3 scenario (Source: Own work)
|
|
TOTAL-total environmental impact |
|
||
|
|
|
[Pt] |
|
|
34000000 |
|
|
|
|
|
32000000 |
|
|
|
|
Climate change |
|
|
|
|
|
|
|
|
|
|
|
Respiratory system - |
30000000 |
|
|
|
|
non-organic compounds |
|
|
|
|
Carcinogenicity |
|
|
|
|
|
|
|
28000000 |
|
|
|
|
Fossil fuels |
|
|
|
|
|
|
26000000 |
|
|
|
|
Acidification/ |
10.0% |
30.0% |
50.0% |
70.0% |
90.0% |
Eutrophication |
|
Percentiles of the variables |
|
|
||
Fig. 4.47 Spider sensitivity chart of the S4 scenario (Source: Own work)
102 |
4 Stochastic Analysis of the Environmental Impact of Energy Production |
Fig. 4.48 The final view of the Tornado Chart dialog window in the process of entering sensitivity analysis parameters with the Tornado chart and Spider chart options ticked
Protection at MSP, the amount of methane emitted by the Power Plant complex in 2005 was measured to be 575.08 Mg.
The category that is next in line, in terms of its size, which can be potentially affected by the energy production processes in the Power Plant, is the carcinogenicity category. In this case, most of the influence comes from the application of a certain type of hard coal in the analysis – the choice of another type of coal would lead to different results being achieved. Nevertheless, hard coal is the chosen type of fuel picked from the database, as it seems to refer to Polish conditions very well. Hard coal is extracted in Eastern Europe from underground mines and in its inventory table it has: explosive materials, steel, wood, fuel for coal mining machines, methane emission, dust, etc. The difference lies in the methods of its enrichment – in the coal chosen from the database enrichment by floatation is used, whereas in Poland dense liquid separation is used that does not generate flotation tailings. What influences carcinogenicity the most is arsenic – included in coal and ash. Arsenic and nickel are among the trace elements. Olkulski (2004) quotes Jasien´ko et al. (1995) that according to Goldchmidt (1952), trace elements, also known as microelements, could occur in coal as a result of the vegetation period of plants that formed coal during the decomposition of plants in the biochemical process or during the decomposition in the geochemical stage.

Table 4.3 The MC simulation results, using CB® software, of the S1 scenario’s sensitivity in the tornado analysis – sensitivity table
Variable |
Total – environmental impact |
|
Input parameters |
|
|
|
|
|
|
|
|
|
|
Impact category |
Lower boundary |
Upper boundary |
Range |
Lower boundary |
Upper boundary |
Base value |
|
|
|
|
|
|
|
Respiratory system – non-organic |
27,512,911.64 |
59,670,637.27 |
32,157,725.63 |
5,644,662.14 |
37,802,387.77 |
14,680,447 |
compounds |
|
|
|
|
|
|
Climate change |
30,117,815.24 |
53,004,871.34 |
22,887,056.1 |
4,017,376.744 |
26,904,432.84 |
10,448,258 |
Carcinogenicity |
32,435,668.36 |
53,223,350.27 |
20,787,681.91 |
1,323,425.56 |
22,111,107.47 |
5,436,453.7 |
Fossil fuels |
34,175,349.5 |
42,621,925.29 |
8,446,575.794 |
1,482,631.799 |
9,929,207.593 |
3,855,978.8 |
Acidification/eutrophication |
35,616,229.55 |
38,934,814.11 |
3,318,584.56 |
582,512.8567 |
3,901,097.416 |
1,514,979.8 |
|
|
|
|
|
|
|
Analysis Sensitivity 13.4
Table 4.4 The MC simulation results, using CB® software, of the S2 scenario’s sensitivity in the tornado analysis – sensitivity table
Variable |
Total – environmental impact |
|
Input parameters |
|
|
|
Impact category |
Lower boundary |
Upper boundary |
Range |
Lower boundary |
Upper boundary |
Base value |
|
|
|
|
|
|
|
Respiratory system – non-organic |
40,538,071.92 |
49,839,472.18 |
9,301,400.267 |
16,341,291.08 |
25,642,691.34 |
20,792,656 |
compounds |
|
|
|
|
|
|
Carcinogenicity |
43,137,924.67 |
47,006,773.27 |
3,868,848.605 |
6,797,038.726 |
10,665,887.33 |
8,648,550.9 |
Climate change |
43,490,534.76 |
46,622,582.67 |
3,132,047.917 |
5,502,580.817 |
8,634,628.734 |
7,001,482.9 |
Fossil fuels |
43,802,431.3 |
46,282,752.25 |
2,480,320.949 |
4,357,585.459 |
6,837,906.408 |
5,544,591 |
Acidification/eutrophication |
44,536,366.86 |
45,483,084.4 |
946,717.5422 |
1,663,253.523 |
2,609,971.065 |
2,116,323.5 |
|
|
|
|
|
|
|
103

Table 4.5 The MC simulation results, using CB® software, of the S3 scenario’s sensitivity in the tornado analysis – sensitivity table
Variable |
Total – environmental impact |
|
Input parameters |
|
|
|
|
|
|
|
|
|
|
Impact category |
Lower boundary |
Upper boundary |
Range |
Lower boundary |
Upper boundary |
Base value |
|
|
|
|
|
|
|
Respiratory system – non-organic |
31,031,336.72 |
36,688,186.5 |
5,656,849.78 |
9,938,313.174 |
15,595,162.95 |
12,645,508 |
compounds |
|
|
|
|
|
|
Climate change |
31,256,060.4 |
36,443,336.25 |
5,187,275.85 |
9,113,335.855 |
14,300,611.71 |
11,595,807 |
Carcinogenicity |
32,803,618.36 |
34,757,176.87 |
1,953,558.507 |
3,432,135.714 |
5,385,694.221 |
4,367,048.9 |
Fossil fuels |
33,033,385.76 |
34,506,831.17 |
1,473,445.405 |
2,588,642.517 |
4,062,087.922 |
3,293,788.3 |
Acidification/eutrophication |
33,457,060 |
34,045,212.07 |
588,152.0745 |
1,033,302.95 |
1,621,455.025 |
1,314,774.5 |
|
|
|
|
|
|
|
Table 4.6 The MC simulation results, using CB® software, of the S4 scenario’s sensitivity in the tornado analysis – sensitivity table
Variable |
Total – environmental impact |
|
Input parameters |
|
|
|
Impact category |
Lower boundary |
Upper boundary |
Range |
Lower boundary |
Upper boundary |
Base value |
|
|
|
|
|
|
|
Climate change |
26,362,238.66 |
32,371,603.61 |
6,009,364.942 |
10,557,634.22 |
16,566,999.17 |
13,433,532 |
Respiratory system – non-organic |
27,228,612.74 |
31,427,635.89 |
4,199,023.149 |
7,377,110.696 |
11,576,133.84 |
9,386,634.4 |
compounds |
|
|
|
|
|
|
Carcinogenicity |
28,669,864.59 |
29,857,303.5 |
1,187,438.91 |
2,086,168.149 |
3,273,607.059 |
2,654,440 |
Fossil fuels |
28,725,735.33 |
29,796,428.89 |
1,070,693.556 |
1,881,062.494 |
2,951,756.05 |
2,393,463.6 |
Acidification/eutrophication |
29,025,304.61 |
29,470,029.78 |
444,725.1773 |
781,321.4571 |
1,226,046.634 |
994,153.29 |
|
|
|
|
|
|
|
104
Production Energy of Impact Environmental the of Analysis Stochastic 4

4.13 Sensitivity Analysis |
105 |
Table 4.7 The MC simulation results, using CB® software, of the S1 scenario’s sensitivity in the spider analysis – sensitivity table
Variable |
Total – environmental impact |
|
|
|
|
|
|
|
|
|
|
Impact category |
10.0% |
30.0% |
50.0% |
70.0% |
90.0% |
|
|
|
|
|
|
Respiratory system – non- |
27,512,911.64 |
31,767,598.27 |
36,475,840.23 |
43,423,375.18 |
59,670,637.27 |
organic compounds |
|
|
|
|
|
Climate change |
30,117,815.24 |
33,145,929.01 |
36,496,843.78 |
41,441,491.42 |
53,004,871.34 |
Carcinogenicity |
32,435,668.36 |
34,152,794.35 |
36,521,716.41 |
40,736,287.75 |
53,223,350.27 |
Fossil fuels |
34,175,349.5 |
35,292,889.14 |
36,529,560.01 |
38,354,405.5 |
42,621,925.29 |
Acidification/eutrophication |
35,616,229.55 |
36,055,300.95 |
36,541,177.94 |
37,258,143.52 |
38,934,814.11 |
|
|
|
|
|
|
Table 4.8 The MC simulation results, using CB® software, of the S2 scenario’s sensitivity in the spider analysis – sensitivity table
Variable |
Total – environmental impact |
|
|
|
|
|
|
|
|
|
|
Impact category |
10.0% |
30.0% |
50.0% |
70.0% |
90.0% |
|
|
|
|
|
|
Respiratory system – non- |
40,538,071.92 |
42,935,284.94 |
44,783,780.61 |
46,783,169.02 |
49,839,472.18 |
organic compounds |
|
|
|
|
|
Carcinogenicity |
43,137,924.67 |
44,135,027.64 |
44,903,895.71 |
45,735,526.52 |
47,006,773.27 |
Climate change |
43,490,534.76 |
44,297,745.05 |
44,920,186.5 |
45,593,437.85 |
46,622,582.67 |
Fossil fuels |
43,802,431.3 |
44,441,674.58 |
44,934,596.34 |
45,467,755.31 |
46,282,752.25 |
Acidification/eutrophication |
44,536,366.86 |
44,780,360.62 |
44,968,504.69 |
45,172,006.96 |
45,483,084.4 |
|
|
|
|
|
|
Table 4.9 The MC simulation results, using CB® software, of the S3 scenario’s sensitivity in the spider analysis – sensitivity table
Variable |
Total – environmental impact |
|
|
|
|
|
|
|
|
|
|
Impact category |
10.0% |
30.0% |
50.0% |
70.0% |
90.0% |
|
|
|
|
|
|
Respiratory system – non- |
31,031,336.72 |
32,489,254.19 |
33,613,457.22 |
34,829,428.96 |
36,688,186.5 |
organic compounds |
|
|
|
|
|
Climate change |
31,256,060.4 |
32,592,956.45 |
33,623,839.61 |
34,738,873.79 |
36,443,336.25 |
Carcinogenicity |
32,803,618.36 |
33,307,101.25 |
33,695,337.9 |
34,115,266.31 |
34,757,176.87 |
Fossil fuels |
33,033,385.76 |
33,413,131.01 |
33,705,953.31 |
34,022,678.71 |
34,506,831.17 |
Acidification/eutrophication |
33,457,060 |
33,608,642.1 |
33,725,527.36 |
33,851,953.96 |
34,045,212.07 |
|
|
|
|
|
|
Table 4.10 The MC simulation results, using CB® software, of the S4 scenario’s sensitivity in the spider analysis – sensitivity table
Variable |
Total |
|
|
|
|
|
|
|
|
|
|
Impact category |
10.0% |
3.0% |
50.0% |
70.0% |
90.0% |
|
|
|
|
|
|
Climate change |
26,362,238.66 |
27,911,008.47 |
29,105,267.91 |
30,397,014.78 |
32,371,603.61 |
Respiratory system – non- |
27,228,612.74 |
28,310,810.33 |
29,145,295.02 |
30,047,898.71 |
31,427,635.89 |
organic compounds |
|
|
|
|
|
Carcinogenicity |
28,669,864.59 |
28,975,898.51 |
29,211,881.87 |
29,467,128.56 |
29,857,303.5 |
Fossil fuels |
28,725,735.33 |
29,001,680.94 |
29,214,463.14 |
29,444,614.76 |
29,796,428.89 |
Acidification/eutrophication |
29,025,304.61 |
29,139,921.87 |
29,228,303.46 |
29,323,899.64 |
29,470,029.78 |
|
|
|
|
|
|
Entries 18–43 create a new process – Siłownia-E (E-Power-Plant)
106 |
4 Stochastic Analysis of the Environmental Impact of Energy Production |
Carcinogenicity 2.50E+07
2.00E+07
1.50E+07
1.00E+07
Fossil fuels
5.00E+06 |
0.00E+00 |
Respiratory system – non-organic compounds
Acidification/eutrophication |
|
Climate change |
|
Scenario 1 |
Scenario 2 |
Scenario 3 |
Scenario 4 |
Fig. 4.49 The sensitivity spider chart of four key impact categories (Source: Own work)
Fig. 4.50 The sensitivity spider chart of (all) 11 impact categories (Source: Own work)
The direct use of hard coal and natural gas, as well as partially the use of natural gas and crude oil in energy production processes constitutes the considerable strain on the fossil fuel impact category.