

Kluwer - Handbook of Biomedical Image Analysis Vol
.1.pdf94 |
Wong |
operational equations will be linear in the parameters to be estimated, whereby linear least-squares or weighted linear least-squares methods can be used to estimate the parameters of interest. While the measurement errors are typically statistically independent in time, integration introduces correlation of measurement errors, which can introduce bias into the parameter estimates [83]. The generalized linear least-squares method was designed to remove bias in the estimates resulting from integration of measurements and has been extended to multicompartment models and has been found useful in fast generation of parametric images [84–86].
2.14.6 Spectral Analysis
In compartmental model fitting, the number of compartments and their interconnection are defined a priori. This implies that the physiological or biochemical pathways are somewhat known. Yet, a priori knowledge about the behavior of novel anticancer drugs may not be available. Further, the compartmental modeling approach assumes well-mixed, homogeneous tracer distribution within the tissue or the ROI. This may not be true for tumor which normally has high degree of heterogeneity. Spectral analysis does not rely on tracer assumptions and the number of compartments and their connectivity; it is particularly useful for tracer kinetics studies.
Spectral analysis [87] fits the model defined in equation (2.22) with a predefined set of basis functions, eβ j t C p(t), where β j can take on a discrete set of values so that a large number (100 or more) of basis functions are generated. The fitting to tissue data is accomplished by nonnegative least squares (NNLS) algorithm with a constraint αi ≥ 0 [88]. Typically, a linear combination of only two or three basis functions from the complete set of basis functions are identified which can best describe the observed tissue data. From the fitted basis functions, the impulse response function and other physiological parameters can be estimated. Spectral analysis can also be applied to projection data directly, but it may not produce results equivalent to those obtained from reconstructed images because the NNLS fitting may not be linear [89].
Since spectral analysis does not require any a priori definition of the numerical identifiable components present in the PET data, it is more flexible than compartmental model fitting. However, the assumption on the nonnegativity coefficients of exponentials may not be valid in a generic compartmental model as
Quantitative Functional Imaging with Positron Emission Tomography |
95 |
negative coefficients of exponentials are also possible if the input and output are not taken from the same compartment [90]. Furthermore, repeated eigenvalues may be inherent in the data and the impulse response function of the underlying system could have different formats [91].
2.14.7 Weighted Integration
Another approach for dynamic PET data analysis is by means of weighted integration or integrated projection methods. Different from the techniques mentioned before which calculate parameters of interest from a series of reconstructed images based on the framework of compartmental model fitting, these methods eliminate the need to reconstruct the dynamic projection data. Instead, the parameters of interest are calculated from the weighted integrals of the projection data based on the relationship between the time-dependent weighting functions and the projection data [92–95]. Indeed, the weighted integration approach can be applied to the reconstructed data by integrating the full set of dynamic images. Reconstruction load, however, can be significantly reduced if the weighted integration is performed on the projection data because only the integrated projection data is reconstructed. This relies on the fact that image reconstruction is a linear operation in the spatial domain and the linear operations in time is communicative with image reconstruction [96, 62]. Therefore, the order of reconstruction and integration can be interchanged. It is apparent that integration of the projection data prior to image reconstruction has an attractive computational advantage.
Typically weighted integration or integrated projection methods are used to determine the rate of blood flow and the tissue-to-blood partition coefficient. In fact, the use of weighted integration does not limit to one-compartment model such as that used to measure cerebral blood flow. With the use of additional weighting functions, physiologic parameters in twoand three-compartment models can also be estimated. As might be expected, the formulation is considerably more complicated.
2.15 Applications of PET
As PET is a physiological/functional imaging modality, which provides information about the physiology in tissue, it is therefore complementary to the
96 |
Wong |
traditional tomographic imaging techniques, such as CT and MRI, that can provide anatomical (or structural) information of the tissue only. These latter techniques are method of choice when normal anatomy is expected to be disrupted by disease. However, there are many situations where functional changes precede anatomic changes or anatomic changes may be absent. Examples include cancers in their early stage, and various neurodegenerative diseases such as Alzheimer’s, Huntington’s, and Parkinson’s diseases, epilepsy and psychiatric disorders, [97–99], in addition to a wide variety of neuroreceptor studies [100].
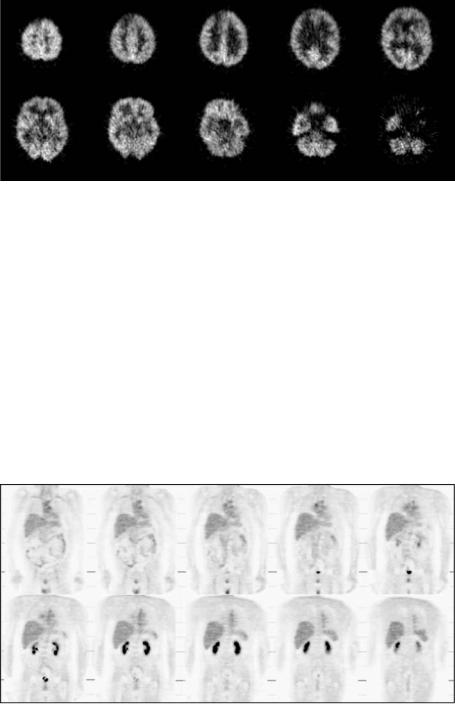
Historically, clinical applications of PET were centered around neurology and cardiology. The clinical role of PET has evolved considerably during the past 10 years, and it is well recognized that PET has a preeminent clinical role in oncology. Currently, oncological PET studies contribute to over 80% of clinical studies performed worldwide [101]. It is well recognized that PET is useful for monitoring patient response to cancer treatment and assessing whether lesions seen with CT and MRI are cancerous, and is capable of grading degree of malignancy of tumors, detecting early developing disease, staging the extent of disease, detecting primary site of tumor, measuring myocardial perfusion, differentiating residual tumor or recurrence from radiation-induced necrosis or chemonecrosis, and monitoring cancer treatment efficacy [102–107]. FDG is the primary radiopharmaceutical used in oncological PET studies to assess glucose metabolism. Improvements in instrumentation in the late 1980s overcame the limitation of the restricted imaging aperture and enabled three-dimensional whole-body to be imaged. Whole-body PET imaging has been proven highly accurate in the detection of a number of different malignancies, particularly in cancers of the colon, breast, pancreas, head and neck, lungs, liver, lymphoma, melanoma, thyroid, and skeletal system, depending on the use of specific radiotracers. Figures 2.11 and 2.12 show examples of neuro-oncologic and whole-body coronal FDG-PET images.
As mentioned in Section 2.3, PET offers some unique features that cannot be found in other imaging modalities. The radiolabeled compounds used in PET are usually carbon (11C), nitrogen (13N), oxygen (15O), and fluorine (18F), which can be used to label a wide variety of natural substances, metabolites, and drugs, without perturbing their natural biochemical and physiological properties. In particular, these labeled compounds are the major elemental constituents of the body, making them very suitable to trace the biological processes in the body. As the measurements are obtained noninvasively using external detectors,
Quantitative Functional Imaging with Positron Emission Tomography |
97 |
Figure 2.11: Neuro-oncologic FDG-PET images.
experiments can be performed repeatedly without sacrificing the small laboratory animals, such as mice and rats. This is not possible with in vitro tests which involve sacrifice of the animal at a specified time after radiotracer injection and preclude the kinetics of the radiotracer to be studied in the same animal. The greater flexibility in producing natural labeled probes for imaging on a macroscopic level in PET has raised the possibility of in vivo imaging on a cellular or genetic level. Recent advances in this field appear promising, particularly in the imaging of gene expression. Progress is being made and PET is expected to assume a pivotal role in the development of new genetic markers [108].
Figure 2.12: Whole-body coronal FDG-PET images.
98 |
Wong |
2.16 Discussion and Concluding Remarks
This chapter presented an overview of quantitative PET imaging, including the basic principles and instrumentation, methods of image reconstruction from projections, and some specific correction factors necessary to achieve quantitative images. Techniques for absolute physiologic parameters estimation based on the framework of tracer kinetic modeling are also introduced. Recent advances in instrumentation and detector technologies have partially resolved some of the challenges. Research is still under way to develop new detector materials not only for improving the spatial resolution but also the system sensitivity, while keeping the cost of the instrument acceptable. Another active research area is image reconstruction. Although the filtered backprojection method is still widely used nowadays, it is not an optimal reconstruction technique. Iterative algorithms have been shown to improve the signal-to-noise ratio of the reconstructed images and provide more accurate image reconstruction for low count studies, but the computational complexity and appreciably long reconstruction times as compared with filtered backprojection, as well as the requirement of using some ad hoc techniques to control the visual quality of the reconstructed images, remain a substantial obstacle for routine implementation. It should be noted, however, that a good reconstructed image is not only dependent on the reconstruction algorithm, but also dependent on the sufficient axial and angular sampling of projection data such that the reconstruction artifacts can be minimized. In order to achieve accurate absolute or relative quantification, appropriate data corrections have to be applied prior to image reconstruction.
The use of SPECT for studying physiologic functions deserves mention here. SPECT is another form of emission computed tomography which had its beginning in the early 1960s, initiated by the work of Kuhl and Edwards on transverseand longitudinal-section scanning with single-photon-emitting radiotracers [15], and the work of Anger on the development of scintillation camera (also known as gamma camera or Anger camera) coupled with photomultiplier tubes [108]. Although the innovative idea of how gamma rays interact with inorganic crystal (scintillator) to produce scintillation light and how optical coupling with photomultiplier tubes helps amplify the scintillation signal may shed some light on detector design in PET, the development of SPECT imaging, however, has been overshadowed by PET for reasons to be detailed. The principles for detecting
Quantitative Functional Imaging with Positron Emission Tomography |
99 |
the emerging radiation and the formation of tomographic images are similar for both PET and SPECT but the underlying physics and the instruments employed are completely different. In SPECT, nuclear decay results in the emission of one or a few uncorrelated photons in the 100–200 keV energy range. A lead collimator drilled with small holes is used to mechanically collimate the incoming photons by allowing those traveling in one particular direction to interact with the scintillator, while all others are absorbed. Rotating gamma cameras with single or multiple crystal detectors are used to form a tomographic image. Here lies the sensitivity differences between PET and SPECT, and partly explains why PET has received much more attention than SPECT for in vivo assessment and quantification of physiologic functions in the body.
Despite the fact that both PET and SPECT suffer from attenuation and Compton scattering of the photons inside the body which can result in image artifacts and loss of quantitative accuracy, SPECT has been largely considered to be nonquantitative and limited to providing qualitative or relative functional images. This is because correction of attenuation and scatter in SPECT are not easy as compared to PET, where attenuation correction is routine (with the exception of whole-body PET). In addition, the spatial resolution of SPECT is inferior to that in PET. Even with triple-headed gamma cameras, the resolution is approximately 8–10 mm FWHM but the theoretical limit of 1–2 mm FWHM can be achieved for PET with new generation of detector technology. Further, typically higher signal-to-noise ratio and lower scatter with PET also helped establish PET as the favorable method for quantitative measurements of physiological parameters.
Although PET will continue to provide insights into biochemical and physiological processes in vivo, access to PET is limited due to the requirement of a cyclotron and high operation costs. Recent advances in quantitative SPECT and the widespread application of multidetector SPECT systems with improved sensitivity and dynamic imaging capabilities have made absolute physiological parameter estimation possible with the much more widely available SPECT. One of the major applications of dynamic SPECT is to quantify myocardial perfusion, which is important for the diagnosis and clinical management of patients with coronary artery disease where a perfusion defect after an intervention may indicate incomplete reperfusion or persistent coronary occlusion. Similar to dynamic PET, compartmental modeling is used in dynamic SPECT to quantify physiologic
100 |
Wong |
parameters of interest. It has been demonstrated that myocardial blood flow can be studied by dynamic SPECT imaging of 99mTc-teboroxime [109, 110]. Another interesting application of dynamic cardiac SPECT is the measurement of perfusion and the distribution volume in the heart using 201Tl [111, 112]. Other applications include brain imaging with 99mTc and 123I flow agents and some neuroreceptor studies, such as [123I]iomazenil for benzodiazepine receptors [115], [123I]iododexetimide for cholinergic muscarinic neuroreceptors [114], and [123I]iodo-A-85380 for central neuronal nicotinic acetylcholine receptors [115, 116], etc., both in human and nonhuman primates.
While PET and SPECT allow absolute measurements of radioactivity concentration in tissue and have the capability to relate the in vivo measurements to physiological functions, there are a number of limiting factors which can impact on their ability to produce reliable physiologic parameters. In particular, the small tissue volume, limitation on the total amount of activity that can be administered, physical artifacts, and low sensitivity (particularly for SPECT) result in measurements with high noise levels. The measurement noise (and mechanical rotation of the detectors in the case of SPECT) has imposed an upper limit on the fastest sampling rate which is >1 sec/sample for PET and >5 sec/sample for SPECT. Furthermore, the short half-life of the radiopharmaceuticals used for PET and SPECT and the need for the patient to remain still on the scanner bed usually limit duration of the PET and SPECT experiments to relatively short periods of time, which vary from minutes to hours rather than days. Slow physiologic processes are therefore difficult to be reliably estimated with both PET and SPECT. All these factors limit the number of parameters which can be reliably estimated from PET or SPECT measurement and complicated compartmental models used for analysis must be simplified. Huang et al. provide detailed guidelines on kinetic model development for PET applications and these principles are equally applicable to SPECT tracer studies.
One intrinsic limitation of PET imaging is the presence of physiological sites of tracer accumulation (secretion or excretion). It is sometimes difficult to differentiate real pathology from an unusual pattern of physiologic accumulation. In contrast, some organs of the body, for instance, the pancreas, uterus, and ovary, do not have significant physiological uptake. Spatially differentiation among these organs is sometimes difficult, particularly when they are closely related to one another. In this respect, structural imaging modalities such as X-ray CT can serve as an excellent anatomical roadmap for the functional PET images.
Quantitative Functional Imaging with Positron Emission Tomography |
101 |
Integration of anatomical and functional images began to emerge during the late 1980s using software-based registration techniques [117, 118], although it was pointed out much earlier by Wagner [119] that this would be the trend for clinical imaging. These software-based registration techniques are applied to register images obtained with different imaging modalities or tracers (in case of registering emission tomographic images), of the same subject at different times. Registration techniques are successful for a rigid organ, such as the brain but they have been found to be problematic for other parts of the body.
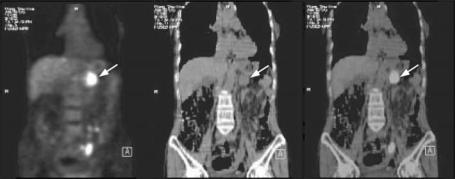
Recognizing the advantages of combining the information provided by anatomic imaging and functional imaging, a prototype of an integrated scanner for PET and CT was designed in the early 1990s and a commercial hybrid scanner, named “PET/CT,” has been developed recently [120]. PET/CT is a completely new imaging technique that will likely revolutionize the conventional habit of acquiring and reading PET and CT data separately in the clinical environment. PET/CT imaging will enhance the combined utilization rate of what used to be PET-only or CT-only imaging as it provides, simultaneously, co-registered (fusion) images of both functional and anatomical information in a single acquisition. A potential advantage is the use of CT images for attenuation correction of PET emission data, thereby the need for acquiring a separate, lengthy transmission scan can be completely eliminated. Figure 2.13 shows a combined PET/CT
Figure 2.13: (Color slide) Combined PET/CT scan on a 72-year-old woman with a primary pancreatic cancer. From left to right: FDG-PET image, CT image, and fused PET and CT images. The scan shows abnormal FDG uptake in the pancreas (arrow). The fused image shows good alignment of two modalities and enables uptake to be localized to pancreas (arrow).
102 |
Wong |
scan performed on a 72-year-old woman for investigation of unknown primary malignancy, and the combined PET/CT revealed a primary pancreatic cancer. Although the PET/CT imaging is still in its infancy and a number of technical problems remain to be solved, it is anticipated that the combination has the potential to solve many of the present diagnostic challenges associated with whole-body oncologic imaging and has an important role in surgical planning, radiation therapy, treatment monitoring, and diagnosis of disease.
Acknowledgment
This work was supported by the Hong Kong Polytechnic University under Grant G-YX13.
Questions
1.Medical imaging modalities can be broadly classified into structural and functional. Briefly account for their meanings and give some examples for each case.
2.What are the major differences in the reconstructed images of emission computed tomography and X-ray CT?
3.PET and SPECT are collectively known as emission computed tomography. Briefly describe some of the major differences between them in terms of physics and instrumentation.
4.List the various events and their meanings in PET detection.
5.List some of the current applications of PET in clinical oncology.
6.Photon attenuation effect is common to both PET and SPECT imaging. Why is it so important to correct for this effect?
7.Briefly describe the main difference in correction of photon attenuation in PET and SPECT.
8.Attenuation correction in PET is usually performed using a transmission scan. What are the major drawbacks of this approach?
Quantitative Functional Imaging with Positron Emission Tomography |
103 |
9.What is the basic assumption of filtered backprojection reconstruction? What is its major drawback?
10.What are the main factors that determine the suitability of a scintillator for PET imaging?
11.What is the main goal of tracer kinetic modeling?
12.Briefly describe some parametric imaging techniques for quantitative physiological parameter estimation in dynamic PET and SPECT.