

Kluwer - Handbook of Biomedical Image Analysis Vol
.1.pdf84 |
Wong |
In this section, we briefly describe some of the major factors that directly relate to the spatial resolution of PET. Spatial resolution is defined as the ability of the scanner to depict small objects and is limited by a number of factors:
distance the positron travels before it annihilates;
annihilation photon noncollinearity due to residual momentum of the positron;
intrinsic resolution and size of the detectors;
stopping power (and material) of the detector,
sampling requirements, and
image reconstruction parameters (e.g., reconstruction filter, matrix size, reconstruction algorithm, etc).
The finite distance travelled by the positron before annihilation also has adverse effects on the spatial resolution of PET scanner [52]. This distance is referred to as the positron range which varies from fraction of a millimeter to several millimeters, depending on the density of the tissue in which the emission occurs and the maximal positron energy of the radionuclide (Eq. (2.3) and Table 2.1). It is apparent that a positron with higher energy can travel farther from the nucleus before annihilation occurs. This effect leads to a blurring of the data which is characterized by an exponential function with a FWHM of the order of 0.2–3 mm for most positron-emitting isotopes.
Another factor which can degrade the spatial resolution is caused by the residual kinetic energy and momentum possessed by the positron and the electron (because both of them are moving) when they annihilate. The apparent angle between the two emitted photons deviates slightly from 180◦ for about 0.5◦ FWHM. The degradation in resolution due to this photon noncollinearity effect depends on the diameter of the detector ring of the PET scanner. This effect, and the positron range, imposes a lower limit of the spatial resolution which is approximately 3 mm for human PET imaging and 1 mm for a small-diameter animal PET system.
The intrinsic resolution of the detectors is the crucial factor which determines the spatial resolution of modern PET scanners. For arrays of a singleelement detector of width D, the resulting coincidence point spread function is
Quantitative Functional Imaging with Positron Emission Tomography |
85 |
triangular with spatial resolution approximately D/2 [53]. It is therefore apparent that a small detector must be used, in order to achieve high spatial resolution [54]. Most of the modern clinical PET scanners utilize multiple rings of BGO block detectors to simultaneously achieve high spatial resolution and sensitivity (Section 2.7). BGO crystals are commonly used in commercial PET systems because they have high stopping power (high efficiency) for the 511 keV gamma rays and high spatial resolution (≈5 mm which is near the theoretical limit of resolution), and are 50% more efficient than NaI(T1) crystals. However, the major disadvantages of BGO crystals are that their photofluorescent decay time is very long (0.3 µs) which causes countrate limitations and that they have lower light output. During the last decade, many scintillators have been explored and some of them are currently in use in new generation of PET scanners. The best known ones are barium fluoride [55] and gadolinium oxyorthosilicate [56]. Block detectors are also being developed with lutetium oxyorthosilicate (LSO) [57], a new detector material which has much shorter photofluorescent decay time and provides higher spatial resolution images. The images obtained with PET device built from LSO detectors are much sharper and they can be acquired at a much faster rate than current PET scanners. Therefore, faster scans and higher patient throughput can be achieved. Many of PET centers in the world have installed, or planned to install, the latest generation of LSO-based PET scanner such as the ECAT HRRT system (CTI/Siemens, Knoxville, TN).
Spatial resolution is also affected by the coincidence events detected by the PET scanner, as described in Section 2.8. Image reconstruction algorithms also have an impact on the spatial resolution that can be achieved with modern PET scanner. The statistical nature of radioactive decay described by Poisson distribution produces noise in the PET measurements. This noise can be amplified by the reconstruction process and visualized in the reconstructed images due to its high-frequency nature. In order to suppress noise in the reconstructed images with FBP, the projection data (or sinogram) has to be filtered with a ramp filter (in frequency domain) before the reconstruction process [31, 58]. However, the side effect of the ramp filtering is that high-frequency components in the image that tend to be dominated by statistical noise are amplified [32]. To obtain better image quality, it is desirable to attenuate the high-frequency components by using some window functions, such as the Shepp–Logan or the Hann windows, which modify the shape of the ramp filter at higher frequencies [33]. Although the use of window functions can help control the image noise and thereby increase
86 |
Wong |
the signal-to-noise ratio, the spatial resolution must degrade because reducing the higher frequencies is equivalent to smoothing the image data. A recent study found that it is difficult to select a filter for FBP based on some objective criteria [59]. The trade-off between filter selection (or image noise) and spatial resolution is therefore dependent on the preferences of the clinical physicians and the types of PET study.
As the overall resolution of PET imaging system is a convolution of all of the above components, it is therefore important to note that improvement in resolution by considering only one of the above components in designing a high-resolution PET imaging system will produce limited improvement in the resulting spatial resolution [60].
2.14Quantitative Physiological Parameter Estimation
PET is a unique and state-of-the-art imaging tool in that it is able to target specific biochemical or physiologic processes using short-lived radiopharmaceuticals (or radiotracers) of major elemental constituents of the body, such as carbon, fluorine, nitrogen, and oxygen; and that the time course of radiotracer in the body can be recorded and reconstructed as multidimensional images which represent the radiotracer distribution in the body. With an appropriate reconstruction algorithm and with proper corrections for physical artifacts, quantitatively accurate radiopharmaceutical distribution can be obtained and calibrated in absolute units of radioactivity concentration (in kBq/mL or nCi/mL). However, the radiotracer distribution in the body is not static over the course of the study, but varies with time, depending on the different processes that govern its delivery, uptake, and subsequent biologic fate in the body. By acquiring a dynamic sequence of tomographic images, quantitative information of the time-varying radiopharmaceutical distribution can be obtained which can be used to provide in vivo measurements of specific physiologic functions.
2.14.1 Tracer Kinetic Modeling
Radiotracers provide a means for investigation of biochemical or physiologic processes without altering the normal functions of the biologic system. Each radiotracer must be targeted to provide a physiologic parameter of interest, such

Quantitative Functional Imaging with Positron Emission Tomography |
87 |
as blood flow, glucose metabolism, oxygen utilization, protein synthesis, and receptor or binding site density, etc. in the body. The concentration of the radiotracer introduced into the biologic system is assumed to be negligible so that it does not perturb the natural process of the system. Otherwise, the measurement does not represent the process we want to measure but the effect induced by the introduction of the radiotracer. External measurable data is the time course of total tissue activity concentration obtained from the PET images, and the time course of blood (or plasma) activity concentration (i.e. the input function of the compartment model), obtained from peripheral blood sampling. These curves are described as time-activity curves (TACs), where the term “activity” refers to concentration of the radiotracer rather than the tissue (or blood) activity. Yet, the measured time course of tracer uptake and delivery does not directly provide quantitative information about the biologic and physiologic processes but the kinetic information of the radiotracer. Mathematical modeling of the measured tracer kinetics is thus required to transform the kinetic information into physiologically meaningful information, i.e. the physiologic parameters of interest. This can be accomplished through the use of an analysis technique commonly referred to as compartmental or tracer kinetic modeling.
Mathematical modeling of biologic processes and systems is well established and a wide variety of models have been developed [61]. Although nonlinear models should be used to study biological systems which are commonly nonlinear, linear compartmental models have properties which make them attractive for radiotracer experiments with PET and SPECT [62]. A given system can be described by a compartment model, which consists of a finite number of interconnected compartments (or pools), each of which is assumed to behave as a distinct component of the biologic system with well-mixed and homogeneous concentration [63]. An example is shown in Fig. 2.9 for [18F]fluorodeoxyglucose, which is the primary radiopharmaceutical used in PET to assess glucose metabolism. A compartment can be a physical space, such as plasma or tissue, or a chemical entity, where tracer may exist in different forms
k1 |
|
k3 |
FDG in plasma |
FDG in tissue |
FDG -6-P in |
Cp(t) |
Ce(t) |
tissue Cm(t) |
k2 |
|
k4 |
Figure 2.9: The three-compartment model for transport and metabolism of
[18F]fluorodeoxyglucose (FDG).
88 |
Wong |
(FDG and its phosphorylated form FDG-6-PO4). The compartments of a tracer kinetic model are linked by a set of parameters called rate constants, ki, which represent the rates at which the radiotracer in one compartment is transported to the connected compartments. More precisely, these rate constant parameters represent specific physiologic or biochemical processes (e.g. flow or transport across physical spaces, or rates of transformation from one chemical form to the other in a chemical entity) within the biologic system. For the FDG model as shown in Fig. 2.9, the three compartments represent (from left) vascular space for FDG, tissue space for free FDG, and tissue space for FDG-6-phosphate (FDG- 6-P). The rate constants describe the movement of FDG between compartments: k1 and k2 for the forward and backward transport of FDG across the blood-brain barrier, k3 for the phosphorylation of FDG to FDG-6-P, and k4 for the dephosphorylation of FDG-6-P back to FDG.
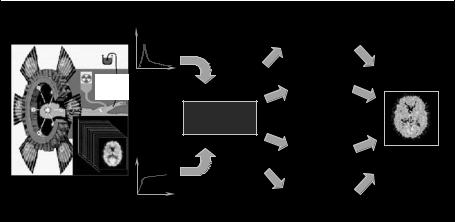
The aim of modeling is to interpret the fate of the administered radiotracer quantitatively in terms of the standard parameters in the compartmental model. In conjunction with knowledge of the transport and metabolism of the radiotracer, it is possible to relate the rate constants to physiologic parameters of interest. Figure 2.10 summarizes the key steps in physiologic parameter estimation
Acquired arterial
blood samples |
Plasma/Blood |
Compartmental |
|
TAC |
|
||
(input function) |
|
||
|
model fitting |
|
|
|
|
|
|
Injected |
|
Weighted |
Physiological |
|
parameters |
||
or inhaled |
|
||
tracer |
|
integration |
|
|
|
Compartment |
|
|
|
model |
|
|
Tissue TAC |
Graphical |
|
|
techniques |
e.g. rCBF, |
|
|
|
||
|
|
|
rCMRGlc, |
Acquired |
|
Spectral |
Vd, BP, etc. |
|
|
||
PET images |
|
analysis |
|
(output function) |
|
|
|
Figure 2.10: (Color slide) Quantitative physiological parameter estimation with PET includes radiotracer administration, data acquisition with a PET scanner, measurement of tracer plasma concentration, a suitable mathematical model and a parameter estimation method to estimate the physiological parameter of interest.
Quantitative Functional Imaging with Positron Emission Tomography |
89 |
in a quantitative PET study. After radiopharmaceutical administration, PET data is acquired at a predefined sampling schedule and individual voxel values in the reconstructed images represent the localized radiotracer time-activity concentration in the body upon correction for some degrading factors (e.g. attenuation and scatter) and cross-calibration. A vector formed by extracting a voxel curve from the sequence of images corresponds to a tissue TAC, which represents the response of the local tissue as a function of time after the tracer administration. Alternatively, the tissue TAC can be obtained by manual delineation of region of interest (ROI) on the reconstructed PET images. Plasma tracer concentration is typically measured by means of arterial blood sampling. A mathematical model is applied to the tissue and the plasma tracer concentration to estimate the physiological parameters of interest. Kinetic modeling approaches based on the framework of tracer kinetic modeling could be applied to estimate the physiologic parameters. The same analysis procedures can also be applied to dynamic SPECT without loss of generality, although the challenges tend to be much greater in SPECT.
2.14.2 Compartmental Model Fitting
As the rate of tracer exchanges is assumed to be proportional to the amount of tracer in the compartment, a system of first-order differential equations can be derived. Compartmental model fitting performs the mathematical estimation process to seek the values for the rate constant parameters that provide a best fit for the observed tissue and blood (or plasma) TAC to the predefined compartmental model. The general solution to the system of first-order differential
equations has the form
N
CT (t) = (1 − VB) |
α j eβ j t C p(t) + VBCa(t) |
(2.22) |
|
j=1 |
|
where CT (t) is the measured time course of total tissue activity concentration (or tissue TAC) in the FOV, C p(t) is the input function of the compartment model,
Ca(t) is the tracer concentration in whole blood, N is the number of tissue compartments assumed for the radiotracer, α j and β j are the fitted parameters from which the rate constant parameters, ki, of the compartment model can be derived, VB is the fraction of the measured volume occupied by the blood pool (0 ≤ VB ≤ 1), and is the convolution operator. It is assumed that C p(t)
90 |
Wong |
and Ca(t) have been corrected for delay and dispersion. The term VBCa(t) in Eq. (2.22) represents intravascular activity present in the FOV of the scanner and is particularly important at the times immediately following tracer administration. Note that although CT (t) has an analytical representation, it is a nonlinear function of parameters α j and β j , and therefore nonlinear parameter estimation approach such as the nonlinear least-squares (NLLS) method using Gauss–Newton type algorithms [64] is required to estimate the parameters α j and β j , unless the model equation is “linearized” by certain transformations. Alternatively, the rate constant parameters in the system of differential equations can be estimated directly by numerical method.
Ideally, a comprehensive model describing the full kinetics of a tracer is desirable, but this may require a complicated compartmental model configuration with many parameters and compartments. Given that the counting statistics of the acquired data and the spatial resolution of the imaging device are limited, the compartments and parameters in the complicated compartmental model cannot be resolved and identified from the measured data. Thus, the actual compartmental model configuration must be simplified. Typically, measured data from PET and SPECT can support compartmental models with six parameters or less. In general, including more number of compartments (or parameters) or increasing the complexity of the model improves the fit to the measured data. However, the improvement in the fitting may not be statistically significant. In many cases, the reliability of individual parameter estimates degrades with increasing number of compartments (or model complexity). Therefore, the model with the smallest number of compartments which can fully describe the measured data should be used.
2.14.3 Input Function
For compartmental models used in PET, one of the compartments represents blood pool or extravascular space. This compartment can be seen as the input stage to the model because the tracer is delivered into the tissue through the blood, as indicated by Eq. (2.22), and therefore the time-activity concentration for blood is called input function. In other words, the time-activity concentration of the tracer in a particular tissue is dependent both on the amount of the tracer delivered to the tissue via the blood supply (the input function) and on the
Quantitative Functional Imaging with Positron Emission Tomography |
91 |
exchanges of the tracer within the tissue compartment (the impulse response function of the tissue).
Ideally, the input function should be measured in the capillaries of the tissue of interest but this is not possible. Instead, samples are obtained by frequent blood sampling at the peripheral artery such as radial artery or femoral artery, under local anesthesia. The arterial concentration of the tracer has to be measured because the concentration of the tracer in venous blood may differ markedly from that in arterial blood. This is particularly true for tracer with high extraction fractions. Unless the tracer can freely diffuse between red blood cells and plasma, the concentration time course in plasma is required for the input function. Another consideration is the in vivo formation of radiolabeled metabolites that can contribute to the radioactivity counts in total plasma or whole-blood, necessitating a time-dependent estimation of the fraction of radiolabeled metabolites present in plasma. Estimation of radiolabeled metabolites in plasma is often possible by means of chromatographic analysis (e.g. using HPLC, TLC, or octanol extraction) for the measured samples. Modeling of metabolites formation is also possible [65,66], but the statistical quality of the measurements may not support reliable estimation of the additional parameters in the more complicated compartment model.
Arterial blood sampling is currently regarded as the gold standard method of measuring the input function for PET study in spite of many possible sources of error such as insufficient sampling rates and counting errors in the blood samples. Particularly for radiotracers with rapid kinetics and short measurement times, delay and dispersion effects between the blood sampling site and the actual arterial blood that drives the tissue of interest need to be taken into account during the compartmental model fitting. The procedure of arterial catheterization under local anaesthesia, however, is very invasive in nature and would involve potential risks of arterial sclerosis and ischemia to the distal extremity. An alternative, yet less invasive, approach is to obtain blood samples from arterialized-vein (or “hot” vein). This method is referred to as the arterializedvenous (a-v) sampling method. The hand is heated in a water bath which then promotes arterio-venous shunting to avoid the discomfort and risks associated with arterial cannulation [67, 68]. Since it only requires the placement of venous cannulas, it is less invasive and is better tolerated than arterial cannulation by the subjects. However, it requires prolonged hand warming to ensure adequate shunting, and it is very dependent upon the site chosen for the placement of the
92 |
Wong |
venous cannula and the rate of blood flow. The best results are usually obtained from a cannula that is placed in a large vein on the dorsum of the hand, typically in a muscular male. As mentioned earlier in this section, tracer concentration in venous blood may differ markedly from that in arterial blood, especially for tracer with high extraction fractions, and the use of venous blood as the input function could introduce significant errors in absolute quantification of physiological parameters.
When a suitable vascular structure, such as a large artery or the left ventricle, is contained within the FOV, the input functions can be derived noninvasively from the image data and the need for blood sampling is completely eliminated. However, careful correction for the extravascular contamination in the blood region is required to obtain an accurate approximation to the input function. In certain circumstances, if regions can be identified with the same input but with different kinetic behavior (e.g. gray and white matter in the brain), then the compartment model can be reformulated to solve for the kinetic parameters of interest and the required input function [69–71]. However, these approaches may have very high computational complexity as the number of parameters to be estimated (kinetic parameters and the input function) increased drastically and careful selection of parameter estimation algorithm may be required.
In the case of receptor studies, the need for measuring arterial input function may be avoided if a tissue region can be identified which is devoid of specific binding but shows similar nonspecific binding to the tissues of interest. Typically, the cerebellum is used as a reference tissue region in the brain for a number of neuroreceptor systems. Once the reference tissue region is identified, the compartmental model can be reformulated to use the reference tissue TAC as the input function [72–74]. The use of reference tissue also eliminates the need to estimate the fraction of labeled metabolites present in the plasma.
2.14.4 Parametric Imaging
PET (and SPECT) provide multidimensional images of the time-varying radiopharmaceutical distribution. The aforementioned compartmental analysis has concentrated only on fitting tissue TACs derived from ROIs to a predefined compartment model. Although it is possible to generate TACs for each voxel of the image data and fit them to the model, this is not practical as many thousands of model fit using NLLS, which is computationally expensive, would have to be performed. Further, the high noise levels and heterogeneity in individual
Quantitative Functional Imaging with Positron Emission Tomography |
93 |
voxel curves make the compartmental model fitting approach unappealing. A number of “fast” estimation techniques have been developed to reduce the computational load and improve the reliability of estimating images whose voxels represent parameters of interest, commonly known as parametric images. A brief description of these estimation techniques follows.
2.14.5 Linearization Approaches
Linearization approaches reformulate the model equations so that (1) a linear relationship exists between the transformed data and the primary physiological parameter of interest, or (2) the reformulated model equations contain only linear parameters. In these circumstances, estimation of parameters can be accomplished by a simple linear regression or by linear least-squares (LLSs) techniques.
A number of graphical techniques that aim at transforming the measured data into a plot which is linear after a certain “transformed time” have been proposed for specific tracer studies, including the Patlak [75, 76], Logan [77, 72], and Yokoi [78, 79] plots. Applications of the techniques depend on the tracer studies and parameter of interest. The Patlak plot [75] was initially developed for estimating the influx rate constant of radiotracer accumulation in an irreversible compartment, and was extended to allow for slow clearance from the irreversible compartment [76]. When employed in FDG studies, the influx rate constant is directly proportional to the regional metabolic rate of glucose. The Logan plot [77, 72] was primarily developed for estimation of parameters related to receptor density such as binding potential and volume of distribution for neuroreceptor studies and the radiotracers can have reversible uptake. The Yokoi plot [78, 79] has been proposed as a rapid algorithm for cerebral blood flow measurements with dynamic SPECT. Although all these methods permit the estimation of physiologic parameter in rapid succession and have been used extensively because of their computational simplicity, the bias introduced into the physiologic parameters is significant in the presence of statistical noise in the image data.
The use of linearized model equations was first proposed by Blomqvist [80] for the Kety–Schmidt one-compartment model used for measuring cerebral blood flow [81] and was extended by Evans [82] for the three-compartment model (as shown in Fig. 2.9) to measure cerebral metabolic rate of glucose. The key idea is that by reformulating and integrating the model equations, the