

Kluwer - Handbook of Biomedical Image Analysis Vol
.1.pdf144 |
Rakesh Sharma and Avdhesh Sharma |
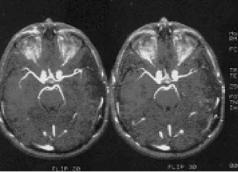
Figure 3.12: Three-dimensional TOF angiogram (left panel) shows cavernous angioma with visible methemoglobin due to short T1 due to simulated blood flow. For comparison, SPGR images are shown with high signal intensity center representing methemoglobin.
result is bright signal intensity in the images, which may simulate flow-related enhancement.
3.2.2.1.3Echo Time (TE). Lower TE reduces motion-induced phase errors. Partial RF pulses reduce the minimum TE while these RF pulses preserve an acceptable slab profile. Very low TE may be achieved by removing flow compensation from the gradient waveform. Thus there is a trade-off between minimum echo time at the cost of flow compensation. This approach is currently used for clinical imaging.
3.2.2.1.4Flip Angle. Flip angle has an effect on intravascular signal intensity and background suppression. Smaller arteries may be visualized at flip angles of 15–20◦ with TR of 40 msec. Stationary tissues exhibit greater saturation at a larger flip angle. For example, small 3D volumes of 28 slices show intravascular signal intensity of larger arterial structures at flip angles 20–35◦ with rapid flow. Arterial flow begins to saturate at flip angles greater than 40◦. It results in reduced intravascular signal intensity (see Fig. 3.13).
3.2.2.1.5Flow Compensation. Flow compensation is critical in 3D TOF MRA. Motion-induced phase dispersion results in signal void areas. These areas are frequently identified within the juxtasellar carotid arteries and proximal middle cerebral arteries. These signal void areas can be minimized by the use of shortest possible TE with flow compensation applied in the slice-select and read-out directions. This combined approach reduces the phase dispersion and
Advances in Magnetic Resonance Angiography |
145 |
Figure 3.13: Effect of flip angle in 3D TOF angiogram images shows at different flip angles 20◦ (left) and 30◦ (right).
therefore maximizes intravascular signal. Intraluminal signal loss may still occur in spite of the use of first-order motion compensation. High order motions such as jerks and acceleration may still produce regions of signal loss due to the phase dispersion. For instance, blood flow in carotid siphon experiences centripetal acceleration along the carotid vessel’s outer wall. In 3D TOF images, the effects of acceleration are not compensated and result in linear regions of signal loss at curves in the carotid artery and proximal middle cerebral artery. However, magnetic susceptibility effects from the adjacent paranasal sinuses play a minor role in the loss of signal intensity in the juxtasellar carotid artery and proximal middle carotid artery at short TE. Mostly, signal intensity losses are observed at the bends of these arteries during diastole. Higher order motion compensation gradients extend TE. At extended TE, susceptibility effects are significant and the signal loss is more apparent.
3.2.2.1.6 Slice Thickness. Slice thickness also contributes to signal loss. Thicker slices show significant signal loss. Thin slices exhibit phase dispersion within the voxel which minimizes signal loss and effects of intravoxel dephasing. However, thin slices reduce signal-to-noise ratio and the volume of interest.
Other important refinements in this technique are described in Section 3.4.
3.2.3 Phase Contrast MRA
Phase contrast (PC) MRA is based on the fact that the phase gain of flowing blood through a gradient is proportional to its velocity (assuming constant velocity).
146 |
Rakesh Sharma and Avdhesh Sharma |
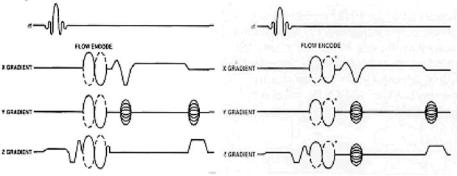
Figure 3.14: Two-dimensional Phase contrast pulse sequence (left) and 3D phase contrast pulse sequence (right) are shown with velocity-induced phase shift to distinguish stationary and flowing spins. In both 2D/3D PC MRA, two or more acquisitions with opposite polarity of the bipolar flow-encoding gradients are subtracted to produce image of vasculture while these gradients are not applied to all three axes simultaneously.
Phase (φ) and velocity (ν) are related by
φ = ∫ ωdt = ∫(γ Gνt) dt =1/2 γ Gνt2 |
(3.13) |
Therefore, knowledge of the phase at any point in time allows us to calculate the velocity. The most common method for PC MRA is the use of bipolar gradient (see Fig. 3.14). This process is called flow encoding. Because the two lobes in this bipolar gradient have equal areas, stationary tissues observe no net phase change. However, flowing blood will experience a net phase shift proportional to its velocity (assuming a constant flow velocity). This is how flow is distinguished from stationary tissue in PC MRA (see Fig. 3.15).
PC MRA is illustrated for 2D PC and 3D PC MRA, respectively in the following section. At this point, it is important to describe “flow phase,” “velocitydephasing,” and the distinction between “magnitude” image and “phase” image.
Flow image results from phase changes in transverse magnetization of spins moving along a magnetic field gradient. These phase shift effects can be used to generate flow images to quantify flow velocities. These phase effects are also present in stationary spins due to differences in their precession frequency. Stationary tissues dephase over time in a spatially-dependent magnetic field gradient. This dephasing can be exactly compensated to form an echo using a
Advances in Magnetic Resonance Angiography |
147 |
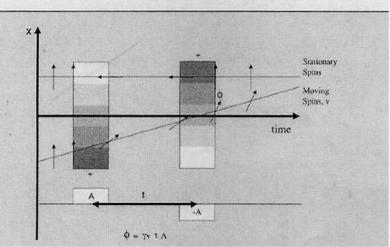
Figure 3.15: Flow is encoded in one direction using bipolar gradients. Through encoding, stationary tissue receives zero phase shift, φ, while moving spins receive a phase shift proportional to their velocity, v.
second gradient in the opposite direction. Flowing spins change the position during application of the dephasing and rephasing gradients (see Fig. 3.16). As in PC MRA, both magnitude and phase images can be obtained with information on direction of flow in the vessel (see Fig. 3.17).
The effect of velocity-dephasing on phase information indicates the flow direction in right–left (R/L), superior–inferior (S/I), or anterior–posterior (A/P). This effect may be described as follows: flow-induced different phase shifts are generated due to spins moving in-plane along frequency gradient in different directions (see Fig. 3.18 shown by zig-zag arrows). Conventionally, spin flow is higher at the center than near the wall due to laminar flow. Due to this difference, spins at the center cause larger phase shift than the phase shift by slower peripheral coherence. This results in velocity dephasing and total signal loss called “flow void.” In this way, phase information is transferred to a magnitude contrast.
3.2.3.1 2D Phase Contrast Angiography
The primary advantage is that a variety of velocity encoding may be opted in a short period of time (within a few minutes). If limited angiographic information

148 |
Rakesh Sharma and Avdhesh Sharma |
Figure 3.16: Flow phase dephasing and rephasing: stationary pins are dephased between the first gradient pulse that later rephrased in opposite direction at the echo time . Moving spins acquire an additional phase shift φ as they move along a spatially dependent gradient.
Figure 3.17: Two-dimensional MRA (left on top) and 3D MRA (bottom on left) angiogram images are shown to highlight the limitations and advantages of each. Magnitude contrast provides signal enhancement over long distance (on right).

Advances in Magnetic Resonance Angiography |
149 |
Figure 3.18: (top): Velocity dephasing: Moving spins show different velocity profile. They acquire a net velocity dependent phase shift indicated by the zig-zag arrows. Different flow phases within one volume element cause signal attenuation in that region. A representative RACE pulse sequence is shown (bottom).
is needed, 2D phase contrast images may be sufficient to define the anatomy of interest. To overcome this problem, RE pulse sequence is used to generate velocity profiles inside the vessels (see Fig. 3.19). It uses slice selective gradient and modulated RF pulse to excite a slice perpendicular to the flow direction. An echo is read out thereafter. Spins flowing in this slice experience a phase shift moving along the slice selection gradient because a read-out gradient is also used perpendicular to flow. It allows correlation of phase shift with position across the vessel diameter for generating a phase-shift profile which is linear with velocity profile (see Fig. 3.19). Another advantage of 2D phase contrast

150 |
Rakesh Sharma and Avdhesh Sharma |
Figure 3.19: Two-dimensional phase contrast localizer as guide image to apply multiple velocities in a short period of time (left panel on top row). Sagittal 2D phase contrast angiogram images are shown at VENC 20◦ to highlight draining veins of AVM (panel in center) and VENC 80◦ to highlight arterial supply (right panel on top row). Axial collapsed image from 3D TOF angiogram shows clear delineated AVM nidus (left on bottom row). Axial collapsed images from 3D phase contrast angiogram is shown with greater signal intensity in the left hemisphere arterial structures (right panel on bottom row).
angiography is that, by varying the VENC, the user can generate images of the arteries or the veins. Vascular occlusions can also be confirmed by imaging at slower flow rates. However, 2D techniques are faster than 3D techniques while 3D PC MRA generates better SNR.
3.2.3.1.1 Image Acquisition. Here bipolar phase-encoding gradients are used in a fashion analogous to 3D PC techniques. Instead of 3D volume, however,
Advances in Magnetic Resonance Angiography |
151 |
the system collects and displays the data as a series of thick slices or a single slab. The slices, or slab, are then projected onto a single plane. The most efficient way to acquire 2D PC angiogram is to use the shortest possible repetition time and a large number of excitations, e.g. NEX = 2–16.
The optimized NEX permits data emerging during an R-to-R interval for each set of the phase-encoding gradients. Since the data is averaged during the entire cardiac cycle, the resulting angiogram will be a measure of the average flow. Averaging also reduces ghosting artifacts. 2D phase contrast images may also be obtained without the use of flow compensation, to minimize echo time.
3.2.3.1.2Dynamic-Range Compression. Compared with the signal coming from all the other spins in the regions being imaged, the MR signal from moving blood is very small. Since the primary mechanism of stationary-spin suppression is the subtraction of two excitations drawing most of their MR signal from nonmoving spin, minor errors in the stationary-spin signal prohibit good background suppression.
To overcome this problem, a projection-dephasing gradient can be applied to diminish signal from thick objects. This gradient has little effect on vascular signal because the vessels are small with respect to the head and neck. For this reason, the signal from stationary tissues is substantially suppressed, while the MR signal from vessel is only slightly diminished (see Fig. 3.20). This results in a reduction in dynamic range (an important imaging enhancement for PC angiography). Projection dephasing may also modify the appearance of vessels separated in the direction of projection. Under these circumstances, the region of overlapped vessels may exhibit enhanced signal intensity, reduced signal intensity, or no change in intensity.
3.2.3.1.3Cardiac-Gated 2D Phase Contrast Angiography. Cardiac gated 2D phase contrast angiography is based on cine MR acquisition methods in which TR remains constant, and each step in phase encoding is initiated by the ECG trigger. The cine gradient echo pulse sequence is modified to include bipolar gradients for positive and negative flow encoding in a fashion analogous to multislice/slab 2D phase contrast angiography. The velocity encoding is also similar to nongated 2D PC MRA. With this approach, up to 32 points in the cardiac cycle are retrospectively sorted from the scan data. Magnitude and phase images are then generated for each point in the cardiac cycle. On the phase
152 |
Rakesh Sharma and Avdhesh Sharma |
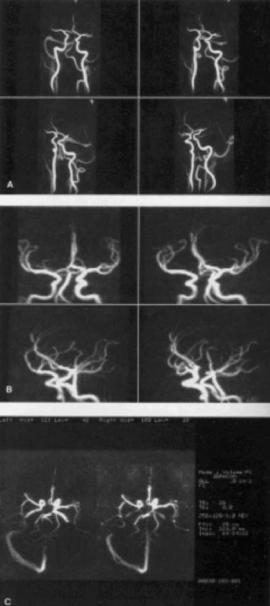
Figure 3.20: Three-dimensional Phase contrast angiograms are shown as normal four projection images for normal vasculature with no signal loss (panels A); 3D PC angiogram of intracranial arteries showing well visualized middle cerebral artery and anterior cerebral artery (panels B); 3D PC angiogram axial projection image from 2 mm slice (left) and 5 mm slice (right) (panels C). Using single projection, thicker slices can be achieved at less imaging time.
Advances in Magnetic Resonance Angiography |
153 |
images, signal intensity is proportional to blood flow velocity for each phase of the cardiac cycle. The phase images also display the direction of blood flow; a bright vascular structure represents flow in the same direction as the flowencoding gradient, while dark vessels indicate flow in the opposite direction. Scan information may be acquired in a multislice or projection/slab format. This technique allows the assessment of alterations in hemodynamic conditions during the cardiac cycle. Phase contrast angiograms may also be obtained using a projection technique, to create a single-projection angiogram through a selected volume of interest.
3.2.4 3D Phase Contrast Angiography
3D PC MRA technique relies on velocity-induced phase shifts to distinguish flowing blood from surrounding tissue. The phase contrast approach can be made sensitive to slow flow in small vessels. The reason for this can be attributed to the fact that the contrast between flowing blood and stationary-tissues is related to blood velocity, rather than stationary-tissue T1. PC angiography also permits excellent cancellation of stationary tissues and offers the potential for quantitative measurements of blood velocity.
3.2.4.1 Image Acquisition
To understand the mechanisms of image acquisition during phase contrast vascular imaging, conventional, rotating-frame vector of spin magnetization provides a simple picture. This is described in the following section. After a 90◦ pulse has been applied to the equilibrium magnetization, the spin is rotated into the transverse plane, on an axis perpendicular to the static magnetic field B. Here, it precesses at the Larmor frequency; at any moment in time, the magnetization can be described by the length of the magnetization vector and its phase in relation to reference positions. As this precession continues, the phase of the magnetization vector or the phase angle varies. It is primarily because of the effect of the main magnetic field, although smaller contributions may also change the rate of phase evolution. For example, if the local magnetic field of spin is changed by a magnetic field gradient, the spin’s Larmor frequency will be slightly different and the rate of change of the phase will be altered. To detect flow, phase contrast angiography uses a bipolar gradient to encode a spin’s