

Kluwer - Handbook of Biomedical Image Analysis Vol
.1.pdf134 |
Rakesh Sharma and Avdhesh Sharma |
all the possible velocities in the vessels. This concept is also used in Doppler sonography. The sequence uses the gradient reversal. Reversed gradient suppresses the signal from stationary tissue but does not affect phase angle of the flowing tissue. It also corrects magnetic field inhomogeneity and zero phase determination.
3.2Techniques and Principles of Magnetic Resonance Angiography
There are two main methods of acquiring angiographic images. We shall describe them from the point of view of intravascular flow imaging. Later, we shall describe recent refinements and modifications in the angiography methods.
TOF MRA
PC MRA
Each technique can be performed using 2D-FT. Thus, there are mainly four different methods:
1.2D-TOF MRA
2.2D-PC MRA
3.3D-TOF MRA
4.3D-PC MRA.
Each of these techniques is advantageous to a different type of clinical application.
Before discussing these techniques, let us understand the basic physical principles of flow inside the vessel which is the fundamental principle of angiography. This information is important for MR instrument physicists in day to day practice.
3.2.1 TOF MRA
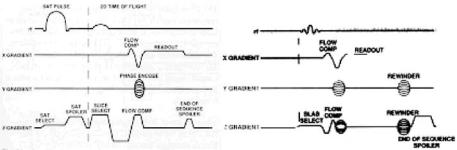
This approach is based on flow-related enhancement in which 2D or 3D GRE techniques are applied (see Fig. 3.6). Usually, FC (flow compensation) is used perpendicular to the lumen of the vessel. So, it relies primarily on flow-related
Advances in Magnetic Resonance Angiography |
135 |
Figure 3.6: Two-dimensional TOF MRA pulse sequence (left) and 3D TOF pulse sequence (right) are shown. Several gradient waveforms are combined to reduce TE.
enhancement to distinguish two types of spins i.e., moving spins and stationary spins. The advantage of this flow-related enhancement is mainly fast scanning time. It uses minimized FRE because each slice represents an entry slice.
3.2.1.1 2D TOF MRA
A typical pulse sequence is represented for TOF MRA. A presaturation pulse is applied above or below each slice to eliminate signal from overlapping venous or arterial structures. Usually a short TR (about 50 msec), a moderate flip angle (45−50◦), and a short TE (a few msec) are used. This method has the following advantages. It generates high SNR as signal is generated from a large volume. It improves spatial resolution. During time of flight, blood flowing into the imaging slice is fully magnetized and appears brighter than the partially saturated stationary tissues. Optimized scan parameters to acquire angiographic images are described.
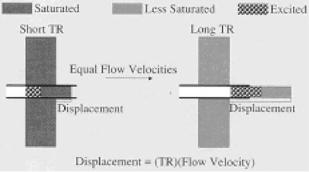
3.2.1.1.1 Image Contrast. To get better image contrast, repetition times (TR) must be kept short with respect to the stationary tissues’ T1 times. It helps to suppress the signal from stationary tissue and to maximize the vessel contrast due to flow-related enhancement (see Fig. 3.7). TR of 45–50 msec are adequate for suppressing the signal from stationary spins within the slice. During this time, the fully relaxed blood moving into the slice remains unsaturated. As a result, blood appears bright (high signal intensity) compared to the low-signal- intensity stationary tissues. Other flow and imaging parameters influencing the
136 |
Rakesh Sharma and Avdhesh Sharma |
Figure 3.7: Effect of TR is shown. At short TR, stationary tissue is partially saturated causing saturated blood flowing out of slice and replaced with unsaturated blood appearing as high signal in the blood relative to surrounding tissue (on left). At long TR, stationary tissue may recover between excitations and excited blood flows out of the slice before it is refocused to form echo or high signal of stationary tissue with no signal from flow.
image contrast in 2D TOF images include flow velocity and direction, vessel geometry, T1 of blood and stationary tissues, flip angle, TE, and slice thickness.
3.2.1.1.2Flow Velocity. Initially, flow-related enhancement increases with the flow velocity. At moderate flow velocity rates, there is flow-related enhancement for a complete new set of the spins. Later, no further increase is possible in image contrast or signal intensity.
3.2.1.1.3Vessel Geometry. The orientation of the blood vessel to the slice plane also affects vascular signal intensity. Maximum inflow enhancement occurs when blood flow is perpendicular to the imaging plane. When a vessel travels obliquely through the slice or the vessel lies within the slice plane, the flowing spins are subjected to multiple RF pulses. As a result, spins begin to become saturated. As a result, intravascular signal intensity decreases and the vessel may be incompletely visualized.
3.2.1.1.4Slice Thickness. The thinnest slices maximize inflow enhancement. These thin slices reduce the effects of in-plane flow. Typically, for our carotid bifurcation imaging, a nominal 1.5 mm slice is obtained using a narrow bandwidth RF pulse at 625 Hz and gradient amplitudes of 1 G/cm or 10 mT/m.
Advances in Magnetic Resonance Angiography |
137 |
The larger slice-select gradient amplitudes require larger flow compensation gradients. These gradients in turn limit the minimum TE to 8–9 msec.
3.2.1.1.5Longitudinal Relaxation Times (T1). T1 values of blood may have a significant effect on intravascular signal intensity, particularly in slowflow conditions. Suppose the velocity is not sufficient to completely refresh spins within the imaged slice; in this case the blood will begin to become saturated. In the 2D TOF procedure described for the carotid bifurcation, saturation would occur at flow velocities of approximately 3 cm/sec. It can be represented as 1.5 mm divided by 50 msec. The ability of TOF angiography to detect slow flow may be improved by shortening the T1 of blood through the use of MR contrast agents.
3.2.1.1.6Flip Angle. Flip angle affects the slice-saturation rate. It is selected to saturate the stationary tissues without compromising intravascular signal intensity. Normally, flip angle of 45–60◦ is selected for 2D TOF angiography.
3.2.1.1.7Asymmetric Echo Acquisitions. These acquisitions are obtained using the fractional echo or partial echo times. Shortest echo times are obtained for optimizing MR angiographic images. These short echo times are obtained by the use of asymmetric echo acquisition. In this approach, the gradient echo may offset in the acquisition window by shortening the duration and size of the dephasing and flow-compensation gradient pulses. This permits shortening of the sequence and reduced echo times. Asymmetric echo acquisition has the advantage of reducing the size of the refocusing gradients on the read-out axis. It results in decreased signal loss and reduces artifacts from accelerations or higher order moments.
3.2.1.2 Presaturation Pulses
Blood may flow into the imaging plane from any direction. The blood may produce flow-related enhancement i.e. 2D TOF images of carotid artery show blood flowing to the imaging plane from above or below. As a result, the carotid arteries appear bright. This brightness is due to overlapping of the carotid arteries and jugular arteries. To eliminate the signal from overlapping vascular structures in the projection images, a presaturation pulse is applied as a 3 cm wide saturation band at the level of 0.5 cm superior to the slice. The saturation pulse
138 |
Rakesh Sharma and Avdhesh Sharma |
moves superiorly with each successive tissue slice. As a result, the image data set emphasizes exclusively arterial structures.
3.2.1.3 2D TOF Angiography of the Carotid Bifurcations
In patients with vascular diseases, the 2D TOF imaging technique is an effective method of imaging the carotid artery bifurcation. We acquired typically 50–70 contiguous axial slices, each approximately 1.5 mm thick. The acquisition is performed by using flow compensation in both slice-select and read-out directions. For this, typically a gradient echo pulse sequence is employed, with TR =
45–50 msec, a flip angle of 45–60◦, NEX = 1, 128 × 256 matrix, and minimum available echo time. The field of view (FOV) may vary from 16 to 20 cm, depending on the patient size. As a result, axial image slices show the blood vessels as bright (see Fig. 3.8). Other surrounding tissues appear with much lower signal intensity. However, the 2D TOF angiography method has limitations.
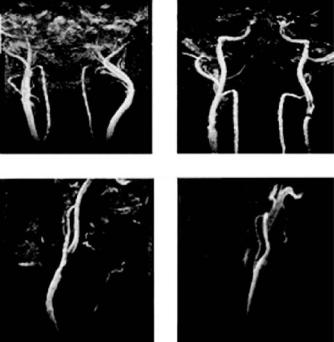
Figure 3.8: In carotid artery, glomus tumor vasculature is shown in preand postsurgery (left and right panels at the top). Carotid stenosis (left on bottom) and carotid aneurysm (right at bottom) are highlighted.
Advances in Magnetic Resonance Angiography |
139 |
The presence of vascular stenosis may produce areas of increased flow velocity within the stenosis segment. So, these regions (having relatively less flow) further slow the flow in the poststenotic vortices. Turbulence is also frequently encountered distal to the stenosis. These factors will produce intravoxel incoherence, spin saturation in the slowly flowing eddies, and loss of signal intensity. Large ulcerations are often difficult to image because of the slow and complex flow within the location of ulceration. Use of the shortest TE and smallest voxel size can substantially minimize signal loss. In spite of these measures, some signal will be lost adjacent to the stenosis region. It is possible to overestimate the degree of stenosis when interpreting the carotid MR angiograms (see Fig. 3.9). In-plane flow can also compromise the quality of 2D TOF angiograms. When a blood vessel runs parallel to the imaging plane, the blood will experience multiple RF pulses. As a result, the blood will eventually become saturated. The portion of the vessel coursing through the imaging plane may exhibit little or no signal intensity. These vessels appear as artificially narrowed or
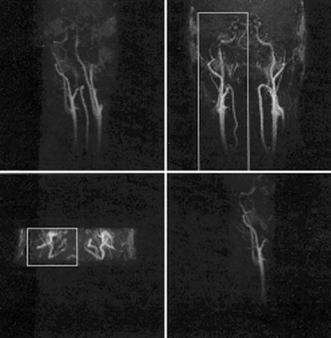
Figure 3.9: Three-dimensional coronal inflow targeted MIP angiography of carotid arteries is shown. Boxes in both rows represent isolated single carotid arteries at 1.5 mm 32 partitions.
140 |
Rakesh Sharma and Avdhesh Sharma |
discontinuous. Artificial loss of signal is usually easy to identify if caused by the in-plane flow. It is due to the fact that the vessel geometry can be appreciated above and below the in-plane segment. On several occasions, vessels may become so intertwined that vascular loops are formed. Presaturation pulse obliterates the signal intensity from inferior vessel taking course. Similarly, reversed flow in the internal or external carotid arteries will be undetectable. The invisibility is because of the superior presaturation pulse. For better results, the maximum intensity pixel (MIP) approach was suggested as described in the following section.
3.2.1.4 2D-TOF Imaging of Venous Anatomy
Images of cortical veins have been generated with the use of 2D TOF imaging. When superimposed on axial MR images, a map of the cortical veins can be produced to relate intraparenchymal pathology with cortical venous anatomy. This approach has been successful for preoperative localization of lesions prior to surgery. For this, a presaturation pulse is applied to eliminate arterial signal using slice thickness 2.0– 2.9 mm. The method allows the relatively fast coverage of a large anatomical region without compromising in-flow enhancement. The trade-off in this approach is the decrease in image-resolution.
3.2.1.5 MIP Projection Ray Tracing Technique
The MIP projection ray tracing technique is used for viewing 2D TOF angiograms after data acquisition and reconstruction (see Fig. 3.10). As a result, multiple projection images are generated from volume of stacked axial slices’ image data. When volume data is projected onto a two-dimensional plane, each pixel in the projection image depends on the pixels along each line, or ray, through the volume of data. Several procedures can be used to determine pixel intensity in the projection image. Using MIP, the projection pixel is assigned the maximum pixel intensity found along a ray traversing the imaging volume. Additional parallel rays are passed through the volume until a complete projection image of the vessels is obtained. Once all pixel intensities for a projection have been calculated, the process may be repeated for any other projection angles (see Fig. 3.11). Typically, 18 projection angiograms are obtained at 10◦ increments. The collections of projected images may be viewed as a cine loop to give the

Advances in Magnetic Resonance Angiography |
141 |
Figure 3.10: Maximum intensity projection: 3D structure is represented on a 2D plane based on the maximum signal intensity. Projecting successive views from different angles results in an apparent rotation when later displayed in a cine loop.
appearance of rotation and depth. These images result in a three-dimensional representation of the vascular structures. Angiographic imaging parameters are selected to maximize the signal intensity of vascular structures. For this, the MIP procedure produces projection images in which vessels appear bright and the background signal intensity is reduced. The MIP technique has limitations despite improved contrast. It results in a slight decrease in vessel size. So, this technique contributes to an overestimation of stenotic regions. The MIP process also slightly reduces the diameter of normal vessels. The MIP projection images lack increased signal at points of vessel overlap. A ray tracing through a region of vessel-overlap selects the brightest pixel along the ray. It presents the overlapped vessels as a single vessel.
3.2.2 3D TOF MRA
A pulse sequence is represented for 3D TOF MRA (see Fig. 3.6). A slab of several cm (usually about 5 cm) is obtained which contains up to 28–60 slice 3D volumes in axial plane through region of interest. The slice thickness is 0.7–1.0 mm, repetition time is 40 msec, and flip angle is 15–20◦ with FOV of 16–20 cm, depending on the patient size and region of interest. Depending upon the desired resolution
142 |
Rakesh Sharma and Avdhesh Sharma |
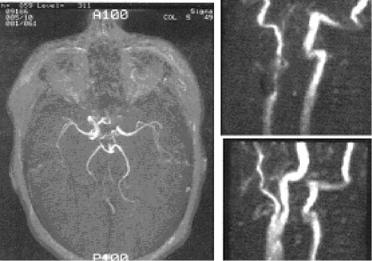
Figure 3.11: Three-dimensional TOF angiogram showing circle of Willis confirming the occlusion of the left internal carotid artery (left panel). Twodimensional TOF angiograms demonstrating an internal carotid artery occlusion. A sagittal projection of right carotid bifurcation reveals a patent vessel post endarterectomy (top row on right). The sagittal projection of the left carotid bifurcation reveals stenosis of the proximal external carotid artery and occlusion of the internal carotid artery (bottom row on right).
and imaging time, 128 × 128, 192 × 256, or 256 × 256 matrix can be used with NEX = 1. Very short echo times may be attained with flow compensation. These optimized scan parameters permit adequate penetration of inflowing, fresh, fully magnetized spins into the imaging volume. The resultant 3D data set initially is displayed as a series of slices, acquired in the axial plane. Later, it is subjected to the MIP ray tracing technique to create coronal and sagittal projections. A series of projections may also be generated to “rotate” the vascular structures around a single axis. Cine loop display can provide the perception of depth. Advantages of 3D techniques are appreciable as these techniques are more susceptible to saturation effects and less sensitive to slow flow. Thus, 3D volume acquisition techniques offer superior signal-to-noise ratios (SNR). 3D TOF MRA offers a prescription of very thin slices, thereby reducing the voxel size and decreasing the intravoxel dephasing. 3D TOF MRA maximizes the flow-related enhancement.
Advances in Magnetic Resonance Angiography |
143 |
3.2.2.1 Optimization of Image Parameters of 3D TOF MRA
Optimization parameters are blood velocity, vessel orientation in relation to the slab, the size of the imaging volume, TR, slice thickness, voxel size, and flip angle. Flow velocity should ideally permit fresh, fully magnetized spins to traverse the entire imaging volume between successive RF pulses. This results in optimal signal enhancement because of in-flow effects. For instance, at normal flow velocity saturation effects will be minimal. At lower velocity, slow flowing blood becomes saturated as it moves through the imaging volume, and signal intensity decreases. Slow flow conditions may be encountered in the cases of vascular occlusive disease, venous thrombosis, and aneurysms with complex flow patterns.
3.2.2.1.1Imaging Flow Orientation. It should be selected to minimize the saturation of moving spins as they course through the volume. For instance, axial orientation permits imaging of ‘circle of Willis’ using a small volume, thereby reducing the imaging time (see Fig. 3.11). In practice, coronal and sagittal orientations have been used to image both extracranial and intracranial carotid arteries in a single acquisition. Larger flip angles of 35–60◦ maximize signal in the extracranial carotids, but result in saturation of the intracranial vessels. Smaller flip angles of 15–30◦ improve visualization of the intracranial vessel because of the reduced saturation. As a result, trade-off is the decreased intensity of intravascular signal from the extracranial carotid arteries.
3.2.2.1.2Repetition Time (TR). At short TR, stationary tissues exhibit greater saturation. It increases the tissue contrast between vessel and the surrounding tissues (see Fig. 3.12). However, at short TR, spins flowing through the imaging volume become saturated, resulting in loss of intravascular signal intensity. These saturation effects can be somewhat reduced by using a smaller flip angle or by shortening the T1 of blood through the use of MR contrast agents. Nonetheless, when the 3D acquisition is optimized for normal intracranial arterial flow (flip = 15–20◦, TR = 40), slower flow will become saturated, reducing the delineation of venous anatomy and slow flow within aneurysm or diseased arteries. Despite this, 3D TOF MRA does not distinguish flowing spins from subacute hemorrhage. For instance, methemoglobin within a subacute hematoma has a short T1 and does not become saturated during the 3D acquisition. The