

136 – 3. SELECTED ASPECTS OF STRATEGIC MANAGEMENT
Managing and improving taxpayers’ compliance
As evident from the extracts of selected revenue bodies’ plans, improving taxpayers’ compliance is very much the underpinning rationale for a revenue body’s existence. Since its creation in 2002, the FTA has provided a substantial amount of practical guidance on the features of a strategic approach for improving taxpayers’ compliance, drawing on leading revenue body approaches.
The guidance note published in 2004, hereafter referred to as “the 2004 guidance note” provided a framework for the application of modern compliance risk management principles to the management of tax compliance risks. It also described a step-by-step strategic process for the identification and treatment of compliance risks, supported by a number of practical examples drawn from revenue bodies to illustrate particular approaches and their impacts.
Domains of taxpayer obligation
The 2004 guidance note considered that while specific obligations of taxpayers will vary from one taxation role to another and from one jurisdiction to the next, four universal categories of obligation are likely to exist for almost all taxpayers. These are: 1) registration in the tax system; 2) the timely filing of tax returns; 3) reporting of complete and accurate information in tax returns; and 4) payment of tax obligations on time. It suggested that, irrespective of jurisdiction, “compliance” will relate to the extent to which taxpayers meet these obligations. Taxpayers who fail to meet any of them may be considered to be “noncompliant”, although the reason for their non-compliance may fall along a continuum extending from unintentional error to intentional/deliberate actions
Adopting a risk management approach
The 2004 guidance note acknowledged that revenue bodies operate with finite resources, and that effective tax administration needed to focus on optimising collections under the tax laws in ways that instill confidence in a revenue body and ensured the tax system
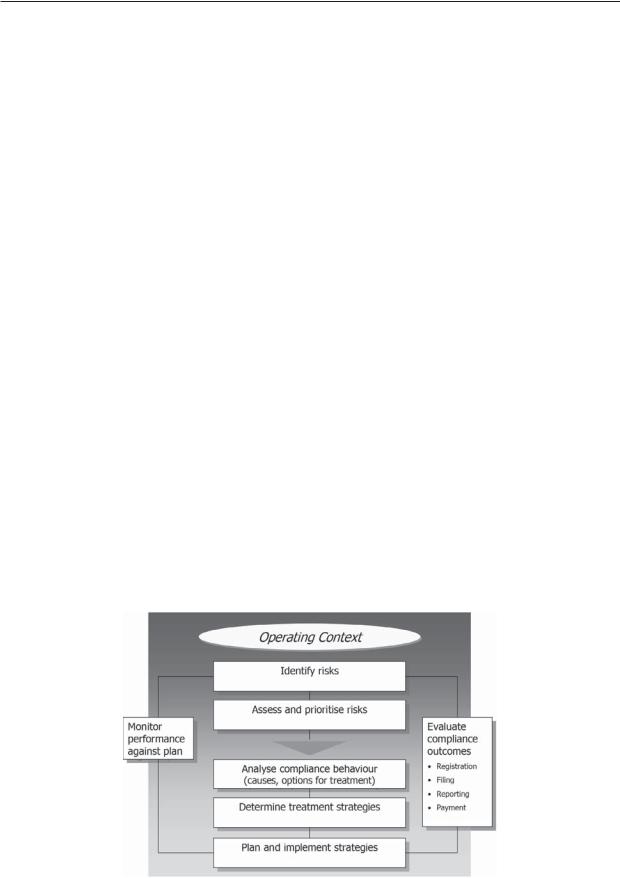
Figure 3.1. The compliance risk management process
TAX ADMINISTRATION 2013: COMPARATIVE INFORMATION ON OECD AND OTHER ADVANCED AND EMERGING ECONOMIES – © OECD 2013
3. SELECTED ASPECTS OF STRATEGIC MANAGEMENT – 137
is operating, and is being seen to operate, correctly. It promoted the notion that revenue bodies require a structured and systematic process for deciding what is important in a tax compliance context, how major compliance risks will be addressed and how to determine the most effective allocation of their resources-the compliance risk management process. In this regard, it defined compliance risk management as a series of steps entailing the systematic identification, assessment, ranking, and treatment of tax compliance risks, as well as related monitoring and evaluation activities, to support improved decision-making. A model of the compliance risk management proposed for use by revenue bodies is depicted in Figure 3.1.
Through greater understanding of the environmental context, it was suggested that use of this model would enable revenue bodies to assess and determine which risks/taxpayer behaviors it can or cannot influence, and to consider and prioritise which risk treatments were required.
Recognising the influences on taxpayers’ compliance behaviour
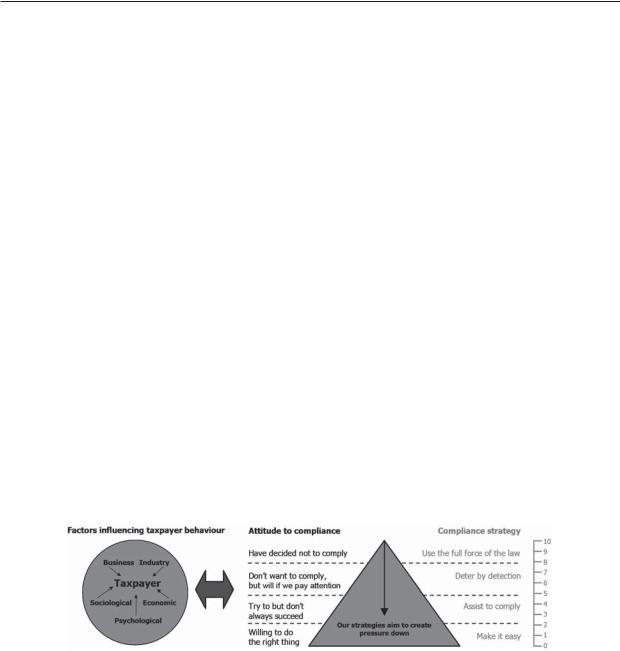
Research supporting the 2004 guidance note described two broad approaches to the problem of non-compliance behaviour, the first based on economic rationality and the second based on wider behavioral issues. It considered that these approaches were not necessarily competing and that each approach can be valuable in terms of understanding tax compliance. In combination with the research of Australian academic Dr Valerie Braithwaite around the sets of values, beliefs and attitudes of individual taxpayers (persons or businesses), the 2004 guidance note offered the BISEP model3 for thinking about the combination of these factors and the attitudes of individuals in the way they may relate to a revenue body and the tax system it administers. This model (see Figure 3.2) allows users to categorise the factors in a consistent manner and form to aid understanding and is also sufficiently robust to stand up to applied and practical application in a tax administration environment.
Figure 3.2. The BISEP model and spectrum of taxpayer attitudes to compliance
It was highlighted that an individual taxpayer is capable of adopting any of the attitudes described at different times and may also adopt all of the attitudes simultaneously in relation to different issues. It noted that these attitudes are not fixed characteristics of a person or group, but reflect the interaction between the person or group and those that impose demands upon them. The 2004 guidance note considered that the value of this model is in the contribution it makes in developing a deeper understanding of taxpayer behaviour and being able to lay the groundwork for the development of targeted strategies which encourage the motivation to do the right thing and constrain the motivation to resist or evade compliance. Today, many revenue bodies (e.g. Denmark, the Netherlands, New Zealand and the United Kingdom) have adopted this model, or a variant of it, to guide their planning for delivering improved compliance outcomes.
TAX ADMINISTRATION 2013: COMPARATIVE INFORMATION ON OECD AND OTHER ADVANCED AND EMERGING ECONOMIES – © OECD 2013

138 – 3. SELECTED ASPECTS OF STRATEGIC MANAGEMENT
Monitoring and evaluation of compliance risk management strategies
A key element of the recommended compliance risk management process was a compliance measurement framework that would provide revenue bodies with a range of compliance indicators that could be used to monitor and evaluate the impacts of their compliance activities, both at the aggregate level and in respect of specific risk treatments strategies. Such a framework would enable a continual cycle of review and refinement. This issue was addressed in some detail in the FTA’s 2008 guidance note which explored and promoted the idea of a compliance monitoring framework at the aggregate/macro level. Among other things, the note acknowledged that a number of revenue bodies took steps to produce periodic estimates of the tax gap for their major taxes to improve their understanding of the likely scale and composition of non-compliance, and to provide some insights into the trend of aggregate non-compliance.
Managing taxpayers’ compliance in 2012
This context provides a useful backdrop to assessing in high level terms the compliance management approaches of revenue bodies in 2012, as gleaned from revenue bodies’ survey responses. In this respect, revenue bodies were asked the following questions:
1.Is there a formal process for identifying, assessing, and prioritising the key compliance risks?
2.Are the revenue body’s key compliance risks and mitigation strategies made public?
3.Is there periodic reporting on the progress in addressing the key compliance risks?
4.Is there a mandated requirement (either from Government or the MOF) to produce periodic estimates of the tax gap for some/all of the major taxes?
5.Is research undertaken to produce periodic estimates of the aggregate tax gap for the major taxes?
6.Are the results of tax gap estimation studies made public?
7.Are random audit programs used to test compliance and/or for risk profiling purposes in targeted sectors or for the major taxes.
Survey responses were supplemented by research of publicly-available documents of as many revenue bodies as practicable. This research aimed to gain greater insights as to the approaches being adopted, shed light on some emerging interesting and novel developments concerning tax compliance risk management, and to identify examples/ references to assist revenue bodies’ research in this field. A summary of responses is set out in Table 3.4. From this and related research, the key observations and findings are as follows:
Compliance risk identification, assessment, prioritisation, and treatment
The vast majority (49 of 52 revenue bodies) reported that they have a formal process for identifying, assessing and prioritising their key compliance risks areas (e.g. profit shifting, VAT fraud, return non-filing, non-payment of liabilities) as part of their organisational planning; however, the number reporting that they made public the key risks identified and how they will be treated was considerably less (27 of 52 revenue bodies);
TAX ADMINISTRATION 2013: COMPARATIVE INFORMATION ON OECD AND OTHER ADVANCED AND EMERGING ECONOMIES – © OECD 2013
3. SELECTED ASPECTS OF STRATEGIC MANAGEMENT – 139
Table 3.4. Strategic approach for managing taxpayers’ compliance
|
|
Aspects of revenue body’s approach for managing taxpayers’ compliance |
|
||||
|
Formal risk |
Key risks and |
Reports of |
Periodic estimates |
Periodic |
Estimates of |
Random |
Country |
management |
strategies are |
outcomes are |
required of tax |
estimates made |
tax gap are |
audits used for |
process is in place |
published |
made public |
gap |
of tax gap |
made public |
research |
|
OECD countries |
|
|
|
|
|
|
|
Australia |
9 |
9 |
9 |
9/1 |
x |
n.a. |
x |
Austria |
9 |
x |
9 |
x |
x |
x |
9 |
Belgium |
9 |
x |
9/1 |
9 |
9 |
9 |
9 |
Canada |
9 |
9 |
9 |
x |
x |
x |
9 |
Chile |
9 |
9 |
9 |
9/1 |
9 |
9 |
x |
Czech Rep. |
9 |
x |
9 |
9 |
x |
x |
x |
Denmark |
9 |
9 |
9 |
9 |
9 |
9 |
9 |
Estonia |
9 |
9 |
9 |
9 |
9 |
9/1 |
9/2 |
Finland |
9 |
x |
x |
x |
x |
x |
x |
France |
x |
x |
x |
x |
9 |
x |
x/1 |
Germany |
9 |
x |
x/1 |
x |
x |
x |
9 |
Greece/1 |
9 |
9 |
9 |
9 |
9 |
9 |
9 |
Hungary/1 |
9 |
9 |
9 |
x |
x |
x |
9/1 |
Iceland |
9 |
x |
9 |
x |
x |
x |
9/1 |
Ireland |
9 |
x |
9 |
x |
x |
n.a. |
9/1 |
Israel |
9 |
9 |
x |
9 |
x |
9 |
x |
Italy |
9 |
x/1 |
9 |
x |
x |
x |
x |
Japan |
9 |
9 |
9 |
x |
x |
x |
x |
Korea |
9 |
x |
x |
x |
x |
x |
x |
Luxembourg |
9/1 |
9/2 |
x |
9/1 |
9/1 |
x |
x |
Mexico |
9 |
9 |
9 |
9/1 |
9/1 |
9 |
9 |
Netherlands |
9 |
9 |
9 |
x |
x |
x |
9 |
New Zealand |
9 |
9 |
9 |
x |
x |
n.a. |
x |
Norway |
9 |
x |
9 |
x |
x |
n.a. |
9 |
Poland |
x/1 |
9 |
9 |
n.a. |
n.a. |
n.a. |
x/1 |
Portugal |
9 |
x |
9 |
x |
x/1 |
x/1 |
9 |
Slovak Rep. |
9 |
9 |
9 |
x |
x |
x |
x |
Slovenia |
9 |
9 |
9 |
x/1 |
9 |
9 |
9 |
Spain |
9 |
9 |
9 |
x |
x/1 |
x |
x/2 |
Sweden |
9 |
9 |
9 |
x |
x |
x |
9 |
Switzerland |
x |
x |
x |
x |
x |
x |
9 |
Turkey |
9 |
x |
9 |
9 |
9 |
9 |
x |
United Kingdom |
9 |
9 |
9 |
9 |
9 |
9 |
9 |
United States |
9 |
9 |
9 |
x |
9/1 |
9 |
9/2 |
Non-OECD countries |
|
|
|
|
|
|
|
Argentina |
9 |
9 |
9 |
x |
9 |
x |
9 |
Brazil |
9 |
9 |
9 |
x |
x |
x |
9 |
Bulgaria |
9 |
x |
9 |
x |
9 |
x/1 |
9 |
China |
9 |
x |
x |
x |
9 |
x |
x |
Colombia |
9 |
x |
9 |
x |
9 |
9 |
x |
Cyprus |
9 |
x |
x |
x |
x |
x |
9 |
Hong Kong, China |
9 |
x |
x |
x |
x |
x |
9 |
India |
9 |
9/1 |
9 |
9 |
9 |
9/1 |
9 |
Indonesia |
9 |
x |
9 |
9 |
9 |
x |
x |
Latvia |
9 |
x |
9 |
x |
x |
x |
x |
Lithuania |
9 |
9 |
9 |
9 |
9/1 |
x |
x/2 |
Malaysia |
9 |
x |
x |
x |
x |
x |
x |
Malta |
9 |
x |
9 |
x |
x |
x |
9/1 |
Romania |
9 |
x |
x |
x |
x |
x |
9 |
Russia |
9 |
9 |
9 |
x |
x |
x |
9 |
Saudi Arabia |
9 |
x |
9 |
x |
x |
x |
9 |
Singapore |
9 |
9 |
9 |
x |
x |
x |
9/1 |
South Africa |
9 |
9 |
9 |
x |
x |
x |
9 |
For notes indicated by “/ (number)”, see Notes to Tables section at the end of the chapter, p. 145. Sources: CIS survey responses.
TAX ADMINISTRATION 2013: COMPARATIVE INFORMATION ON OECD AND OTHER ADVANCED AND EMERGING ECONOMIES – © OECD 2013

140 – 3. SELECTED ASPECTS OF STRATEGIC MANAGEMENT
Research identified three revenue bodies (i.e. Australia, New Zealand, and South Africa) that publish a formal Compliance Programme setting out a summary of the major tax compliance risks identified and how they will be dealt with. (Boxes 3.11 and 3.12 refer.)
Around 75% of surveyed revenue bodies reported that they periodically make public (e.g. in their annual reports) details of the progress being made in dealing with their key compliance risks.
Box 3.11. Australia: Publication of key compliance risks and strategies
The ATO commenced its practice of developing and publishing an annual comprehensive compliance programme statement in 2002. Each programme statement commences with a description of the ATO’s broad strategic directions and approach to managing taxpayers’ compliance and, against this background, it then details the compliance risks of most concern and the actions to be taken to address them. The description of risks is structured around key market segments (e.g. large businesses and micro-enterprises), each of which are briefly profiled in the statement. For each market segment, there is an account of the key compliance risks identified and the main strategies/treatments will be used. The statement concludes with a summary of compliance programme activities for the immediate financial year. The ATO released its Compliance Program for 2012-13 in July 2013. When releasing the programme, the ATO Commissioner commented:
One of our values is being open and accountable to the Australian community. Publishing our compliance program each year is an important part of this. We feel strongly that the community should have the opportunity to understand (and tell us what they think about) our compliance activities and practices. To that end, one of the things we have done is to engage more purposefully with tax practitioners in preparing this year’s compliance program.
Underpinning the compliance program every year is our assessment of the most significant risks to compliance with the tax and superannuation systems. These assessments, informed by our understanding of these systems in operation and by consultation with the community, form the basis of the choices we make in the allocation of resources to our compliance activities, and the types of activities we undertake.
This year we worked with two of our peak tax practitioner consultative groups to test the risks that we identified, and invited tax practitioners to contribute their views on other risk areas we should consider. These discussions are encouraging in that they broadly confirmed our areas of focus as those rightly requiring attention. We will therefore continue having them as we develop compliance programs in the years to come.
We also asked some individual tax practitioners to help us make the compliance program publication more reader-friendly and relevant to their needs. I hope that the improvements we have made in response to this feedback will be apparent as you read through and that it hits the mark.
Another innovative approach this year is the inclusion (together with the usual performance statistics) of an update of the work we did in 2011-12 to develop new ways of demonstrating the effectiveness of our activities through the use of participation indicators. A better understanding of whether we have influenced compliance behaviour in a positive and sustainable way is important to us and to community confidence.
For more information, see www.ato.gov.au.
Source: ATO Compliance Program 2012-13.
TAX ADMINISTRATION 2013: COMPARATIVE INFORMATION ON OECD AND OTHER ADVANCED AND EMERGING ECONOMIES – © OECD 2013

3. SELECTED ASPECTS OF STRATEGIC MANAGEMENT – 141
Box 3.12. South Africa publishes its first Compliance Programme
Commencing in 2012, SARS published its first compliance programme. In explaining the rationale for publication of its Compliance Programme SARS’s Commissioner observes:
It may appear somewhat counter intuitive for us to publicly announce those areas of risk that will come under the SARS microscope. But in doing so, we would like to help people recognise behaviours that pose a risk to them and take measures to avoid them, thereby encouraging voluntary compliance. We are not out to catch people. Rather we are in the business of getting everyone to do the right thing willingly. This is a bit like road signs which alert drivers to upcoming speed traps. In the same way that these have been shown to reduce speeding, international best practice has shown that by highlighting areas of high risk and non-compliance with tax and customs legislation, taxpayers and traders are encouraged to adjust their behaviour.
For the period covered by the programme, SARs will give emphasis to seven broad areas:
Large business and transfer pricingConstruction industry
Illicit cigarettesSmall businesses
For more information, see www.sars.gov.za.
Undervaluation of imports in the clothing and textile industry
Tax practitioners and trade intermediaries
Wealthy South Africans and their associated trusts
Source: SARS Compliance Programme: 2012/13-2016/17.
Tax gap estimation
Tax gap estimation activities are a relatively contentious issue among tax administrators with opponents questioning their accuracy, reliability and overall value to management of the tax system, while proponents argue that, properly conducted, they provide useful information for a variety of internal and external stakeholders (notwithstanding their limitations). Over recent years, there appears to have been increased interest in their use as Governments, tax administrators and others have sought to gauge the extent of revenue leakage from countries’ tax systems and/or to better understand the impacts of revenue bodies’ compliance improvement activities.
Drawing on survey responses, the following observations can be made:
Around 30% of revenue bodies (15 of 52) reported they are required to provide periodic estimates of the tax gap for some/all of the major taxes administered.
Around 40% of surveyed revenue bodies (19 of 52), including those with a formal mandate to do so, reported that they undertake research efforts to produce estimates of the aggregate tax gap for some/all of the major taxes administered – a brief description of the approach of selected revenue bodies is set out in Box 3.13.
Relatively few revenue bodies (13 of 52 surveyed) reported that estimates made of the tax gap in their country (for some or all taxes) are made public.
TAX ADMINISTRATION 2013: COMPARATIVE INFORMATION ON OECD AND OTHER ADVANCED AND EMERGING ECONOMIES – © OECD 2013

142 – 3. SELECTED ASPECTS OF STRATEGIC MANAGEMENT
Box 3.13. Tax gap estimation activities of selected revenue bodies, etc.
Australia: Until relatively recently, the ATO did not undertake tax gap estimation exercises given concerns for their accuracy and reliability, and doubts as to their value in understanding and monitoring tax compliance levels. However, over the last two to three years work was undertaken to explore their value in relation to Australia’s VAT (i.e. the Goods and Services Tax (GST)) and a few other minor taxes administered by the ATO, as part of broader efforts to better understand the impacts of its compliance activities. The work proceeded satisfactorily and in October 2012 the ATO published its first series of tax gap estimates. Among other things, the ATO’s annual report notes that “The GST gap analysis is most useful when viewed on a trend basis rather than as an absolute measure.”
Chile: The Internal Revenue Service of Chile has carried out measurements of the tax gap dating back to 1980. The gap rates have been mainly estimated for VAT, the major source of tax revenue. The methodology for the estimation of the tax gap uses data from National Accounts, published by Chile’s Central Bank. The last available figures for VAT gap, based on the National Accounts referenced to 2008, can be found in www.gob.cl/ informa/2012/05/10/ministro-de-hacienda-y-director-del-sii-anuncian-virtual-cumplimiento-de-meta-oficial-de- reduccion-d.htm (in Spanish).
Denmark: The Danish Tax and Customs Administration carried out a comprehensive compliance measurement exercise for its major taxes (i.e. personal income tax, corporation tax, and the VAT) in 2007/2008. The programme was based on the results of a programme of random audits entailing some 11-13 000 audits conducted in the latter half of 2007. The programme was used to gather a broad array of data on taxpayer compliance, including the nature and magnitude of taxpayer errors and regional/local compliance patterns, to be used to refocus and redesign its compliance strategies. Reports of its findings were published in 2009 (see www.itdweb.org).
Sweden: The Swedish Tax Agency (STA) has measured the tax gap and its composition-described as a “tax gap map”-using a variety of data sources/methodologies. Swedish officials have indicated that the main reason for preparing the “tax gap map” was to construct a simple and pedagogic overview of what is known of the tax gap to facilitate internal and external communication and to identify areas where deeper knowledge is required. The STA has published the results of its tax gap assessments in its annual report. Reports of its findings are published – see www.skatteverket.se (English portion).
United Kingdom: HMRC (and its predecessor agencies) have over the last decade published regular assessments of the tax gap, primarily in the area of indirect taxes (VAT and Excise). Over the last five years or so the programme of research has been extended to direct taxes, with the results published in its annual performance report and/or in a separate publication. In 2009, HMRC published a comprehensive assessment of the tax gap for all taxes administered, based on what are described as “top-down” and “bottom-up” measurement approaches, which was published in conjunction with the UK Chancellor’s Pre-budget report. HMRC has signalled its intention to continue publishing annual updates of its tax gap estimates in its annual report, in line with its strategic goal “to close the tax gap”., and further releases of updated tax gap information were published in both 2011 and 2012. For more information on this development, see www.hmrc.gov.uk/about/reports.htm
United States: Historically, IRS estimates of reporting compliance were based on its Taxpayer Compliance Measurement Program (TCMP). This programme entailed line by line audits of random samples of returns, enabling the production of information on compliance trends and allowing it to update audit selection formulae. However, the programme came to be regarded as extremely burdensome on taxpayers and the last TCMP audits were done in 1988.
The National Research Program (NRP), which the IRS has used to develop comprehensive tax gap updates for 2001 and subsequent years, arose out of a desire to find a less intrusive means of measuring tax compliance. The IRS’s latest series of tax gap estimates was published in January 2012 in respect of the 2006 fiscal year and a rolling programme of further studies is underway to update the 2006 estimates. The results of the NRP are published on the IRS’s website: www.irs.gov/uac/The-Tax-Gap
European Union: Concerned for the incidence of VAT revenue leakage, the European Commission (EC) in 2007 engaged external consultants to undertake a comprehensive study of the VAT tax gap for all 25 EU member states covering a period of six years (up to 2006) for each country. The methodology employed entailed a “top-down” approach, drawing on National Accounts expenditure data. The results of the study were published in 2009 and have been used in a variety of ways. Further work to update these findings is currently underway.
Sources: Revenue body reports and EC.
TAX ADMINISTRATION 2013: COMPARATIVE INFORMATION ON OECD AND OTHER ADVANCED AND EMERGING ECONOMIES – © OECD 2013

3. SELECTED ASPECTS OF STRATEGIC MANAGEMENT – 143
The use of random audit programs
Random audit programmes have been used by revenue bodies for many years for a variety of purposes: 1) to develop/refine audit risk profiling systems; 2) to develop tax gap estimates; 3) to monitor compliance in specific areas of the tax system; 4) as a general deterrent to non-compliance; and 5) as a source of data to support legislative changes, where appropriate. While such programmes also have their opponents given the additional compliance costs they impose on compliant taxpayers and the revenue foregone from deploying audit staff away from more revenue productive work, proponents generally argue that the overall benefits of such programmes outweigh the the costs involved. Drawing on the survey responses and related research, the following observations can be made:
Over half of surveyed revenue bodies (29 of 52) reported the use of, or intention to use, random audit programmes for some of the taxes administered;
While the scale and nature of revenue bodies’ random audit programmes was not surveyed, the information hereunder obtained from survey responses and/or published materials of the revenue body outlines the approaches of selected revenue bodies:
-Canada: The CRA conducts a number of random audit programmes each year, the results of which are reported in aggregate in its annual performance report. According to its 2011 performance report, a review of a random sample of individual tax returns is conducted each year to learn about the non-compliant behaviour of the entire population of individual taxpayers with respect to key credits and deductions, and to measure the effectiveness of the CRA’s targeted reviews. Similarly, the CRA’s core audit programme (CAP) selects a random sample of SMEs to estimate a reliable rate of reporting compliance. In 2010-11, a non-compliance rate estimate was established for SME filers based on audits conducted in the 2009-10 programme year.
-France: The DGFIP implemented a random audit programme of some 400 VAT taxpayers in late 2010. The primary purpose of the programme was to provide estimates of the overall incidence of non-compliance that could be contrasted with other estimates made using National Accounts data as part of a “top down” estimating methodology. There are currently no plans to repeat the programme.
-Hong Kong, China: In conjunction with regular audit programmes, the IRD conducts its tax compliance audit by adopting a stratified random sampling methodology with two segmentation models built in, one for corporations and partnerships and another for sole proprietorships covering all assessed returns.
-Ireland: Revenue conducts a random audit programme each year on a sample of cases drawn from a defined population of cases (largely self-employed and investor type taxpayers). The primary purpose of the programme is to ensure that no self-assessed taxpayer is exempt (or believes himself or herself exempt) from the possibility of being audited. Additionally, the programme is designed to measure and track compliance with tax legislation and to provide feedback and insight on new trends and types of compliance issues within the taxation system, thereby informing Revenue’s compliance strategy.
-United Kingdom: HMRC undertakes research to produce an aggregate tax gap for all major taxes annually, together with details of the components and methodologies. This is published under the Code of Practice for Official
TAX ADMINISTRATION 2013: COMPARATIVE INFORMATION ON OECD AND OTHER ADVANCED AND EMERGING ECONOMIES – © OECD 2013

144 – 3. SELECTED ASPECTS OF STRATEGIC MANAGEMENT
Statistics and is available publicly. See www.hmrc.gov.uk/stats/mtg-2011.pdf. The results of the random programmes are used to test the effectiveness of the risk assessment process for SMEs (VAT, income tax (including payroll taxes) and corporation tax) and individuals sent a return (income tax). HMRC has a practice of regularly publishing a time series of the compliance rates derived from each of these random programmes and other sources – Box 3.4 refers.
-United States: Random audit programmes have been used by the US IRS over many years and are a key element of its current National Research Program (NRP) to produce estimates of compliance, to provide information to support legislative proposals (e.g. new information reporting regimes, and to refine its audit selection systems.
Notes
1.“Modernising Government” describes “open government” as embodying the following characteristics: 1) transparency: that its actions, and the individuals responsible for those actions, will be exposed to public scrutiny and challenge; 2) accessibility: that its services and information on its activities will be readily accessible; and 3) responsiveness: that it will be responsive to new ideas, demands and needs.
2.The IRS Measures and Targets for the Goals in this table are under review and may be revised. Changes being considered are not available for publication at this time.
3.The BISEP model is intended to promote thinking about the factors that go together to influence the attitudes and behaviours of small businesses. It is comprised of five elements (B) usiness, (I)ndustry, (S)ociological, (E)conomic and (P)sychological that represent different views of the taxpayer entity. Taken in combination, the five elements offer the means to determine the behavioural drivers as a step towards the successful selection of compliance treatment strategies. The guidance note provides further elaboration.
Notes to Tables
Table 3.1. Revenue bodies’ mandated business performance targets
/1. Cyprus: 20% by the end of 2012. Luxembourg: Direct Tax Department only; South Africa: Tax compliance index for each tax product to be developed and tracked. Sweden: The Tax Agency has no budgeted revenue as a performance target, the Ministry of Finance makes forecasts for the revenue for the budget of the Swedish state.
Table 3.3. Selected management practices: business plans, annual reports, surveys etc.)
/1. Argentina: The Annual Management Plan is developed and executed continuously since 2002. Furthermore, AFIP elaborated and made public in 2011 its Strategic Plan 2011-15 detailing its institutional mandates (mission, vision and values) and the strategic objectives defined in long term; Bulgaria: Only the 5-year business plan of the NRA is published; Canada: The Corporate Business Plan is a confidential document. Only the Summary of the Corporate Business Plan is published and made available to the public; Chile: The
TAX ADMINISTRATION 2013: COMPARATIVE INFORMATION ON OECD AND OTHER ADVANCED AND EMERGING ECONOMIES – © OECD 2013

3. SELECTED ASPECTS OF STRATEGIC MANAGEMENT – 145
SII does not publish the annual report; however, relevant information is made public in the Annual Public Account. Information published includes data re taxpayer population, amounts of tax collected, tax gap estimates, human resources of the tax administration, e-services offered, etc.; Cyprus: Only collections are published by Direct Tax Department. Results of Direct Tax and VAT Departments are published in the General Auditors Report; Estonia: Annual performance report: the performance results of ETCB are incorporated into the annual report of Ministry of Finance and it is published on the website of ETCB; ETCB does not prepare separate annual report since 2008; Germany: Federation Level: Annual report on binding objectives for tax collection with the Federal States (at pilot stage); Federal States Level: Controlling reports. Greece: The Directorate of Quality and Efficiency (D.E.P.) is the competent authority for the evaluation of targets and performance indicators given by all Directorates of the Ministry of Finance. D.E.P. prepares issues and notifies towards the General Secretariat its annual report. This report outlines the performance indicators and their implementation by the Directories of the Ministry. D.E.P. indirectly participates in the definition of strategic and operational goals, therefore it might contribute to the reductions of the administrative burden and operating costs. By the end of 2012, the D.E.P. receives the targets and performance indicators of the year 2013 as given by the Directorates of the Ministry. In addition, it gathers the authorities, targets and necessary actions for each one Directory. In particular, according to the provisions of annex II l. ȃ046/2012 there is a quarterly obligation until 31.12.2012 to publish the recovery rate for all tax cases, meaning the ratio of the amount collected by the creditor in enforcement proceedings – following the issuance of an enforceable title – to the amount adjudicated by the court. Ireland: Surveys are regularly conducted on different sectors of taxpayers. Two surveys of SME taxpayers and two of PAYE taxpayers have been completed. All reports are available on the Revenue website; Israel: Revenue body plans to carry out such surveys in the near future; Latvia: The Taxpayer Service Standard was approved on 13 July 2011. Lithuania: STI annual report is not made public because STI is not a separate holder of assignments since 2011.Luxembourg: For direct taxes only; Netherlands: Business strategy and goals incorporated in Annual Budget (the Ministry of Finance). Romania: Romania has delivery standards, available to the public, as are the results with regard to these standards; Russia: Plan of activities of the Federal Tax Service of Russia for the next calendar year is approved by the Minister of Finance of Russia and published on the official website of the Federal Tax Service of Russia. Saudi Arabia: Done informally through website and weekly newspapers where views and comments are received and responded to through workshops and seminars; Spain: Each year, the Institute for Fiscal Studies (within the MOF) launches a Public Opinion Survey on tax matters (including areas related to the Tax Agency). In addition, the Tax Agency keeps a public poll on the e-services related to the PIT. Switzerland: federal cantons are in charge of contact with citizens and conduct their own surveys. Turkey: Surveys to all kind of taxpayers are applied as whole not separately.
/2. Argentina: AFIP prepares a Final Report of the Annual Management Plan, in which the tasks performed and results achieved throughout the year are detailed. This Report is submitted for the approval of an Advisory Council formed by representatives of different public institutions. Canada: Beginning in 2011. Chile: Surveys required by law introduced in 2010 that establishes an economic incentive to improve service quality based on an annual survey that measures a quality indicator (or net satisfaction rate) for both individual and business taxpayers; there are annual targets to be met to achieve the economic incentive. Russia: Report on the results and main activities (DROND) of the FTS of Russia for the medium term is sent to the Russian Ministry of Finance annually and published as part of Russian Ministry of Finance’s DRONDa on the official website of the Ministry of Finance of Russia.
Table 3.4. Strategic approach for managing taxpayers’ compliance
/1. Belgium: Limited to some specific actions. Bulgaria: Updating carried out of the Gap Analysis covering the 2008-11 period; Chile: Reports on the policy of reduction in tax evasion and the advance in the compliance of those policies are required by the Budget Law. Estonia: ETCB produces the annual Strategic Base Analysis, where tax gaps are calculated and analysed; France: In 2011 a programme of random audits on the targeted population of VAT taxpayers was implemented to participate in VAT tax gap assessment; at this time, there are no plans to conduct further random audit programmes; Greece: Since April 2011, there has been a risk analysis procedure used to refer non complying taxpayers to Audit Centres for further auditing action after non compliance; Hungary: The Hungarian revenue body has created a committee for tax gap. This committee is responsible for working up the methodology for measuring tax gap. India: Partial attention given to both aspects; Ireland: Each year 400 cases are selected for the random audit programme; any self-assessed case can potentially be selected for random audit. Italy: Reported as being done on a selective basis; Lithuania: State Tax Inspectorate (STI) ordered services from a independent research agency to evaluate tax gap, also STI makes survey of random auditors to identify indicators of the extent and distribution of various shadow economy phenomena and calculate estimates of officially unaccounted revenues; Luxembourg: For direct taxes only; Indirect Taxes Department has set up a working group to identify a formal process in order to build an EDP based risk analyses for VAT fraud. Mexico: Revenue body is required by law to produce
TAX ADMINISTRATION 2013: COMPARATIVE INFORMATION ON OECD AND OTHER ADVANCED AND EMERGING ECONOMIES – © OECD 2013