


3. SELECTED ASPECTS OF STRATEGIC MANAGEMENT – 125
United States: The high level indicators used by the IRS to measure its performance are set out in its strategic plan. These and specific targets set in for a number of these are set out hereunder: 2
Goals |
Measures |
Target |
|
|
|
|
|
Improve service |
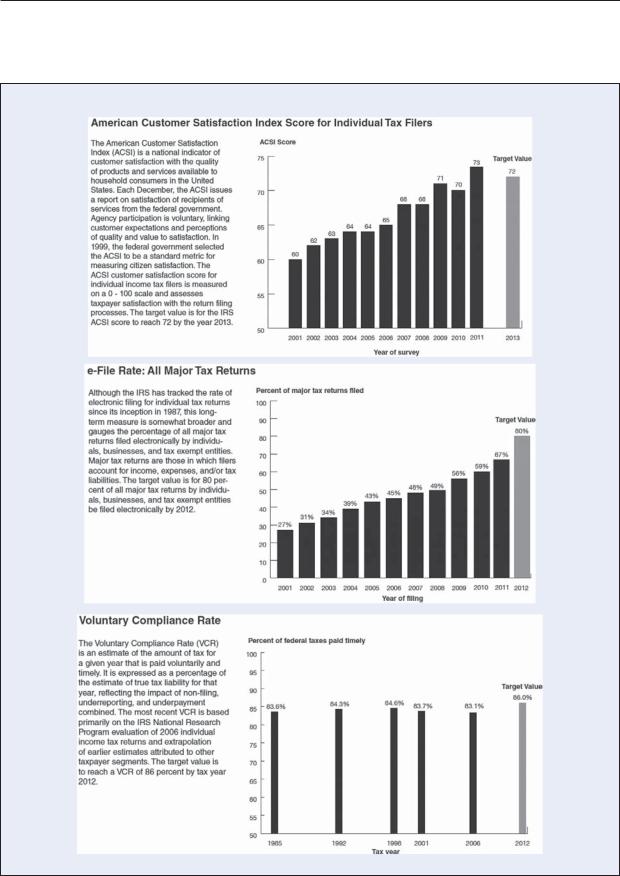
The amount of tax that is paid voluntarily and in a timely manner |
86% (by 2012). |
|
to make voluntary |
as a % of the corresponding estimate of true tax liability. |
|
|
compliance easier |
|
|
|
We will monitor the American Customer Satisfaction Index |
A score of 72 by |
||
|
|||
|
score related to the electronic and paper filing processes for the |
2013. |
|
|
individual income tax. |
|
|
|
The % of all major tax returns filed electronically by individuals, |
80% of all major |
|
|
businesses and tax-exempt entities. “Major” tax returns are |
returns by 2012. |
|
|
those in which filers account for income, expenses and/or tax |
|
|
|
liabilities. |
|
|
|
We will administer surveys across all types of service to assess |
|
|
|
whether the taxpayer’s issue was resolved in a reasonable |
|
|
|
amount of time. |
|
|
Enforce the law to |
We will track all enforcement contacts including audits, notices, |
|
|
ensure everyone |
and “Automated Under-Reporter” to arrive at a more complete |
|
|
meets their |
measure of coverage rate. Enforcement contacts being tracked |
|
|
obligation to pay |
also now include the Automated Substitute for Return (ASFR) |
|
|
taxes. |
Program. |
|
|
|
We will track our enforcement activities that promote compliance |
|
|
|
yet do not primarily focus on increasing tax revenue (e.g. tax- |
|
|
|
exempt compliance programs or Bank Secrecy Act activities). |
|
|
|
We will analyse/estimate the number of individuals who do not |
|
|
|
file income tax returns but have such an obligation. |
|
|
|
Taxpayer Perception of Fairness: We will administer surveys to |
|
|
|
taxpayers who were subject to an enforcement action to assess |
|
|
|
whether they were treated fairly. |
|
|
Strategic |
We will use the annual employee surveys to measure employee |
|
|
foundations: |
satisfaction and engagement. |
|
|
Invest for high |
|
|
|
Effectiveness of Recruitment – Average Time to Fill a Job: |
|
||
performance |
|
||
We will measure the average time it takes to fill a job from an |
|
||
|
|
||
|
applicant’s point of view. |
|
|
|
|
|
|
|
New Hire Retention Rate: We will measure our success at retaining |
|
|
|
the employees that we hire. |
|
|
|
Modernisation-Timely Data: We will measure the timeliness of |
|
|
|
data delivery to IRS service/enforcement staff. |
|
Sources: IRS Strategic Plan (2009-13) and CIS survey response.
Reporting revenue body performance
Research conducted for the preparation of this series entailed examination of many revenue bodies’ annual performance reports, with particular attention given to identifying innovations, emerging practices concerning the reporting of “outcomes” as opposed to “outputs”, and related issues of accountability and transparency. This section provides examples observed of exemplary and/or innovative reporting by revenue bodies taking account of issues raised earlier in this chapter.
TAX ADMINISTRATION 2013: COMPARATIVE INFORMATION ON OECD AND OTHER ADVANCED AND EMERGING ECONOMIES – © OECD 2013

126 – 3. SELECTED ASPECTS OF STRATEGIC MANAGEMENT
Reporting outcomes against strategic goals and objectives
As noted earlier in this chapter, many revenue bodies have taken steps to formulate and publish strategic planning documents that set out, among other things, their high level goals and objectives for the period covered by the plan (normally three to five years), and the measures indicators they intend to use to gauge their progress. However, in practice there is not always a complete and clear alignment of these stated aspirations and the information provided in their annual performance reports. There are however, a number of good examples that have been identified and these are discussed briefly hereunder, with illustrative samples of the reporting set out in Boxes 3.3 to 3.10.
United States Internal Revenue Service: The IRS’s Strategic Plan for 2009 to 2013 identifies a small number of strategic goals for the period covered by the plan and sets out the long term measures to be used to assess its progress. In addition, a more comprehensive set of operational measures and targets are set in respect of each goal that can be used to assess and monitor in-year progress. Since the plan’s formulation, the IRS’s Oversight Board has been tracking progress on its long term measures and related goals and sharing that information with stakeholders via a series of graphs on its website. In addition, the information is also contained in its Annual Report to Congress, along with related commentary on the progress being made. (See example in Box 3.3 from the IRS oversight Board’s 2012 Annual Report.)
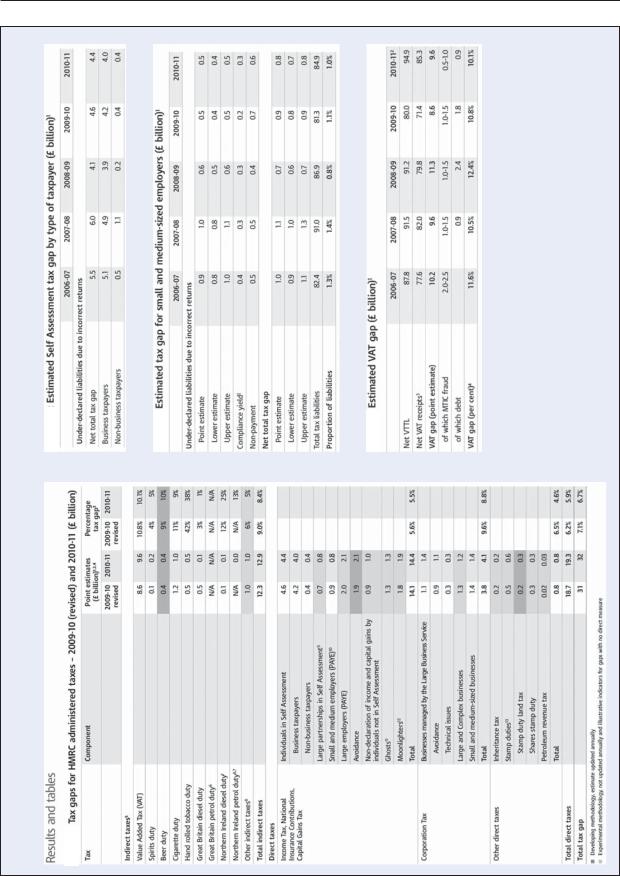
United Kingdom HMRC: Over recent years, the UK HMRC has introduced a practice of providing comprehensive reporting of its compliance-related performance outcomes. This initiative takes two forms: 1) a comprehensive set of tables (by tax type and/or taxpayer segment) presented in its annual performance report setting out a time series of estimated tax gaps for the respective categories of tax/taxpayer; and 2) a separate more detailed report detailing its overall approach to measuring tax compliance along with a composite picture of the estimated aggregate tax gap and for specific taxes and segments of taxpayers (over multiple years). The example reporting in Box 3.4 is from HMRCs Measuring Tax Gaps 2012.
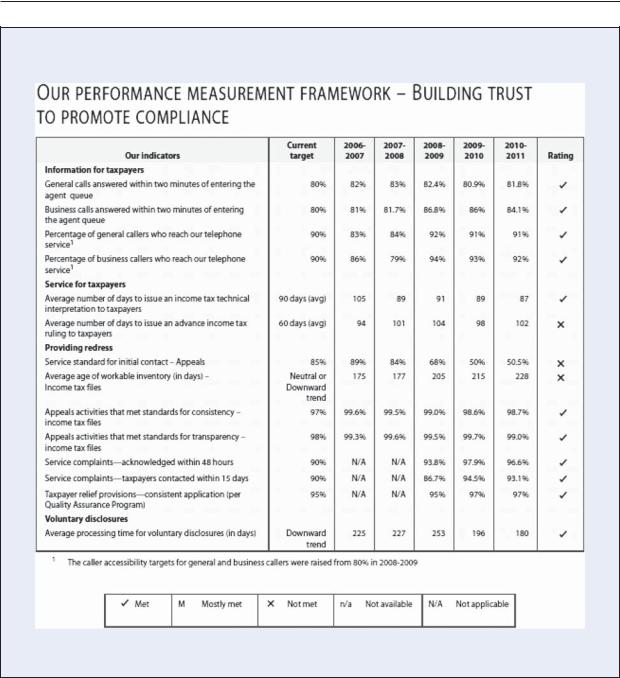
The Canada Revenue Agency (CRA) provides a comprehensive performance report card on its key measures of taxpayers’ compliance and services that sets a high standard for other national revenue bodies to achieve. Key tax-related elements of this reporting are reproduced hereunder. (NB: There is also similar reporting in relation to administration of benefits programs). The examples at Boxes 3.5 and 3.7 are from the CRA’s 2010-11 Annual Report.
Australia: The ATO has comprehensive set of service standards that state its commitment to the community in terms of the time they can expect when dealing with it under normal circumstances. The ATO and the taxpayer may negotiate an extended timeframe. Performance standards are published on the website and performance is reported annually in its annual report. The information displayed at Box 3.6 is from the ATO’s 2011 Annual Report.
Ireland’s Revenue annual report notes that it aims to provide services to compliant taxpayers that are efficient, speedy and cost effective and that it has set out Customer Service Standards by which it will be measured. These standards were set in 2009. In 2011, Revenue maintained a high level of service delivery, for most key service areas, in the face of increasing customer service expectations and a reduction in Revenue resources. The information displayed in Box 3.8 is taken from Ireland Revenue’s 2011 Annual Report.
Spain: The Spanish Tax Agency’s annual report notes that it regards public opinion
TAX ADMINISTRATION 2013: COMPARATIVE INFORMATION ON OECD AND OTHER ADVANCED AND EMERGING ECONOMIES – © OECD 2013

3. SELECTED ASPECTS OF STRATEGIC MANAGEMENT – 127
research findings as important to its decision-making. Accordingly, public opinion and perceptions of services are gauged through regular studies carried out by public institutions not connected to the Tax Agency (e.g. the Sociological Research Centre and the Institute for Fiscal Studies). Results are published in the Agency’s annual report. The Tax Agency also uses its website to survey the opinions of the people who have used its electronic Personal Income Tax filing service. The example in Box 3.9 is taken from Spain’s 2011 and prior year Annual Reports.
The Netherlands Tax and Customs Administration (NTCA) is another revenue body that places value on gathering feedback and opinions-“segment” by “segment” of clients. As reported in its 2011 Management Report, the NTCA conducts an annual Tax Monitor survey to review the perceptions individuals and enterprises have of the tax authorities and their assessment of the actions of the Tax and Customs Authorities. The Tax Monitor encompasses a survey of 4 300 persons divided between six target groups, namely private individuals, persons entitled to benefits, entrepreneurs, Customs clients, tax service providers and benefit intermediaries. In addition, in 2011 a client monitor was conducted amongst both Medium-Sized Businesses and Very Large Businesses. 84% of the respondents from the Very Large Businesses who came into contact with horizontal monitoring had a favourable to very favourable perception of horizontal monitoring developments. 80% of the respondents from the MediumSized Businesses who came into contact with horizontal monitoring had a favourable to very favourable perception of these developments. The Medium-Sized Businesses monitor was conducted for the second time in 2011. The scores for compliance, client satisfaction and the speed of processes were than higher than those in 2009.
The NTCA’s general performance was awarded an average score of 6.5 in the 2011 Tax Monitor, the same score as in the preceding year. The respondents were satisfied with the service provided by the website and the Tax districts’ front desks, as well as with the clear answers provided to letters and notices of objection. The respondents were less satisfied with the speed at which notices of objection are processed. Private individuals are satisfied with the use of pre-completed returns in the return process. Private individuals are less satisfied with the speed at which amendments to benefits are processed and with the treatment of income tax returns. Entrepreneurs are satisfied with the returns process and the performance of the Customs processes.
New Zealand Inland Revenue (IR)’s annual report notes that measuring customer satisfaction helps it understand how effective customers think it is in delivering timely and appropriate services. IR adopts a “customer segment” and “channel by channel” approach for gathering the feedback it relies on and publishes its results. The information displayed in Box 3.10 is taken from its 2010-11 annual report.
Summary observations
As will be evident from the preceding commentary, many revenue bodies have taken steps to increase the focus of their planning and performance evaluation towards the “outcomes” to be achieved from their administration, in particular concerning taxpayers’ compliance.
For some revenue bodies, this has included the use of: 1) direct and indirect measures of taxpayers’ compliance across the major risk types; 2) measures that reflect the quality of services delivered to taxpayers and tax professionals; 3) reductions in taxpayers’ compliance burden; and 4) measures reflecting the level of taxpayer satisfaction with, and confidence in, the revenue body. Where applicable, some revenue bodies have devised “outcomesfocused” measures for their non-tax functions (e.g. the payment of benefits and customs
TAX ADMINISTRATION 2013: COMPARATIVE INFORMATION ON OECD AND OTHER ADVANCED AND EMERGING ECONOMIES – © OECD 2013
128 – 3. SELECTED ASPECTS OF STRATEGIC MANAGEMENT
administration). In many cases, formal targets have also been set for improved “outcomes” (and outputs) as a means of setting the direction for improved performance and for use by the revenue body to gauge overall progress towards its stated goals and objectives.
Box 3.3. United States: Monitoring progress towards strategic goals
TAX ADMINISTRATION 2013: COMPARATIVE INFORMATION ON OECD AND OTHER ADVANCED AND EMERGING ECONOMIES – © OECD 2013
3. SELECTED ASPECTS OF STRATEGIC MANAGEMENT – 129
Box 3.3. United States: Monitoring progress towards strategic goals (continued)
Source: IRS Oversight Board Annual Report to Congress 2011.
TAX ADMINISTRATION 2013: COMPARATIVE INFORMATION ON OECD AND OTHER ADVANCED AND EMERGING ECONOMIES – © OECD 2013
130 – 3. SELECTED ASPECTS OF STRATEGIC MANAGEMENT
Box 3.4. United Kingdom HMRC’s reporting of tax compliance (in aggregate and by selected taxpayer segments)
TAX ADMINISTRATION 2013: COMPARATIVE INFORMATION ON OECD AND OTHER ADVANCED AND EMERGING ECONOMIES – © OECD 2013

3. SELECTED ASPECTS OF STRATEGIC MANAGEMENT – 131
Box 3.5. Canada: Reporting outcomes re taxpayers’ compliance
Filing and registration non-compliance
Our indicators |
Current target 2006-2007 2007-2008 2008-2009 2009-2010 2010-2011 |
Canadian businesses that were registered for the GST/HST Table note 1
Individuals 18 years and older who filed their returns on time
Corporations - Taxable incorporated businesses that filed their returns on time Table note 2
90% |
97.8% |
98.4% |
95.8% |
93.5% |
93% |
90% |
93% |
92.5% |
92.8% |
92.8% |
92.6% |
90% |
86.4% |
85.8% |
84.4% |
85.5% |
85.1% |
Table note 1: These estimates use the number of businesses who file timely returns as a proxy for registrants. The population of businesses includes some small businesses which are not required to register as part of the calculation. As a result, the estimate may understate the proportion of businesses who actually register to collect GST/HST.
Table note 2: Almost all of taxable corporations used for this calculation filed their returns within 5 years, either voluntarily or as a result of our non-filer work.
Reporting compliance
In 2010-11, we estimated that 17.6% of claims or deductions made by individuals on key tax credits and deductions not subject to third-party reporting were non-compliant, meaning they were disallowed following a review. The increase may be attributed, among other factors, to the change in deductions and credits that were reviewed in each program year.
Our Indicator |
Current target |
2007-2008 |
2008-2009 |
2009-2010 |
2010-2011 |
|
Key tax credits and deductions not subject to third-party |
Downward trend |
14.8% |
16.5% |
15.4% |
17.6% |
|
reporting – Individuals Table note 1 |
||||||
|
|
|
|
|
Table note 1: It should be noted that this type of non-compliance is found in a relatively small segment of the population of individual taxpayers.
One of our pre-assessment review programs is the Confidence Validity Program. Through this program, various deductions and credits on returns are reviewed and corrected before a notice of assessment is issued. During 2010-2011, we identified an average of USD 472 of additional tax assessed per review, for a total of USD 162 million in taxes additionally assessed. This represents a decrease of 5% over the previous year. The variance is attributed to our review strategies which adjust the volume of each deduction and credit reviewed each year. While the Confidence Validity Program corrects returns before the Notice of Assessment is issued, our Processing Review Program selects files for review after the assessment notice (and any refunds) have been issued. The program promotes compliance and helps to maintain confidence in the fairness of our programs through increased education, effective risk-scoring systems, and a balanced approach to our file selection process. In 2010-11, this program identified and assessed USD 232 million in additional taxes, an increase of 15% over the previous year.
Our T1 Matching Program compares information on an individual’s tax return with information provided by third-party sources, such as employers or financial institutions. In 2010-11, this program identified and addressed additional tax assessments of almost USD 600 million.
Individual filers assessment programs |
20072008 |
2008-2009 |
2009-2010 |
20102011 |
Confidence validity (USD million) |
USD 126 |
USD 120 |
USD 171 |
USD 162 |
Processing review (USD million) |
USD 190 |
USD 152 |
USD 201 |
USD 232 |
T1 matching (USD million) |
USD 574 |
USD 623 |
USD 615 |
USD 600 |
Remittance non-compliance
Our indicators |
Current target |
2006-2007 2007-2008 2008-2009 2009-2010 2010-2011 |
||||
Individuals who paid their reported taxes on time |
90% |
92.9% |
91.5% |
93.2% |
93.7% |
94.3% |
Percentage of payable corporations taxes paid on time |
90% |
90.9% |
92.4% |
92.2% |
93.5% |
93.5% |
Source: CRA Annual report 2010-11.
TAX ADMINISTRATION 2013: COMPARATIVE INFORMATION ON OECD AND OTHER ADVANCED AND EMERGING ECONOMIES – © OECD 2013

132 – 3. SELECTED ASPECTS OF STRATEGIC MANAGEMENT
Box 3.6. Australia: Reporting performance outcomes re service delivery
|
|
2009-10 |
|
2010-2011 |
|
|
|
|
|
Achieved |
|
Service standard |
Benchmark |
Achieved % |
Indicator |
% |
Indicator |
Registrations |
|
|
|
|
|
Registrations-Commissioner of Taxation |
93% in 28 days |
92.3 |
Not met |
96.2 |
Met |
Registrations-Australian Business Register |
93% in 28 days |
91.3 |
Not met |
93.7 |
Met |
|
|
|
|
|
|
Return filings |
|
|
|
|
|
Electronic tax returns-taxable individuals |
94% in 14 days |
85.8 |
Not met |
82.7 |
Not met |
Paper tax returns-taxable individuals |
80% in 42 days |
93.4 |
Met |
93.9 |
Met |
Electronic tax returns-non- individuals |
92% in 14days |
78.3 |
Not met |
93.0 |
Met |
Paper tax returns-non-individuals |
80% in 56 days |
81.8 |
Met |
91.0 |
Met |
Electronic credit activity statements |
92% in 14 days |
98.2 |
Met |
98.0 |
Met |
Paper credit activity statements |
85% in 14 days |
97.5 |
Met |
97.7 |
Met |
Electronic debit activity statements |
95% in 14 days |
99.6 |
Met |
99.8 |
Met |
Paper debit activity statements |
90% in 42 days |
98.9 |
Met |
98.5 |
Met |
|
|
|
|
|
|
Refunds and payments |
|
|
|
|
|
Refund of overpaid tax |
90% in 28 days |
82.5 |
Not met |
88.9 |
Not met |
Superannuation holding accounts special account payment |
80% in 21 days |
72.1 |
Not met |
81.4 |
Met |
requests |
|
|
|
|
|
Excise fuel scheme claims |
92% in 14 days |
93.7 |
Met |
94.6 |
Met |
|
|
|
|
|
|
Enquiries |
|
|
|
|
|
Automated email response |
90% in 3 days |
95.9 |
Met |
97.0 |
Met |
Inbound correspondence |
85% in 28 days |
83.9 |
Not met |
90.1 |
Met |
Private written advice |
80% in 28 days |
69.3 |
Not met |
87.9 |
Met |
Telephone general inquiries |
80% in 5 min |
81.3 |
Met |
81.3 |
Met |
Tax practitioners premium service phone enquiries |
90% in 2 min |
90.9 |
Met |
90.5 |
Met |
Visit general enquiry service |
90% in 10-15 min |
92.5 |
Met |
93.1 |
Met |
Amendments and reviews |
|
|
|
|
|
Electronic amendments |
90% in 28 days |
95.1 |
Met |
96.3 |
Met |
Paper amendments |
75% in 56 days |
85.2 |
Met |
88.0 |
Met |
Reviews of private written advice |
85% in 28 days |
71.4 |
Not met |
90.3 |
Met |
Reviews other than private written advice |
70% in 56 days |
59.0 |
Not met |
79.5 |
Met |
|
|
|
|
|
|
Audits |
|
|
|
|
|
Audits and reviews finalised advice |
99% in 7 days |
99.2 |
Met |
99.5 |
Met |
|
|
|
|
|
|
Errors |
|
|
|
|
|
Clerical and administrative errors |
70% in 21 days |
N/A |
|
N/A |
|
Complaints |
|
|
|
|
|
Complaints - initial contact |
85% in 3 days |
66.6 |
Not met |
71.1 |
Not met |
Complaints - resolution |
85% in 21 days |
74.7 |
Not met |
78.2 |
Not met |
|
|
|
|
|
|
Source: ATO Commissioner’s Annual Report 2011.
TAX ADMINISTRATION 2013: COMPARATIVE INFORMATION ON OECD AND OTHER ADVANCED AND EMERGING ECONOMIES – © OECD 2013
3. SELECTED ASPECTS OF STRATEGIC MANAGEMENT – 133
Box 3.7. Canada: Reporting performance outcomes re taxpayer services
Source: 2010-11 CRA Annual Report.
TAX ADMINISTRATION 2013: COMPARATIVE INFORMATION ON OECD AND OTHER ADVANCED AND EMERGING ECONOMIES – © OECD 2013

134 – 3. SELECTED ASPECTS OF STRATEGIC MANAGEMENT
Box 3.8. Ireland: Reporting performance outcomes re service delivery
Customer service standards and results
Service |
Standard |
Results 2011 |
Results 2010 |
|
Complaints |
Processed within 20 working days |
96% |
99% |
|
|
|
|
|
|
Telephone * |
PAYE 1890 calls: |
37% within 30 secs |
51% within 30 secs |
|
|
50% within 30 secs |
68% within 3 mins |
82% within 3 mins |
|
|
85% within 3 mins |
85% within 5 mins |
92% within 5 mins |
|
|
100% within 5 mins |
|
|
|
|
Other calls answered: |
69% within 30 secs |
77% within 30 secs |
|
|
50% within 30 secs |
92% within 3 mins |
94% within 3 mins |
|
|
85% within 3 mins |
97% within 5 mins |
98% within 5 mins |
|
|
100% within 5 mins |
|
|
|
Registrations |
PAYE Customers registering for PAYE anytime, |
76% |
80% |
|
|
passwords will be issued within 5 working days by |
|
|
|
|
ordinary post. |
|
|
|
|
Business customers registering for ROS, passwords |
100% |
100% |
|
|
will normally be issued within 8 working days by |
|
|
|
|
ordinary post. |
|
|
|
|
Business customers registering for secure email, |
100% |
100% |
|
|
passwords will normally be issued within 3 working |
|
|
|
|
days by ordinary post. |
|
|
|
Returns, |
ROS 100% within 5 working days |
89% |
90% |
|
Declarations, |
|
|
|
|
Non ROS 80% processed |
Income Tax 12% |
IT 28% |
||
Applications |
||||
within 10 working days |
CT 33% |
CT 44% |
||
|
||||
|
|
Other 96% |
Other 96% |
|
|
|
|
|
|
|
Non ROS: 100% processed |
IT 22% |
Income tax 44% |
|
|
within 20 working days ** |
Corproate Tax 61% |
Corporate tax 74% |
|
|
|
Other 98% |
Other 99% |
|
Repayments |
Non-ROS – 80% processed in 10 working days |
94% |
92% |
|
|
|
|
|
|
|
Non-ROS – 100% processed in 20 working days |
98% |
97% |
|
|
|
|
|
|
|
ROS – 100% processed in 5 working days |
Income tax: 92%; Corporate |
Income tax: 91%; Corporate |
|
|
|
tax: 70%; PAYE: 96% |
tax: 64%; PAYE: 97% |
|
Correspondence, |
50% in 10 days |
66% |
74% |
|
email, fax |
85% in 20 days |
83% |
86% |
|
|
100% in 30 days |
93% |
93% |
|
Applications for |
100% processed in 5 working days |
92% |
86% |
|
tax clearance |
|
|
|
|
certificates (TCC) |
|
|
|
|
Applications for |
100% processed in 5 working days |
88% |
87% |
|
non-resident TCC |
|
|
|
|
Applications for |
100% processed in 5 working days |
97% |
99% |
|
standards in Public |
|
|
|
|
Office TCC |
|
|
|
*Results for 2010 only covered the period April to December.
**This calculation includes all Registered VAT Repayments, a portion of which will be ROS claims. We are unable to split them by source at this time but their inclusion is in line with prior years.
Source: Revenue Annual Report 2011, page 26.
TAX ADMINISTRATION IN ADVANCED AND EMERGING ECONOMIES: COMPARATIVE INFORMATION SERIES 2013 – © OECD 2013

3. SELECTED ASPECTS OF STRATEGIC MANAGEMENT – 135
Box 3.9. Spain: Reporting outcomes re perceptions of services and competence
Issue |
Opinion and perceptions |
Year of survey (and response % or average rating) |
|
|||||
2005 |
2006 |
2007 |
2008 |
2009 |
2010 |
|||
|
|
|||||||
Level of satisfaction with |
Very satisfied/ satisfied |
82.5 |
84.8 |
83.5 |
81.2 |
81.8 |
|
|
treatment and service in |
OK |
8.4 |
6.7 |
8.5 |
9.2 |
8.8 |
|
|
tax agency offices |
Not satisfied/dissatisfied |
8.6 |
8.1 |
8.0 |
9.4 |
9.0 |
|
|
|
Don’t know/No comment |
0.5 |
0.3 |
0.0 |
0.2 |
0.4 |
|
|
Public opinion on |
Has improved |
54.8 |
51.3 |
49.3 |
50.2 |
47.5 |
|
|
treatment and service |
Is the same |
31.6 |
37.2 |
40.1 |
36.0 |
38.9 |
|
|
provided |
Is worse |
1.9 |
2.0 |
2.4 |
4.8 |
3.7 |
|
|
|
Don’t know |
10.5 |
9.2 |
7.8. |
8.8 |
9.2 |
|
|
|
No comment |
1.2 |
0.3 |
0.3 |
0.2 |
0.7 |
|
|
Ratings awarded to the |
Good |
69.3 |
70.1 |
67.2 |
66.3 |
68.3 |
|
|
Taxpayer Information and |
Ok |
22.8 |
24.2 |
25.2 |
25.1 |
23.9 |
|
|
Assistance Service |
Bad |
6.0 |
5.0 |
6.8 |
8.0 |
6.3 |
|
|
|
Don’t know/ no comment |
1.9 |
0.6 |
0.9 |
0.6 |
1.5 |
|
|
Knowledge and use of |
Have knowledge |
65 |
67 |
61 |
74 |
68 |
72 |
|
services |
Use services |
35 |
37 |
33 |
47 |
38 |
38 |
|
Opinions relating to |
Positive |
82 |
85 |
87 |
78 |
84 |
88 |
|
services |
Negative |
18 |
15 |
12 |
21 |
16 |
12 |
|
|
Average rating 1-4 |
3.0 |
2.9 |
3.0 |
2.9 |
2.9 |
3.0 |
|
Opinions relating to |
Impartiality |
4.6 |
4.7 |
4.9 |
4.7 |
4.6 |
4.6 |
|
the Tax Agency’s staff |
Technical training |
5.0 |
4.9 |
5.0 |
4.9 |
4.8 |
5.0 |
|
(rating from 1-7) |
Appropriate treatment |
4.7 |
4.7 |
5.0 |
4.8 |
5.0 |
5.0 |
|
|
Concern for taxpayers’ problems |
3.9 |
3.7 |
4.2 |
4.0 |
3.8 |
3.9 |
|
Taxpayers satisfaction with |
e-filing service |
n.a |
59.4 |
51.5 |
56.8 |
61.2 |
63.9 |
|
Source: Spanish Tax Agency’s annual reports (up to memoria 2011).
Box 3.10. New Zealand: Reporting re perceptions of services and competence
Customer satisfaction – summary of results
Customer and channel categories |
|
2009-10 |
|
2010-11 |
|
Satisfied % |
Very satisfied % |
Satisfied % |
Very satisfied % |
||
|
|||||
Customer |
|
|
|
|
|
*** Overall satisfaction (all groupings) |
87 |
71 |
86 |
69 |
|
Tax agents |
91 |
78 |
90 |
71 |
|
Small and medium enterprises |
87 |
71 |
88 |
74 |
|
Working for families tax credits |
90 |
75 |
88 |
71 |
|
Large enterprises |
90 |
71 |
89 |
71 |
|
Student loans |
85 |
65 |
85 |
70 |
|
Individuals |
86 |
70 |
84 |
66 |
|
Not for profits |
84 |
68 |
88 |
71 |
|
Child support |
79 |
62 |
76 |
52 |
|
KiwiSaver |
89 |
66 |
87 |
71 |
|
Channel |
|
|
|
|
|
Telephone |
90 |
74 |
87 |
70 |
|
Correspondence |
74 |
58 |
78 |
57 |
|
Counter |
90 |
66 |
86 |
70 |
Source: New Zealand Inland Revenue Annual Report 2011.
TAX ADMINISTRATION IN ADVANCED AND EMERGING ECONOMIES: COMPARATIVE INFORMATION SERIES 2013 – © OECD 2013