

32Crystal growth
a growing crystal, the thickness of the diffusion boundary layer, the Berg effect, and how the solute component is supplied will be affected depending on the flow rate of the laminar flow or the nature of the turbulent flow, all of which influence the growth rate, perfection, and morphology of the crystal.
3.6Nucleation
The processes of crystal growth are divided into the following three stages.
(1)A driving force is applied, which causes the process to proceed by the formation of a supersaturated or supercooled state.
(2)Particles smaller than a critical size, which may be referred to as clusters, are formed in the system. Some of these clusters, out of the many that repeatedly come together and part again, may by chance grow larger than the critical size. The process that describes the situation up to the point where the particles reach critical size may be called the nucleation stage.
(3)Once it exceeds the critical size, the particle can grow larger. This process corresponds to the growth stage in its strictest sense.
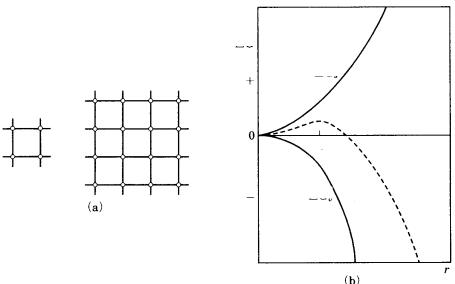
Among the clusters that are formed, those exceeding the critical size do not dissociate and can grow larger. As shown schematically in Fig. 3.7, this is because the density of dangling bonds per unit area on the surface decreases as the size increases, and it eventually reaches a critical value. Figure 3.7(b) shows this relation in terms of energy changes. The nucleation energy is the sum of the energy spent in forming a particle by coagulating atoms, – Gv, which is proportional to r3, and the energy gained by creating the surface, Gs, which is proportional to r2, namely G – Gv Gs. As can be seen in Fig. 3.7(b), the energy required for nucleation to occur increases as r increases, reaches a maximum at rc and decreases thereafter. The nucleus which attains rc is called the critical nucleus, and rc is referred to as the radius of critical nucleus.
Since a critical value exists for nucleation to occur, nucleation or growth hardly occur, except in a narrow region away from the solubility curve, which corresponds to the equilibrium situation. This narrow region along the solubility curve is called the Miers region (see Fig. 3.1).
Nucleation can be classified as (i) “spontaneous nucleation” or “homogeneous nucleation,” in which no intervention by other factors is necessary for nucleation to take place, and (ii) “heterogeneous nucleation,” which occurs due to the presence of a surface wall of a vessel, or foreign particles, or an impurity component. A much higher driving force is required for the former than the latter. There is a difference of a few tens of degrees centigrade in terms of supercooling between the
3.6 Nucleation 33
∆G
∆Gs
rc
∆Gv
Figure 3.7. (a) Changes in dangling bond density per unit surface area as the size of a particle increases. When the number of units constituting the nucleus increases from four to sixteen, the dangling bond density per unit area decreases from 8 to 16/9.
(b) Changes in nucleation energy G as the radius of a nucleus r changes. G reaches a maximum at rc. The energy required to attain volume Gv is proportional to r3, whereas the energy gained in creating the surface, Gs, is proportional to r2.
two in melt growth. Most nucleation phenomena in real systems may be regarded as heterogeneous. In contrast to this, it is accepted that homogeneous nucleation plays the essential role in nucleation under microgravity conditions.
The critical energy for nucleation is determined by the free energy of the interface (the surface of a nucleus) and the driving force. The smaller the critical energy, the easier it is for nucleation to take place, so impurities with crystal chemical similarity, unresolved tiny particles, steps, and unevenness or scratches on the surface of the vessel wall may all act as heterogeneous nucleation sites. The decoration method in electron microscopy (see Section 5.2), which enables us to observe steps on a nanometer scale, and the epitaxial method for growing single crystalline thin films (see Section 7.4), are techniques that utilize heterogeneous nucleation phenomena by taking account of the energy at steps and interfaces. The use of seed crystals allows growth to start immediately, bypassing the nucleation stage. Secondary nucleation, a method widely used in the field of industrial crystallization, is essentially the same as crystal growth using seeds, although traditionally a term of nucleation has been used.
It is the main purpose of industrial crystallization to obtain numerous tiny crystallites of equal size and form. To achieve this, a practical method has been adopted
34Crystal growth
in which large seed crystals are introduced into a reaction vessel and agitated. The surfaces of the seed crystals are detached by agitation, so providing numerous tiny crystallites in the system that act as seed crystals. Hence, the aim of obtaining numerous crystallites of equal size is achieved. Similar phenomena may be expected to occur in ascending movement of a magma containing phenocrysts [4] (see Section 8.5).
In equilibrium thermodynamics, the final stable phases are determined by a given temperature–pressure range. However, it is not always possible to achieve nucleation and growth of the stable phase from the very beginning when the system is kept under this condition. In many cases, the earliest phase that appears by nucleation is a metastable phase, which is different from the stable phase. This phenomenon is called Ostwald’s step rule [5]. This can be understood as a result of the competition between the driving force and the interface free energy terms. When the driving force term is small, the contribution from the surface energy term becomes more important. As a result of this competition, the nucleation of a metastable phase will occur prior to that of the stable phase. Before the appearance of the stable phase, the earlier formed metastable phase can develop in a stable manner, and behaves as if it is the stable phase. However, once the stable phase appears in the system, the earlier formed metastable phase starts to dissolve or transform, and the stable phase grows. If conditions are maintained that suppress the appearance of a stable phase, the metastable phase can become stable [6]. The
formation of aragonite (a high-pressure phase of CaCO3) existing in living bodies, or of CVD diamonds (a high-pressure phase of carbon) under 1 atm pressure are
such examples.
In this section we have explained the relation between a bulk ambient phase and a bulk crystal (where the crystal is assumed to have an ideal, regular structure). Since the 1930s, theoretical and experimental investigations have indicated that a real crystal contains defects of lattice order, and that these defects have a significant effect on the physical properties of the crystal. This understanding has led to the present day semiconductor industry.
3.7 Lattice defects
Physical properties of solid materials which are greatly influenced by the presence of defects of lattice order in real single crystals are called “structuralsensitive properties,” and are distinguished from “intrinsic properties,” which are determined by the elements constituting the crystal, for example the chemical bonds, the structure, etc. Color, plasticity, glide, and semiconductor properties are structural-sensitive properties, whereas density, hardness, elasticity, and optical, thermal, and magnetic properties are the intrinsic properties. Structural-sensitive
3.7 Lattice defects 35
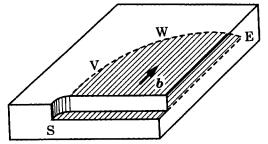
Figure 3.8. Explanation of dislocations in relation to glide. The solid arrow, b, corresponds to the Burgers vector of the dislocation. SV is the screw dislocation, WE is the edge dislocation, and VW is a mixed dislocation. The shaded area represents a glide plane.
properties will be different for each individual sample. There are cases where even the intrinsic properties are influenced by lattice-order defects.
The lattice defects are classified as (i) “point defects,” such as vacancies, interstitial atoms, substitutional impurity atoms, and interstitial impurity atoms, (ii) “line defects,” such as edge, screw, and mixed dislocations, and (iii) “planar defects,” such as stacking faults, twin planes, and grain boundaries.
Within these three categories, the earliest attention was paid to point defects; this arose from intellectual curiosity about the origin of the deep blue color seen in large colorless single crystals of NaCl occurring in salt deposits. From this starting point, the idea of color centers was developed. Since the color centers are point defects, they modify the electronic states around the defects and affect the heat and electronic conductivity; consequently, they have become directly connected to the development of the semiconductor industry.
The concept of line defects was theoretically introduced to provide an answer to the discrepancy between the theoretical and experimental values of shear stress to create glide (slip). It took nearly twenty years to prove the presence of dislocations in crystals. Glide is a phenomenon in which part of a crystal is displaced (without losing adhesive force on a glide plane) by a distance (either a lattice spacing or a multiple of it) in the glide direction. The theoretical value of the shear modulus, assuming that glide occurs instantaneously in a perfect ideal crystal, was calculated to be up to 1000 times the experimentally measured value. From this emerged a theory that considered the glide phenomenon to be linked to a movement of dislocations. The theory assumed that glide occurs because dislocations move on the glide plane (see Fig. 3.8).
If we assume that gliding occurs on the glide plane in the direction of and by the amount indicated by the solid arrow, we see that the lattice is distorted along the front of the glide, SVWE. The mode of distortion of the lattice plane is different
36Crystal growth
between the portion perpendicular to the arrow, WE, and that parallel to the arrow, SV, and again at the intermediate portion VW. At WE, the lattice plane is distorted as if a half lattice plane is inserted like a knife-edge, and at SV it continues to the next lattice plane in the manner of a spiral staircase. The former is called an edge dislocation, and the latter is referred to as a screw dislocation. VW is called a mixed dislocation, since it possesses both components.
The direction and size of the solid arrow in Fig. 3.8 represent the vector that characterizes the dislocation; this is called the Burgers vector. This can be of lattice size, or an integer fraction or integer multiple of the lattice size. Since the lattice plane is distorted along the narrow region around a dislocation line, a strain field is concentrated there. This region is called the dislocation core, and it can be a preferential site for dissolution or adsorption to take place. Indeed, the earliest experimental verification of the presence of dislocations in single crystals was achieved by producing point-bottomed etch pits, corresponding to the outcrops of dislocations, and subsequently etching the specimen after applying stress. A change in form of the etch pit from point-bottomed to flat-bottomed was observed at the original outcrop of the dislocation, and point-bottomed etch pits were noted at the position to which the dislocation had traveled. Dislocations may now be directly observed by various techniques, such as X-ray topography or transmission electron
microscopy.
The concept of dislocations was theoretically introduced in the 1930s by E. Orowan and G. I. Taylor, and it immediately played an essential role in the understanding of the plastic properties of crystalline materials, but it took a further twenty years to understand fully the importance of dislocations in crystal growth. As will be described in Section 3.9, it was only in 1949 that the spiral growth theory, in which the growth of a smooth interface is assumed to proceed in a spiral step manner, with the step serving as a self-perpetuating step source, was put forward [7].
Dislocations themselves play a role in promoting growth, but they may also be induced into existing, growing crystals at various stages. Lattice mismatch can result where the side branches of a dendritic crystal unite, when an inclusion trapped during growth is enclosed, or along the boundary of two crystals with slightly different orientations. Lattice parameter mismatches between host and guest crystals in epitaxial growth are also origins of growth-induced dislocations. When a real crystal grows in an uncontrolled system, it will usually have a dislocation density of the order of 108 10 lines/cm2. In utilizing single crystals for devices, it is necessary to grow single crystals containing a reduced dislocation density; however, the distribution of the dislocations in single crystals can serve as a reliable record of the growth process.
Growth-induced dislocations may multiply during the post-growth process. If stress is applied to dislocations fixed by impurities, the induced dislocations mul-