

68Morphology of polyhedral crystals
liquid is trapped in a crystal as an inclusion and growth proceeds on its inner wall, forming a negative crystal, the morphology may be considered to be representing the equilibrium form. It is also possible to carry out experimental investigations under higher temperatures in an electron microscope. The equilibrium form is not just polyhedral in type, bounded by low-index crystal faces [9], it may take a form bounded by flat and curved faces, depending on the given conditions.
It is difficult to measure the surface free energy of a crystal directly. A suitable method that is often adopted involves evaluating the surface free energy by calculating the energy required to cut a bond. Following this type of procedure, Wolff’s “broken bond model” [10] predicts equilibrium forms. In the model, the surface
free energy of a face, hkl, is calculated based on the strength, type, ionicity, and coordination of the dangling bond involved in the bonding. The most important
PBC vector, uvw , in surface free energy can also be deduced, using the hkl value for several faces. Using this method, we may systematically and relatively easily
deduce the equilibrium form of a real crystal, for complicated as well as simple structures. The method takes into consideration the Wulff plot, the Stranski concept of attachment and detachment energies, and the HP PBC theory.
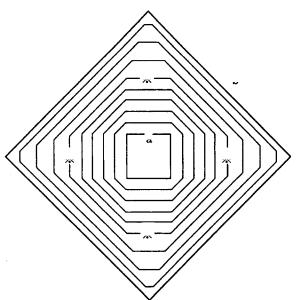
In Fig. 4.6, the result obtained by the Wolff construction illustrates how the equilibrium form of a crystal consisting of atoms A and B will change depending on the changing ionicity of the A–B bond.
4.4Growth forms
4.4.1Logical route for analysis
The Tracht and Habitus exhibited by real crystals vary greatly depending on the perfection of the crystals and the growth environments and conditions. We refer to these “growth forms” as plural (as opposed to the singular structural and equilibrium forms), since they may vary during the growth process of a particular crystal, or they might be different among crystals of the same species formed under different conditions. It is possible to analyze what sorts of growth environment and conditions may influence crystal forms using the structure form and the equilibrium form as criteria.
The growth forms of polyhedral crystals appear as a result of different normal growth rates R of different crystal faces or among different, crystallographically equivalent, faces. Crystal faces with large R will disappear; only those with small R will survive. When a crystal reaches an equilibrium state, the crystal will be bounded by crystal faces with the smallest surface free energy , namely with minimum R. This is the equilibrium form. However, before reaching such a state, the crystal will exhibit different Tracht and Habitus determined by the relative ratio of R values (Fig. 4.7). These are the growth forms. Therefore, in order to understand

4.4 Growth forms 69
Figure 4.6. Wolff’s equilibrium form [10]. AB composition of wurtzite type. The
equilibrium form changes depending on the ionicity in the A–B bonding.
the origin of the variation of Tracht and Habitus in growth forms, it is necessary to analyze which factors involved in ambient phases produce which sorts of effects upon R.
The structural and equilibrium forms of crystals are predicted assuming that the crystal is perfect and that the ambient phase is isotropic. Growth forms, however, describe real crystals containing lattice defects growing in a real ambient phase. We should therefore consider the following factors, which may affect the growth forms.
(1)The structure of the ambient phases, i.e. the differences in the melt phase, the solution phase, and the vapor phase, and the difference of the solute–solvent interaction energies in solution growth.
70 Morphology of polyhedral crystals
|
* |
b |
|
|
|
|
a |
|
* |
|
* |
|
* |
|
Figure 4.7. Growth forms. The normal growth rates R of a faces increase at *, whereas
those of the b faces remain unchanged.
(2)The factors inducing anisotropy into the ambient phase: flows in solution, such as laminar or turbulent flow, convection induced by temperature difference, concentration difference, or difference in surface tension.
(3)Anisotropy in interface roughness and in a roughening transition.
(4)Anisotropic distribution of active centers for growth, such as lattice defects, which contribute to growth.
It should be noted that there may be other possible factors affecting the normal growth rate of crystal faces.
4.4.2Anisotropy involved in the ambient phase
Let us start by examining the origin of malformed Habitus that deviates greatly from the structural or equilibrium forms.
As a representative example, let us investigate the Habitus variation of an ionic crystal growing from an aqueous solution in a beaker. In ref. [11], which was published in the seventeenth century, we see a sketch showing alum crystals grown on the bottom of a beaker taking triangular or hexagonal platy form, in contrast to the typical octahedral form of an alum crystal growing on a string in the solution, in spite of the fact that all these crystals are bounded by {111} faces only. It is clear that the reason is in the anisotropy involved in the supply of solute component. In
4.4 Growth forms 71
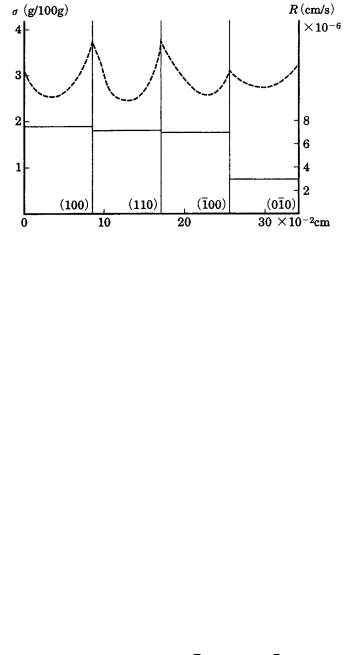
Figure 4.8. Growth rates R (solid lines, right axis) and distribution of surface
supersaturation (dotted lines, left axis) of four {100} faces of a NaCl cubic crystal
growing between two glass plates (Bunn’s experiment) [12].
an isotropic environment, crystallographically equivalent {111} faces develop equally, but in an anisotropic environment the normal growth rate R of crystallographically equivalent faces may become anisotropic.
Figure 4.8 is taken from experimental results due to Bunn [12], who measured the growth rate and supersaturation distribution on {100} faces growing in a supersaturated aqueous NaCl solution sandwiched between two glass plates. Since the crystal is sandwiched in this way, the crystal shows a rectangular, not cubic, form. The figure clearly demonstrates that the growth rates R of the four crystallographically equivalent {100} faces are not the same, and that the growth rates R of a face with smaller Berg effect (with a smaller concentration difference between the center and edges of a face) is as small as two-fifths of that of other crystallographically equivalent faces. It has been confirmed with alum and Ba(NO3)2 crystals that the degree of the Berg effect varies due to the flow rate of the solution over a crystal face, and that the difference in the driving force between the edges and the center of a face becomes smaller as the flow rate increases [13]; see also ref. [1], Chapter 3.
From the results of analysis of the structural form of quartz crystal and the growth rate measurements on synthetic quartz, it has been well established that
the difference in growth rates of r{1011} and z{0111} is small, R1011¯ R0111¯ . However, it is common in natural quartz that r grows slightly larger than z,
whereas r z in synthetic quartz. Although there may be a slight difference depending on growth conditions in the development of r and z, examples showing the reverse relation, z r, have been reported only exceptionally. It has recently