

50 Crystal growth
temperature
Cs
interface |
position |
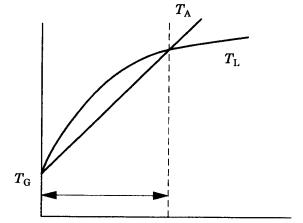
Figure 3.19. Schematic illustration of constitutional supercooling (CS). TL is the liquid temperature gradient, TG is the growth temperature gradient, and TA is the actual temperature gradient.
the central area of the face will advance outward, and so the polyhedral stability of the morphology can be maintained. If the bulk driving force increases above the value critical for two-dimensional nucleation to take place at the corners or edges (the area between /kT * and /kT ** in Fig. 3.15), dislocations outcropping near the edges or corners, or two-dimensional nucleation in these places, will act as sources for growth layers, which then advance inwards to the central area of the face. This corresponds to the formation of a hopper face. If the driving force increases further, three-dimensional nucleation will take place at sites where the driving force is maximum, namely at the corners of the crystal. It is expected that this protrusion will appear in the direction of the corners, and that it will possibly develop into a dendritic crystal for the same reason that morphological instability occurs on a rough interface.
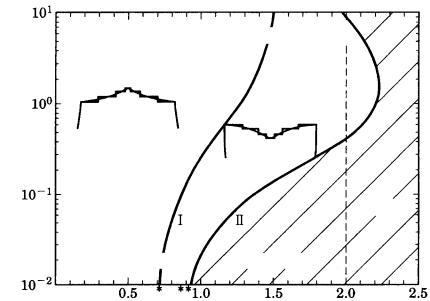
Taking the Berg effect into account, Kuroda et al. [21] demonstrated that the boundary between the area where the polyhedral morphology remains stable and the region where the stability is violated, and hopper or dendritic forms appear, will change depending on crystal size. Figure 3.20 shows their results.
3.12Driving force and morphology of crystals
If we predict morphological changes based on the analyses of interface states, on the R versus /kT relations for the three models of growth mechanism, and on the morphological stability of interfaces, as discussed in Sections 3.2–3.9,
3.12 Driving force and morphology 51
|
nucleation growth |
spiral growth |
mechanism |
|
|
mechanism |
|
crystal size (cm)
dendrite
stable region |
unstable region |
Figure 3.20. Size dependence of the boundary between morphologically stable and
unstable regions when the Berg effect is taken into consideration [21].
and then plot the results on an R versus /kT diagram as given in Fig. 3.15, we create Fig. 3. 21.
Figure 3.21 is a schematic diagram showing only one crystallographic direction. Below the driving force condition /kT *, the spiral growth mechanism is the controlling mechanism, and a polyhedral crystal bounded by flat faces is expected. Above /kT **, the interface will be rough, the growth mechanism will be of adhe- sive-type, and a dendritic morphology is expected. In the region between /kT * and /kT **, a hopper morphology is expected due to the two-dimensional nucleation mechanism. In this way, coherent logic has been established between dendritic and polyhedral morphologies of crystals, which were regarded as entirely independent problems at the early stages of study of the morphology of crystals. This range of morphology, from polyhedral to dendritic, is exhibited by single crystals. If /kT increases further, the rate of nucleation increases, resulting in the aggregation of many crystals. Depending on the conditions, spherical polycrystalline aggregates will appear due to radiating growth from a center. In the process of formation of a spherulitic, divergent, bow-tie, or semi-spherulitic morphology, either polycrystalline aggregates will be formed, or a random polycrystalline aggregation will appear.
The positions of /kT * and /kT ** in the diagram will be different for different

52 Crystal growth
growth rate R
smooth |
rough |
spiral two-dimensional nucleation


 *
* 

 ** driving force
Figure 3.21. Changes in the morphology of crystals, shown on a growth rate versus driving force diagram (see Fig. 3.15), assuming a crystal bounded by the {111} face only.
crystallographic directions. The higher the morphological importance, the larger these values will be. In other words, a growing crystal is bounded by faces having different driving forces, and so each face exhibits a different interface roughness.
In the case of a crystal bounded by both smooth and rough interfaces, the rough interface will disappear as the growth proceeds, and the crystal will eventually take a polyhedral form bounded by a smooth interface alone, unless the growth rate of the rough interface is suppressed due to environmental conditions. Since the growth of a polyhedral crystal is controlled by the spiral growth mechanism, the normal growth rate of the face is determined by the height, the spacing, and the advancing rate of the steps of the growth spiral. The factors which determine these three features therefore control the Tracht and the Habitus of polyhedral crystals. This will be analyzed in Chapter 4.
When a crystal grows under uncontrolled conditions, as in the crystal growth of natural minerals, nucleation first occurs under high driving force conditions, which will diminish as growth proceeds. This implies that a crystal which is originally dendritic will eventually take a polyhedral form bounded by a flat face. If a polyhedral crystal bounded by flat faces is bisected, a skeleton showing dendritic form will be observed in the interior. Abrupt changes in driving force conditions occur frequently in natural crystallization, such as in the uplifting of magma, and
3.13 Morphodroms 53
R |
R |
R |
R
–
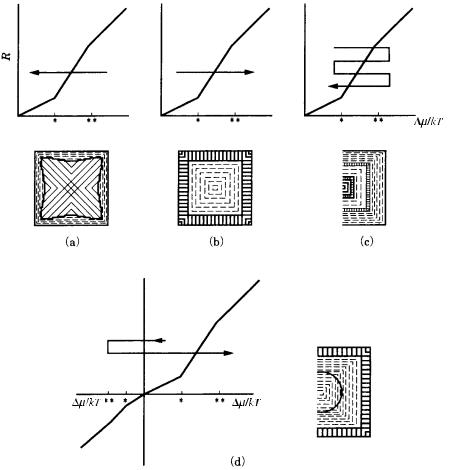
Figure 3.22. Textures recorded within a single crystal due to changes in the growth
conditions.
we therefore expect to find polyhedral crystals coated in a fibrous texture due to dendritic growth, or crystals showing multiple changes in cross-section. Figure 3.22 presents a summary of these internal textures.
3.13Morphodroms
We discussed in Section 3.12 that there is a mutual relation among spherulitic, dendritic, hopper, and polyhedral crystals, with respect to the driving force. We will see how these mutual relations appear in real systems, using, as representative examples, low-temperature snow crystals (vapor phase growth) and high-temperature silicate crystals growing in silicate solution phases.
54 Crystal growth
supersaturation (%)
temperature (°C)
dendritic
sector and plate
thick plate
spatial plate
needle
irregular needle
column
scroll or cup
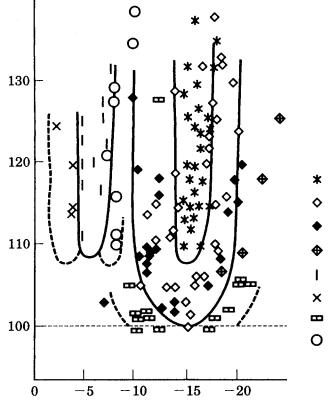
Figure 3.23. Morphodrom of snow crystals: Nakaya’s diagram [22].
The morphological phase diagram on which morphological variations of a crystal are illustrated in relation to growth conditions is called a “morphodrom.” This word was originally used by Kern et al. to illustrate variations of Tracht and Habitus of polyhedral ionic crystals growing in aqueous solution (see ref. [29], Chapter 4), but in fact there exist much older examples showing the morphological variation in the form of a morphological phase diagram. The earliest example is Nakaya’s famous diagram of snow crystals [22]; Nakaya depicted the morphologies of artificial snow crystals in relation to supercooling and supersaturation of H2O. Nakaya’s diagram is shown in Fig. 3.23. It is clearly seen from this diagram that snow crystals take on a polyhedral morphology in the region of low supersaturation of H2O, whereas they assume a dendritic morphology in the region of high driving force. An analysis of the reason why polyhedral snow crystals change their Habitus alternately from platy to prismatic depending on the degree of supercooling will be given in Chapter 4. The Nakaya diagram clearly shows that the morphology of snow crystals changes from polyhedral to dendritic as the supersaturation (driving force) increases.

3.13 Morphodroms 55
(°C)
(°C)
polyhedral hopper dendritic spherulitic
Figure 3.24. Morphodroms of silicate minerals [23]. (a) Summarized results on quenched samples: anorthite (An)–albite (Ab) series. (b) Summarized observation obtained by in situ method: diopside (Di)–anorthite (An) system.
Figures 3.24(a) and (b) show morphodroms of silicate crystals growing from silicate solutions: Fig. 3.24(a) shows the results of observations on quenched products, and Fig. 3.24(b) summarizes the results obtained by a high-temperature in situ observation method of growth [23]. In these cases also, as apart from the liquidus of solid–solution component, it is seen that the morphology of crystals changes from polyhedral, through hopper, to dendritic, then spherulitic. The predictions described in Section 3.12 are thus confirmed by experiment.