

44 Crystal growth
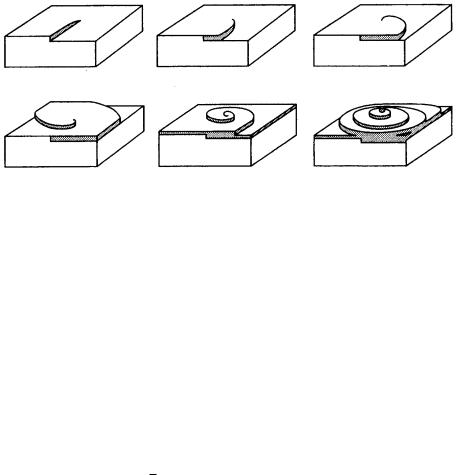
Figure 3.13. Mechanism of spiral growth.
3.9Spiral growth
In the layer-by-layer growth model formulated by Kossel [8] and Stranski [9], the growth rate is limited by two-dimensional nucleation. Growth will not occur unless the energy barrier required for two-dimensional nucleation is overcome, indicating that there should be a critical value of the driving force for growth to take place. In the case of crystal growth from the vapor phase, this value is estimated to be around 25–50% in terms of supersaturation. In real cases, we observe crystals growing under supersaturation as low as 1%. This large discrepancy between the theoretical and experimental values originates from the fact that Kossel and Stranski assumed the crystal to be perfect. Real crystals, however, are imperfect, containing impurities and dislocations. Frank’s spiral growth model has been proposed to account for the growth mechanism of real crystals. Soon after the proposal of this model, the first evidence to support the proof of the
model was obtained on {1010} faces of natural beryl crystals [18], followed by observations of spiral step patterns on many faces of a wide variety of crystals. Thus, the spiral growth theory was firmly established [19].
When a screw dislocation outcrops on a smooth interface, a step is created on the surface that has zero height at the dislocation core and a height corresponding to one Burgers vector at the edge of the face. The growth step starting from such a step advances like a spiral staircase around the dislocation, which acts as a prop, as shown in Fig. 3.13. This is due to the difference in the angular velocity of advancement of the spiral step at the center and that at the edge. Since screw dislocation is a self-perpetuating step source, it is not necessary to overcome the energy barrier for two-dimensional nucleation. Crystals can grow by this mechanism below the critical driving force for layer-by-layer growth. The growth rate and the driving force are related as follows:
R A( /kT)2,
where A is a constant, and /kT is the driving force.
3.10 Growth mechanism and morphology 45
Adhesive type |
two-dimensional |
spiral growth |
||
|
nucleation growth |
|
||
|
|
|
|
|
|
|
|
( |
) |
|
|
|||
|
|
|
|
|
Rough |
transition |
smooth |
thermodynamic roughening transition kinetic roughening transition
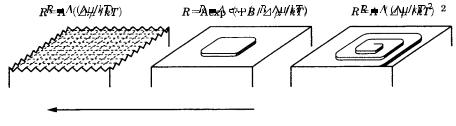
Figure 3.14. Differences between growth mechanisms on rough and smooth interfaces, showing the relation between the growth rate and the driving force in the adhesive-type growth mechanism, the two-dimensional nucleation growth mechanism, and the spiral growth mechanism. The roughening transition from a smooth to a rough interface is also shown. R is the growth rate, /kT is the driving force, and A and B are constants.
Spiral growth is a mechanism that is expected only on smooth interfaces. The assistance provided by screw dislocations is not necessary in the growth of rough interfaces, where an adhesive-type growth operates.
As explained above, three fundamental models of crystal growth mechanism were established in relation to the roughness of interfaces; these are illustrated in Fig. 3.14. At present, there is no other known growth mechanism that is essentially different from these three. Therefore, we shall analyze the morphology of crystals, the main topic of this book, based on these three growth mechanisms.
3.10Growth mechanism and morphology of crystals
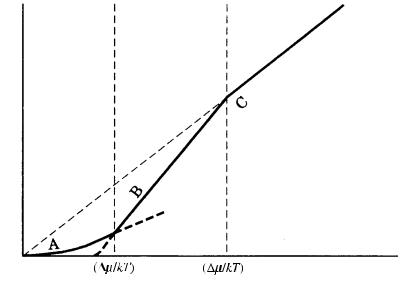
Figure 3.15 shows the growth rate R versus the driving force /kT for the three models of growth mechanism. This figure illustrates the following two points.
(1)As the driving force increases, an interface becomes rougher.
(2)Two bending points appear at /kT * and /kT **, since the curves of R versus the /kT relations expected for the three models of growth mechanisms are different. An interface becomes rough and the growth mechanism will be of adhesive-type above /kT **, whereas the interface will be smooth and growth will be principally controlled by the spiral growth mechanism below /kT *. In between /kT * and /kT **, the interface will be smooth, but the growth mechanism will be principally by two-dimensional nucleation.
Figure 3.15 is a schematic diagram of R versus the /kT relation expected in one
crystallographic direction in an imaginary ambient phase.
46 Crystal growth
rough
growth rate R
* |
** |
driving force
Figure 3.15. Areas where rough and smooth interfaces are expected. The growth rate versus the driving force relations expected for the three models of growth are indicated on the growth rate, R (vertical), axis versus the driving force ( /kT) diagram. Curve A shows the spiral growth mechanism; B represents the two-dimensional nucleation growth mechanism; C denotes the adhesive-type mechanism.
The positions of /kT * and /kT ** are different, even in the same crystallographic direction of the same crystal species, depending on the difference in ambient phase. In the condensed melt phase, the position of /kT ** of a material with 2 is expected to be very close to the origin (namely, the interface will be rough), whereas the position will be at a much larger value in the case of growth from vapor phase, which is the most dilute ambient phase. In solution growth, the position of /kT ** will be in between the two positions (Fig. 3.16). Depending on the difference of solute–solvent interaction energy, the positions of /kT ** will be different from material to material growing from the solution phase with the same solvent component. This implies that when the crystal grows from the melt phase the interface will be rough, whereas a crystal from the same species will have a smooth interface and spiral growth is expected when the crystal grows from the vapor phase. In other words, this implies that a polyhedral crystal bounded by flat faces will be more generally expected when a crystal grows from the vapor phase than when it grows from the melt phase. Also, depending on crystal species, the implication is that the morphology will be different, even if the crystals grow from the same aqueous solution, because the /kT ** values are different for different crystal species due to solute–solvent interactions.
3.11 Morphological instability 47
R |
R |
R |
* |
** |
* ** |
** |
(a) |
|
(CVT) (b) |
(c) |
Figure 3.16. The different positions of /kT * and /kT ** depending on the ambient
phases. (a) Vapor phase; (b) solution phase; (c) melt phase.
Figure 3.15 shows R versus /kT for one crystallographic direction. The positions of /kT * and /kT ** are different in different crystallographic directions of the same crystal. The crystal face ranked as the most important face in order of morphological importance (i.e. that which shows the sharpest cusp on the polar diagram of the (interface energy) plot, and belongs to a category of the most important F face in the PBC analysis, and has the highest reticular density in the BFDH (Bravais–Friedel–Donnay–Harker) law; see Chapter 4) is assumed to have the largest values of /kT * and /kT **. As the order of morphological importance decreases, these values will be lowered among the faces categorized as F faces. The position of /kT ** of K or S faces in the PBC analysis is expected to be closer to the origin.
3.11Morphological instability
The interface is the unique place where crystal growth (and dissolution) takes place. We have classified the interface into rough and smooth in the preceding section, and we have presented the expected growth mechanisms. In crystal growth from the melt phase, a rough interface will take a curved form that follows a curved plane of equal temperature, whereas in growth from the vapor or solution phases, it will follow a curved surface following lines of equal concentration. In contrast, a smooth interface takes a straight form truncating equi-thermal or equiconcentration lines. We shall discuss in this section whether the interface form can be maintained throughout the growth or not, what sort of instability will take place when the interface form is not maintained, and how these instabilities affect the morphology of crystals.
Let us assume that a small bulge appears on a rough, curved interface, and that for some reason the interface morphology is altered. Intervals between the lines of equal temperature or concentration become narrower at the bulge; hence, the
48 Crystal growth
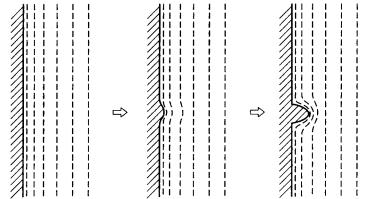
Figure 3.17. Relation between interface and lines of equal concentration in the
ambient phase when morphological instability occurs.
temperature or concentration gradient becomes sharper, resulting in an increasing growth rate (Fig. 3.17). The situations are the same for melt growth, in which heat transfer plays the essential role, and for diluted vapor or solution growth, in which mass transfer plays the essential role. When changes occur in the gradient of the temperature and concentration, the interface morphology loses its stability, and the bulge will be enhanced. Morphological instability is stronger on rough, curved interfaces than on smooth, flat interfaces.
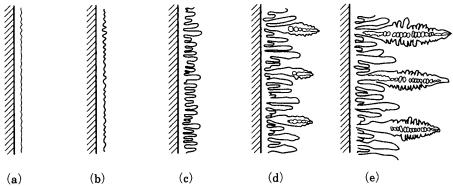
Unless cooperation of forces results in the suppression of interface instability, the instability will be enhanced as growth proceeds. As a result, periodic cellular structure, arrays of cusps, rod or lamellar structure, and further dendritic morphology will appear. Various patterns arising from morphological instability are indicated in Fig. 3.18. It is now understood that the dendritic morphology of snow crystals, which attracted the attention of early observers of crystals, results from morphological changes arising from morphological instability. The six symmetrical branches are due to the structure.
The problem of morphological instability was solved theoretically by Mullins and Sekerka [20], who proposed a linear theory demonstrating that the morphology of a spherical crystal growing in supercooled melt is destabilized due to thermal diffusion; the theory dealt quantitatively with and gave linear analysis of the interface instability in one-directional solidification.
The interface morphology is unstable for a variety of reasons; we should consider first constitutional supercooling, i.e. the change of melting point due to a change in impurity contents. In the solidification process of an alloy, even if crystallization starts from a flat solid–liquid interface with homogeneous impurity content, impurity concentrations in the solid and the liquid will change as growth proceeds (as the interface advances) because of the partitioning of impurity com-
3.11 Morphological instability 49
Figure 3.18. The process of changes in morphology due to interface instability.
(a)–(e) Starting from a smooth interface, it is seen that the morphology changes to a cusp array, to a rod structure, to a dendritic structure.
ponents between the solid and liquid phases. Impurity components with a partitioning (distribution) coefficient smaller than unity will concentrate on the interface. The rate of concentration will be determined by the diffusion constants of the impurity component, the growth rate of the crystal, and the distribution coefficient of the impurity component. This results in an apparent supercooling state due to the relation between the temperature gradient between the crystal and the melt and the concentration gradient, as schematically illustrated in Fig. 3.19. This is referred to as constitutional supercooling, and provides an explanation for crystal growth from a melt phase. As a result, the causes of rod, cellular, or lamellar structure observed as the solidification structure in alloys are explained. However, the same concept may be applicable to vapor or solution growth in the presence of impurity components.
Why polyhedral forms bounded by smooth interfaces can grow, whilst maintaining their polyhedral forms, was not properly accounted for until the layer-by- layer growth theory (which considers atomic process of crystal growth) formulated by Kossel and Stranski appeared.
If the growth is entirely controlled by diffusion, the crystal should take a spherical form, with no flat faces. The appearance of flat crystal faces was accounted for by the introduction of the concept of the layer-by-layer growth mechanism on a smooth interface. As an example of the violation of morphological instability, we may mention the Berg effect. As Berg demonstrated (see Section 3.4), the driving force over a crystal face is higher at the corners or on the edges than on the face, and it is lowest at the center of the face. There is a critical value for two-dimensional nucleation to occur. If the driving force at the corners and edges is lower than this critical value, the growth of this face will be controlled by the spiral growth mechanism (see Fig. 3.15), and the growth layer originating from screw dislocations in