

3.8 Interfaces 37
tiply to form loop-like dislocation rings. This is an important mechanism in the multiplication of dislocations, and is referred to as a Frank–Read source. In this way, growth-induced dislocations move during the post-growth period and form energetically more stable accumulations of dislocations. Secondary structures, such as dislocation tangles, networks or honeycomb structures of dislocations, small-angle grain boundaries, twist boundaries, and punched-out dislocations, are typical examples. On the other hand, growth-induced dislocations in crystals growing from the solution phase are generally distributed in bundles originating from the center of the crystal or from inclusions trapped during growth. They also originate on the surface of a seed crystal or from growth bands. Growth-induced dislocations usually run nearly perpendicularly to the growing surface.
In addition to lattice-order defects, much larger defects may often be induced into a growing crystal during or after growth; for example, the inclusion of solid, liquid, or vapor phases. Inclusions trapped simultaneously during the growth process are called syngenetic inclusions, whereas those induced after growth is complete are called epigenetic inclusions. Solid state syngenetic inclusions provide evidence of the compositions and thermodynamic conditions of the ambient phases at the time of crystal growth. If a liquid inclusion were trapped as a single phase, the dissolved component in the liquid would be dissociated in the form of vapor or solid phases due to the lowering of temperature and pressure, and would result in vapor–liquid two-phase inclusions or multi-phase inclusions in which vapor–liquid–solid phases coexist. Based on the temperature at which two phases change to a single phase on heating, the temperature at the time the inclusion was trapped may be evaluated, after first calibrating the effect of the pressure.
A phase is often encountered among silicate or sulfide minerals in spotted, star, lamellar, or lattice textures in the host phase. The phase was originally mixed as a homogeneous single solid solution with the host phase at the time of growth, and later precipitated or exsolved the phase of one solid solution component within the host crystalline phase as the temperature decreased. This phenomenon is called precipitation in physical or metallurgical fields and exsolution in geological disciplines. The exsolved phase has a definite crystallographic relation with the host phase to maintain minimum interface energy between the two phases.
3.8Interfaces
After clusters attain a critical size in the system and the nucleation stage is complete, the growth stage commences in a narrower sense. Since the structure is already formed, the solute component will be incorporated into the crystal at the expense of a much smaller energy than that necessary for nucleation. Here, the interface structure between the solid and liquid phases that appeared as a result of
38 Crystal growth
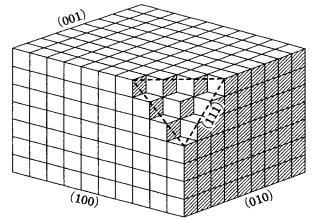
Figure 3.9. Kossel crystal.
nucleation becomes important. This is because the growth mechanism will be different depending on whether the interface is atomically rough or smooth. The rough interface consists entirely of kinks, and the smooth interface comprises a flat surface (terrace), a small number of steps, and a site where a step is bent, i.e. a kink.
Kossel [8] and Stranski [9] were the first to focus attention on the interface structure, after considering the experimental results obtained by Volmer [10], who demonstrated the existence of surface diffusion. It thus became possible to discuss the mechanism of crystal growth at an atomic level, starting from these analyses.
Let us assume that the constituent units of both a crystal and that of growth are simple cubes. This kind of model crystal is called a Kossel crystal, and is shown in Fig. 3.9. The {100} face is completely paved by the unit, and the surface is atomically flat. This face is called the “complete plane.” The {111} face, however, consists of kinks, as can be seen in Fig. 3.9, and has an uneven surface, and so it is called an “incomplete plane.” In contrast to {111}, {110} corresponds to a face consisting entirely of steps. Kossel did not give a particular name to this type of crystal face.
There are three different sites having different attachment or detachment energies in a Kossel crystal. A constituent unit of simple cubic form on the surface of a {100} face is connected to the crystal at five faces out of six; on the edge of a {100} face or on a {110} face, it is connected to four faces out of six; whereas at the corner of a {100} face or on the surface of an incomplete {111} face, it is connected to three out of six faces. These sites may be called a smooth face (terrace face), a step, and a kink, respectively. We can immediately understand that the energy of attachment for the growth unit to the crystal decreases in this order. Since at a kink site the attachment energy is equal to one-half of the bonding energy between the neighboring constituent units, a kink site is called a half-crystal site.
3.8 Interfaces 39
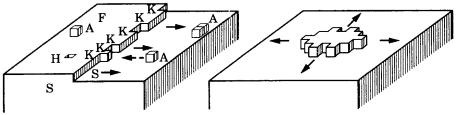
Figure 3.10. Schematic to show the layer-by-layer growth model due to twodimensional nucleation. This figure assumes the mode of nucleation to be the mononuclear model. Other models, such as the poly-nuclear or birth and spread models, as explained in the text, may also be considered.
Considering the attachment energy, we see that at an incomplete face an impinging growth unit will be immediately incorporated into the crystal. This indicates (i) that the growth mechanism of an incomplete face will be adhesivetype growth, (ii) that the interface will advance homogeneously, and (iii) that the rate of advancement of the interface (the normal growth rate) will be linearly related to the driving force.
In contrast, a growth unit arriving at a flat terrace surface on a complete interface cannot immediately be incorporated into the crystal. It may diffuse on the surface or leave the interface, returning to the initial phase. If there are steps or kinks, which are folded steps, on the terrace surface, an arriving growth unit will be incorporated into the crystal. As a result, the face will grow by two-dimensional spreading of the step. If the step reaches the edge of the face and the surface becomes completely flat, a new step source is required to continue growth. Kossel [8] and Stranski [9] assumed two-dimensional nucleation to take place. This mechanism is called layer-by-layer growth. Figure 3.10 shows this model schematically.
In this theory, since the growth rate of a face is controlled by the rate of twodimensional nucleation, we should expect the presence of a critical driving force, only above which growth can take place. Below this value, there will be no growth. As possible modes of two-dimensional nucleation, three different models may be considered.
(1)A mono-nuclear model, which allows only one nucleation, the next nucleation taking place only after the entire surface is covered by growth layers originating from the earlier nucleus.
(2)A poly-nuclear model, which allows many nucleations to take place on one surface.
(3)A birth and spread model, which allows nucleation and advancement of one growth layer at a time on one surface.
In all these models, we assume two-dimensional nucleation.

40 Crystal growth
Table 3.2 Terms used to express the states of interfaces
Kossel, Stranski |
complete face, incomplete face |
Burton, Cabrera, Frank |
singular face, non-singular face |
Hartman, Perdok |
flat face (F face), stepped face (S face), kinked face (K face) |
Present-day terminology |
smooth face, rough face |
|
|
|
|
Many theories on interface structures have been expounded, and consequently many different terms have been introduced; we summarize these in Table 3.2. Instead of referring to complete and incomplete faces, Burton, Cabrera, and Frank [11] used the terms singular and non-singular faces, in the sense of one face showing a sharp minimum (cusp) and one showing no minimum, respectively, on a polar diagram of surface energy. This classification is based on the calculation of statistical mechanics, and is closely related to the discussion of the equilibrium form (see Section 4.3). Hartman and Perdok [12] classified crystal faces into F (for flat face), S (stepped), and K (kinked face), depending on the numbers of periodic bond chains (PBCs) that were found in a crystal structure by connecting strong bonds. It is clear that these faces correspond to the {100}, {110}, and {111} faces of a Kossel crystal, respectively (Fig. 3.9). Today, the terms smooth and rough interface are commonly used alongside perfect and imperfect faces, and singular and non-singular faces.
As can be seen from the Kossel crystal shown in Fig. 3.9, the roughness of an interface depends on which faces we are considering, i.e. on the crystallographic directions. It also varies depending on the crystal species, the temperature, and the driving force. Increasing the temperature or driving force will cause a smooth interface to change into a rough interface. The transition point that exists in going from a smooth to a rough interface as the temperature increases is called a roughening transition. The existence of roughening transitions has been demonstrated by computer simulation. A roughening transition resulting from increasing driving force is called a kinetic roughening transition. Depending on the degree of roughness of an interface, the growth mechanism or growth rate versus the driving force relation changes, and so the interface roughness is an essentially important concept in analyzing the morphology of crystals and element partitioning (see Section 3.14).
The earliest theoretical predictions on the state of interfaces were made by Burton, Cabrera, and Frank [11], who demonstrated that the interface would, in most cases, be rough at the growth temperature for metal crystals. Jackson [13] suggested a system in which the solid and liquid phases are separated by an interface with one-layer thickness, and he calculated the energy changes as a function of the ratio of site occupancy of the constituent unit on the interface. When the site occupancy ratio was 50%, the interface was rough, whereas 0 or 100% site occupancy
3.8 Interfaces 41
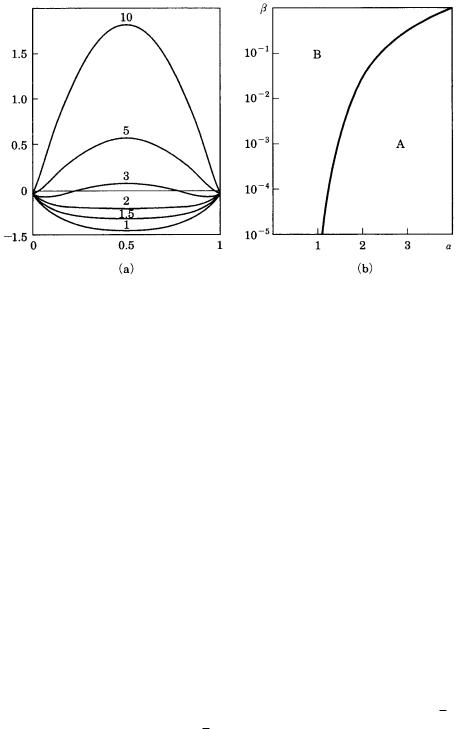
Figure 3.11. Prediction of interface roughness obtained by (a) Jackson [13] and
(b) Temkin [14], [15]. (a) The horizontal axis shows the surface site occupancy ratio, and the vertical axis depicts the change in free energy. Numerals are factors.
(b) The vertical axis indicates the driving force, and the horizontal axis shows the factor. A is the stable area for a smooth interface; B is the stable area for a rough
interface.
corresponded to a smooth interface. In this calculation, he used the so-called
Jackson factor defined by
(L/kTM),
where is the orientation factor, L is the heat of fusion, k is the Boltzmann constant, and TM is the melting point. Figure 3.11 (a) shows the results of Jackson’s calculation, and indicates that there are two types of curves depending on the factor. For materials with 2, there is only one minimum at 50% of surface site occupancy, indicating that the interface energetically prefers to be rough. On the other hand, in a material with 3, there are two energy minima at site occupancy 0 and 100%, indicating that the interface will be smooth.
The factors are different for different materials. Metal crystals generally have
2; semiconductor crystals have 2 3; and oxides, silicates, and polymer crystals, which have complicated crystal structures, have 3. Due to the presence of
(corresponding to the ratio between twoand three-dimensional coordination numbers zs/z), the factors will be different in different crystallographic directions in the same crystal. For ice crystals, the (0001) face has 3, whereas for the (1010) face it is 2 3, indicating that (1010) is a rougher face than (0001).
42 Crystal growth
In contrast to the equilibrium thermodynamic treatment performed by Jackson, Temkin [14], [15] considered the problem of the roughening transition of an interface in relation to the driving force and the factor. His result is shown in Fig. 3.11(b), in which area A corresponds to an area where a smooth interface is expected, whereas area B corresponds to that expected for a rough interface. On increasing the driving force, a smooth interface transforms into a rough interface: a kinetic roughening transition.
Jackson’s factor is the value measured at the melting point; the solute–solvent interaction is not taken into account. This corresponds to the situation of crystal growth in the melt phase. Bennema and Gilmer [16] generalized Jackson’s factor as follows so that it can be applied to the solution phase, which involves a solute–solvent interaction:
G { sf 1/2( ss ff)}/kTG.
G is a generalized factor, ss and ff are bonding energies in the solid and fluid phases, respectively, sf is the solute–solvent interaction energy, k is the Boltzmann constant, and TG is the growth temperature, which is lower than the melting point. In crystal growth from the melt phase, G becomes the same as that in Jackson’s expression. In this generalization, however, G is given in terms of the growth temperature and the solute–solvent interaction energy, so it is different from Jackson’s
factor.
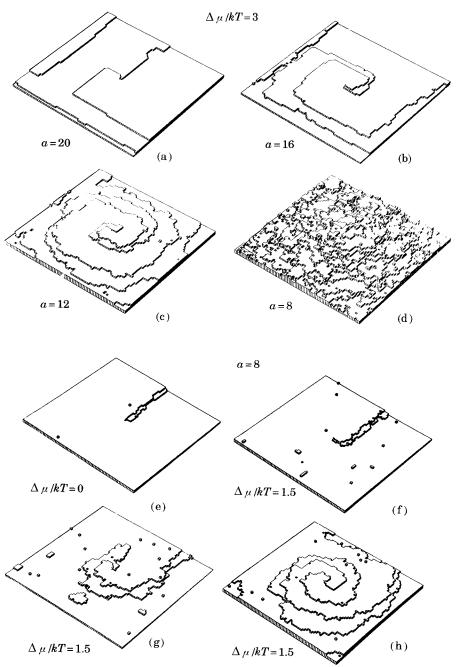
Extensive computer experiments have been made since the 1980s to investigate how interface structure changes as /kT changes, to determine whether the roughening transition takes place, and to establish how the growth rate versus the driving force relation (and thus the growth mechanism) change depending on changes in the factor, G factor, or /kT. The results were as expected; Fig. 3.12 shows two examples of the results of computer experiments.
The above analyses assume that the interface structure does not change under any growth conditions. It has been experimentally demonstrated using Si crystals that the interface structure may be reconstructed in some ambient phases. Atoms in the interior of the crystal are bonded three-dimensionally and symmetrically to neighboring atoms, whereas those on the surface are not. The surface atoms are bonded with atoms in the structure, but not with those in the ambient phase. Consequently, they are in a higher energy state than the atoms in the crystal. Under certain conditions, “surface reconstruction” is required to relax the highenergy state; this is achieved by the formation of partial bonding, for example the formation of a 3 3 structure instead of the original 1 1 structure. It has been shown that reconstructed structures appear in Si 2 1 or 7 7, and in Ir (100) a 1 1 structure changes to a 1 5 structure. Crystal faces having such a reconstructed structure will be modified accordingly, and they exhibit a different surface morphology from ordinary non-reconstructed faces (see Section 4.4).
3.8 Interfaces 43
Figure 3.12. Changes in interface roughness as a result of changing and , taken from the results of a computer experiment [17]. (a)–(d) indicate changes in interface
state for varying while keeping /kT constant; (e) shows a step created by a
screw dislocation at equilibirum, /kT 0, and (f)–(h) show how it advances under
/kT 1.5, with constant.