


2. GENERAL ENERGY POLICY
As gas and renewable energy sources replace coal in power generation, domestic coal production has started to decline in recent years. Coal production peaked in 2008 at 579 Mtoe, and has since fallen by over a third to 368 Mtoe in 2018, despite a small increase from 2016. These are the lowest levels of US coal production since the 1970s.
Besides fossil fuels, the United States also has stable production of nuclear power, which accounted for 10% of total domestic energy production in 2018, and an increasing share of renewables. Total renewable energy production reached a record high in 2018 and covered 8% of total domestic energy production, thanks to high availability for hydro (1.2%) and the recent growth in wind (1.1%) and solar (0.5%).
The United States is also the world’s largest consumer of oil and gas, but demand has not increased with production. Instead, growth in domestic production has made the United States much less dependent on energy imports. In particular, oil import dependency (measured as the share of net imports in TPES) dropped from over 60% to below 20% in the last decade (Figure 2.6). The country is on a trajectory to become a total net exporter of oil by 2020.
Figure 2.6 Import dependencies for different energy sources in TPES, 1973-2018
80%
|
|
|
|
|
|
|
|
|
|
|
|
|
|
|
Oil |
60% |
|
|
|
|
|
|
|
|
|
|
|
|
|
|
Total energy |
|
|
|
|
|
|
|
|
|
|
|
|
|
|
|
|
40% |
|
|
|
|
|
|
|
|
|
|
|
|
|
|
Natural gas |
20% |
|
|
|
|
|
|
|
|
|
|
|
|
|
|
Coal |
0% |
|
|
|
|
|
|
|
|
|
|
|
|
|
|
|
-20% |
|
|
|
|
|
|
|
|
|
|
|
|
|
|
|
-40% |
|
|
|
|
|
|
|
|
|
|
|
|
|
|
|
1973 |
1976 |
1979 |
1982 |
1985 |
1988 |
1991 |
1994 |
1997 |
2000 |
2003 |
2006 |
2009 |
2012 |
2015 |
2018 |
IEA (2019). All rights reserved.
The rapid increase in domestic oil and gas production has made the United States significantly less dependent on energy imports.
Notes: Energy net imports as share of TPES. Data for 2018 are provisional.
Source: IEA (2019), World Energy Balances 2019, www.iea.org/statistics/.
Energy consumption
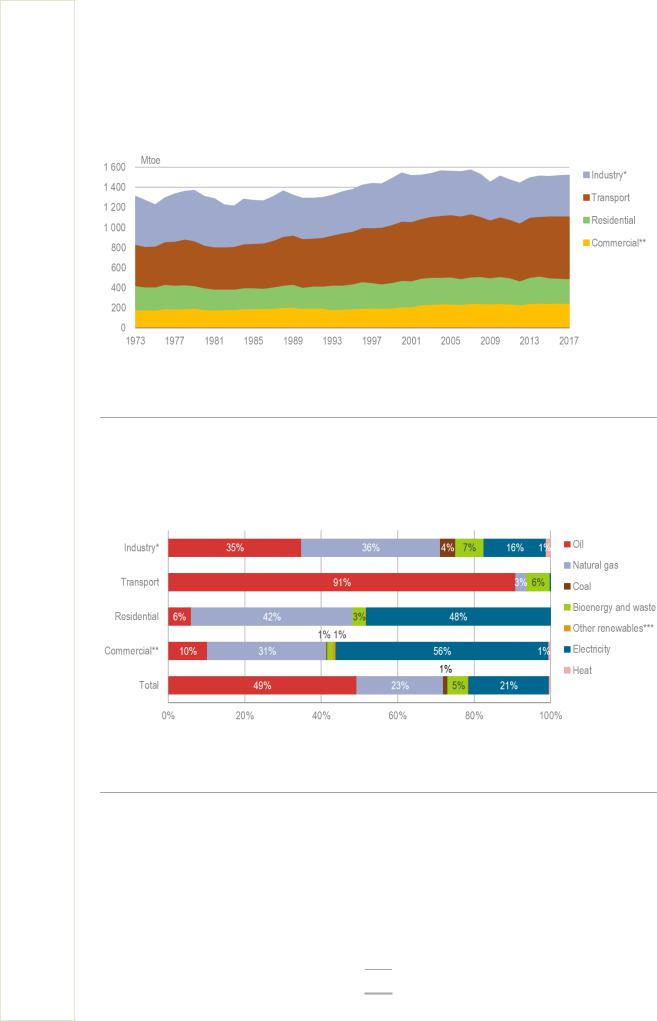
Energy consumption has been more stable than TPES and energy production, but with some fluctuations in recent years. TFC peaked in 2007 at 1 576 Mtoe, after which it fell during the years following the financial crisis, but picked up again in 2013. Since 2014, TFC has been rather stable at around 1 500 Mtoe (Figure 2.7).
The transport sector is the largest consumer of energy, representing 41% of TFC in 2017 (Figure 2.8). Most of this is oil products (mainly gasoline and diesel), although the country has a relatively high share of biofuels in transport (mainly ethanol, driven by the Renewable Fuel Standard (RFS) policy, as discussed in Chapter 5, “Renewable Energy”). The residential and commercial sectors together accounted for 32% of TFC, mostly
23
ENERGY INSIGHTS
IEA. All rights reserved.
2. GENERAL ENERGY POLICY
consuming electricity for appliances and natural gas for heating. The industry sector consumed the remaining 27%, including fuels used for non-energy purposes.
Figure 2.7 TFC by sector, 1973-2017
IEA (2019). All rights reserved.
Final energy consumption is relatively stable around 1 500 Mtoe, with the transport sector accounting for over 40% of total consumption.
*Industry includes non-energy consumption.
**Commercial includes commercial and public services, agriculture, and forestry. Source: IEA (2019), World Energy Balances 2019, www.iea.org/statistics/.
Figure 2.8 TFC by source and sector, 2017
IEA (2019). All rights reserved.
Oil accounts for nearly half of TFC in the United States, dominating the large transport sector, while electricity and natural gas account for the largest supply to buildings.
*Industry includes non-energy consumption.
**Commercial includes commercial and public services, agriculture, and forestry.
***Other renewables includes mainly geothermal and solar energy. Source: IEA (2019), World Energy Balances 2019, www.iea.org/statistics/.
24
IEA. All rights reserved.

2. GENERAL ENERGY POLICY
Energy trade
In line with rising oil and gas production domestically, the US energy trade balance has shifted dramatically over the past decade. Compared to the period 2003-07, when the value of energy imports was ten times that of exports, by 2017, the value of imports was just 1.5 times greater than exports, according to the US Census Bureau.
The top energy import for the United States is crude oil, which makes up around twothirds of the value of energy imports, followed by petroleum products, which account for roughly 20% of total energy imports by value.
Figure 2.9 US trade in crude oil and petroleum products, 2000-17
Million barrels |
|
|
|
|
|
|
|
|
|
|
|
|
|
|
|
|
|
|
|
|
|
|
|
|
|
|
|
|
|
|
|
|
|
|
|
|
|
|
|
|
|
|
|
|
|
|
|
|
|
|
|
||||||
6 000 |
|
|
|
|
|
|
|
|
|
|
|
|
|
|
|
|
|
|
|
|
|
|
|
|
|
|
|
|
|
|
|
|
|
|
|
|
|
|
|
|
|
|
|
|
|
|
|
|
|
|
|
|
|
|
|
|
Imports |
|
|
|
|
|
|
|
|
|
|
|
|
|
|
|
|
|
|
|
|
|
|
|
|
|
|
|
|
|
|
|
|
|
|
|
|
|
|
|
|
|
|
|
|
|
|
|
|
|
|
|
|
|
|
|
|
||
5 000 |
|
|
|
|
|
|
|
|
|
|
|
|
|
|
|
|
|
|
|
|
|
|
|
|
|
|
|
|
|
|
|
|
|
|
|
|
|
|
|
|
|
|
|
|
|
|
|
|
|
|
|
|
|
|
|
|
|
|
|
|
|
|
|
|
|
|
|
|
|
|
|
|
|
|
|
|
|
|
|
|
|
|
|
|
|
|
|
|
|
|
|
|
|
|
|
|
|
|
|
|
|
|
|
|
|
|
|
|
|
|
|
|
|
||
|
|
|
|
|
|
|
|
|
|
|
|
|
|
|
|
|
|
|
|
|
|
|
|
|
|
|
|
|
|
|
|
|
|
|
|
|
|
|
|
|
|
|
|
|
|
|
|
|
|
|
|
|
|
|
|
||
4 000 |
|
|
|
|
|
|
|
|
|
|
|
|
|
|
|
|
|
|
|
|
|
|
|
|
|
|
|
|
|
|
|
|
|
|
|
|
|
|
|
|
|
|
|
|
|
|
|
|
|
|
|
|
|
|
|
|
Exports |
|
|
|
|
|
|
|
|
|
|
|
|
|
|
|
|
|
|
|
|
|
|
|
|
|
|
|
|
|
|
|
|
|
|
|
|
|
|
|
|
|
|
|
|
|
|
|
|
|
|
|
|
|
|
|
|
||
|
|
|
|
|
|
|
|
|
|
|
|
|
|
|
|
|
|
|
|
|
|
|
|
|
|
|
|
|
|
|
|
|
|
|
|
|
|
|
|
|
|
|
|
|
|
|
|
|
|
|
|
|
|
||||
|
|
|
|
|
|
|
|
|
|
|
|
|
|
|
|
|
|
|
|
|
|
|
|
|
|
|
|
|
|
|
|
|
|
|
|
|
|
|
|
|
|
|
|
|
|
|
|
|
|
|
|
|
|
|
|
||
3 000 |
|
|
|
|
|
|
|
|
|
|
|
|
|
|
|
|
|
|
|
|
|
|
|
|
|
|
|
|
|
|
|
|
|
|
|
|
|
|
|
|
|
|
|
|
|
|
|
|
|
|
|
|
|
|
|
|
|
|
|
|
|
|
|
|
|
|
|
|
|
|
|
|
|
|
|
|
|
|
|
|
|
|
|
|
|
|
|
|
|
|
|
|
|
|
|
|
|
|
|
|
|
|
|
|
|
|
|
|
|
|
|
|
|
|
|
2 000 |
|
|
|
|
|
|
|
|
|
|
|
|
|
|
|
|
|
|
|
|
|
|
|
|
|
|
|
|
|
|
|
|
|
|
|
|
|
|
|
|
|
|
|
|
|
|
|
|
|
|
|
|
|
|
|
|
|
|
|
|
|
|
|
|
|
|
|
|
|
|
|
|
|
|
|
|
|
|
|
|
|
|
|
|
|
|
|
|
|
|
|
|
|
|
|
|
|
|
|
|
|
|
|
|
|
|
|
|
|
|
|
|
|
|
|
1 000 |
|
|
|
|
|
|
|
|
|
|
|
|
|
|
|
|
|
|
|
|
|
|
|
|
|
|
|
|
|
|
|
|
|
|
|
|
|
|
|
|
|
|
|
|
|
|
|
|
|
|
|
|
|
|
|
|
|
|
|
|
|
|
|
|
|
|
|
|
|
|
|
|
|
|
|
|
|
|
|
|
|
|
|
|
|
|
|
|
|
|
|
|
|
|
|
|
|
|
|
|
|
|
|
|
|
|
|
|
|
|
|
|
|
|
|
0 |
|
|
|
|
|
|
|
|
|
|
|
|
|
|
|
|
|
|
|
|
|
|
|
|
|
|
|
|
|
|
|
|
|
|
|
|
|
|
|
|
|
|
|
|
|
|
|
|
|
|
|
|
|
|
|
|
|
|
|
|
|
|
|
|
|
|
|
|
|
|
|
|
|
|
|
|
|
|
|
|
|
|
|
|
|
|
|
|
|
|
|
|
|
|
|
|
|
|
|
|
|
|
|
|
|
|
|
|
|
|
|
|
|
|
|
-1 000 |
|
|
|
|
|
|
|
|
|
|
|
|
|
|
|
|
|
|
|
|
|
|
|
|
|
|
|
|
|
|
|
|
|
|
|
|
|
|
|
|
|
|
|
|
|
|
|
|
|
|
|
|
|
|
|
|
|
|
|
|
|
|
|
|
|
|
|
|
|
|
|
|
|
|
|
|
|
|
|
|
|
|
|
|
|
|
|
|
|
|
|
|
|
|
|
|
|
|
|
|
|
|
|
|
|
|
|
|
|
|
|
|
|
|
|
-2 000 |
|
|
|
|
|
|
|
|
|
|
|
|
|
|
|
|
|
|
|
|
|
|
|
|
|
|
|
|
|
|
|
|
|
|
|
|
|
|
|
|
|
|
|
|
|
|
|
|
|
|
|
|
|
|
|
|
|
|
|
|
|
|
|
|
|
|
|
|
|
|
|
|
|
|
|
|
|
|
|
|
|
|
|
|
|
|
|
|
|
|
|
|
|
|
|
|
|
|
|
|
|
|
|
|
|
|
|
|
|
|
|
|
|
|
|
-3 000 |
|
|
|
|
|
|
|
|
|
|
|
|
|
|
|
|
|
|
|
|
|
|
|
|
|
|
|
|
|
|
|
|
|
|
|
|
|
|
|
|
|
|
|
|
|
|
|
|
|
|
|
|
|
|
|
|
|
|
|
|
|
|
|
|
|
|
|
|
|
|
|
|
|
|
|
|
|
|
|
|
|
|
|
|
|
|
|
|
|
|
|
|
|
|
|
|
|
|
|
|
|
|
|
|
|
|
|
|
|
|
|
|
|
|
|
2000 |
2001 |
2002 |
2003 |
2004 |
2005 |
2006 |
2007 |
2008 |
2009 |
2010 |
2011 |
2012 |
2013 |
2014 |
2015 |
2016 |
2017 |
|
|
|
|||||||||||||||||||||||||||||||||||||
IEA (2019). All rights reserved.
Growth in domestic production has reduced the US call on oil and petroleum product imports and increased export volumes.
Source: EIA (2018a), The Changing U.S. Energy Trade Balance is Still Dominated by Crude Oil Imports.
Notably, the United States is expected to turn from a net energy importer to a net exporter by 2020 as production growth of crude oil, natural gas and natural gas liquids exceeds consumption (EIA, 2019a). The last time the United States was a net energy exporter was 1953. The shift is due to the projected change in US status as a net petroleum products exporter starting in 2020. The United States has been a net exporter of natural gas since 2017.
The US energy structure should be considered in the context of the North American energy system, given a high degree of connectivity and cross-border trade and investment flows with Canada and Mexico. In 2017, Canada was the largest foreign supplier of crude oil to the United States, while Mexico was the fourth largest. Meanwhile, both countries are heavily reliant on petroleum product imports from the
United States. Overall, US energy trade within North America in |
2017 |
amounted to |
||||
USD 126 billion, |
of |
which USD 83 billion |
was spent on |
US energy |
imports and |
|
USD 43 billion |
on |
US energy exports. |
A considerable |
amount of |
cross-border |
|
infrastructure, including pipelines and transmission lines, support |
this trade, while a |
|||||
sizeable share is also transported by barge. |
|
|
|
|
||
25
ENERGY INSIGHTS
IEA. All rights reserved.