

книги студ / color atlas of physiology 5th ed[1]. (a. despopoulos et al, thieme 2003)
.pdf1 Fundamentals and Cell Physiology
38
Energy Production and Metabolism |
Heat is transferred in all chemical reactions. |
|||||||||
The amount of heat produced upon conversion |
||||||||||
|
|
|||||||||
Energy is the ability of a system to perform |
of a given substance into product X is the same, |
|||||||||
work; both are expressed in joules (J). A poten- |
regardless of the reaction pathway or whether |
|||||||||
tial difference (potential gradient) is the so- |
the system is closed or open, as in a biological |
|||||||||
called driving “force” that mobilizes the matter |
system. For caloric values, see p. 228. |
|
||||||||
involved in the work. Water falling from height |
Enthalpy change ( |
H) is the heat gained or |
||||||||
X (in meters) onto a power generator, for ex- |
lost by a system at constant pressure and is re- |
|||||||||
ample, represents the potential gradient in |
lated to work, pressure, and volume ( H = |
U |
||||||||
mechanical work. In electrical and chemical |
+ p ! V). Heat is lost and |
H is negative in ex- |
||||||||
work, potential gradients are provided respec- |
othermic reactions, while heat is gained and |
|||||||||
tively by voltage (V) and a change in free en- |
H is positive in endothermic reactions. The |
|||||||||
thalpy G (J ! mol– 1). The amount of work per- |
second law of thermodynamics states that the |
|||||||||
formed can be determined by multiplying the |
total disorder (randomness) or entropy (S) of a |
|||||||||
potential difference (intensity factor) by the |
closed system increases in any spontaneous |
|||||||||
corresponding capacity factor. In the case of |
process, |
i.e., |
entropy change |
( S) #0. This |
||||||
the water fall, the work equals the height the |
must be taken into consideration when at- |
|||||||||
water falls (m) times the force of the falling |
tempting to determine how much of H is |
|||||||||
water (in N). In the other examples, the |
freely available. This free energy or free en- |
|||||||||
amount work performed equals the voltage (V) |
thalpy ( |
G) can be used, for example, to drive a |
||||||||
times the amount of charge (C). Chemical work |
chemical reaction. The heat produced in the |
|||||||||
performed = G times the amount of sub- |
process is the product of absolute temperature |
|||||||||
stance (mol). |
|
and entropy change (T · |
S). |
|
|
|||||
Living organisms cannot survive without an |
Free enthalpy ( |
G) can be calculated using |
||||||||
adequate supply of energy. Plants utilize solar |
the Gibbs-Helmholtz equation: |
|
|
|||||||
energy to convert atmospheric CO2 into oxy- |
G ! |
H – T · |
S. |
|
|
[1.24] |
||||
gen and various organic compounds. These, in |
G and |
H are approximately equal when |
S |
|||||||
turn, are used to fill the energy needs of |
approaches zero. The maximum chemical |
|||||||||
humans and animals. This illustrates how |
work of glucose in the body can therefore be |
|||||||||
energy can be converted from one form into |
determined |
based |
on |
heat |
transfer, |
H, |
||||
another. If we consider such a transformation |
measured during the combustion of glucose in |
|||||||||
taking place in a closed system (exchange of |
a calorimeter (see p. 228 for caloric values). |
|||||||||
energy, but not of matter, with the environ- |
Equation 1.24 also defines the conditions |
|||||||||
ment), energy can neither appear nor disap- |
under which chemical reactions can occur. Ex- |
|||||||||
pear spontaneously. In other words, when |
ergonic reactions ( |
G $0) are characterized |
||||||||
energy is converted in a closed system, the |
by the release of energy and can proceed spon- |
|||||||||
total energy content remains constant. This is |
taneously, whereas endergonic reactions ( |
G |
||||||||
described in the first law of thermodynamics, |
#0) require the absorption of energy and are |
|||||||||
which states that the change of internal energy |
not spontaneous. An endothermic reaction |
|||||||||
(= change of energy content, |
U) of a system |
( H #0) can also be exergonic ( G $0) when |
||||||||
(e.g. of a chemical reaction) equals the sum of |
the entropy change |
S is so large that |
H– |
|||||||
the work absorbed (+W) or performed (–W) by |
T · S becomes negative. This occurs, for ex- |
|||||||||
a system and the heat lost (–Q) or gained (+Q) |
ample, in the endothermic dissolution of crys- |
|||||||||
by the system. This is described as: |
talline NaCl in water. |
|
|
|
|
|||||
U ! heat gained (Q) " work performed |
Free enthalpy, |
G, is a concentration-de- |
||||||||
(W) [J] and |
[1.22] |
pendent variable that can be calculated from |
||||||||
U ! work absorbed (W) " heat lost |
the change in standard free enthalpy ( G0) and |
|||||||||
(Q) [J]. |
[1.23] |
the prevailing concentrations of the sub- |
||||||||
(By definition, the signs indicate the direction |
stances in question. |
G0 is calculated assum- |
||||||||
of flow with respect to the system under con- |
ing for all reaction partners that concentration |
|||||||||
sideration.) |
|
= 1 mol/L, pH = 7.0, T = 298 K, and p = 1013 hPa. |
||||||||
!
Despopoulos, Color Atlas of Physiology © 2003 Thieme
All rights reserved. Usage subject to terms and conditions of license.

A. Activation energy (E a)
Energy required for reaction
to occur ( Pa)
Chemical potential
Pa´
Energy level of educt (Pe)
No  reaction
Educt A
Free enthalpy
G0=Pp– Pe
Transitional state F
Uncatalyzed activation energy
Ea= Pa– Pe
Catalyzed activation energy
Ea´= Pa´– Pe
Product B
Energy level of product (Pp)
Reaction pathway
Partly after J. Koolman and K.-H. Röhm ) |
Plate 1.19 Energy Production and Metabolism |
( |
|
|
|
|
|
|
|
|
B. Molecular fraction (F) when Pe > Pa |
|
|
|
|
|
|
|
C. Aerobic ATP production |
|
|
|
|
High-energy substrates:
55 |
|
|
|
|
|
|
Fats and |
|
|
|
|
|
|
|
carbohydrates |
|
|
) |
|
|
|
|
|
|
|
|
–1 |
|
|
|
|
|
|
|
|
(kJ·mol |
|
|
|
|
|
|
Krebs |
|
|
|
|
|
|
|
cycle |
|
|
Energy |
|
|
|
|
|
|
|
|
|
|
|
|
|
|
NADH |
|
|
|
|
|
|
|
|
|
|
|
50 |
|
Ea= Pa– Pe |
|
|
O2 |
e– |
|
|
|
|
|
Respiratory chain |
|
||||
|
|
|
37°C |
|
|
|
|
|
|
|
27°C |
|
|
|
|
|
|
|
17°C |
|
|
|
|
|
|
|
|
|
|
|
|
|
|
H+ |
|
|
|
|
|
|
|
|
H+ |
|
|
|
|
|
|
|
|
H+ |
|
45 |
|
|
|
|
|
|
H+ gradient |
|
0 1 2 |
4 |
6 |
8 |
10 |
CO2 |
H2O |
|
|
|
F (molecules/109 molecules) |
|
End products |
ATP |
39 |
|||
|
|
|
|
|
||||
|
|
(After J.Koolman and K.-H.Röhm) |
|
|
(see plate 1.8B) |
|
||
Despopoulos, Color Atlas of Physiology © 2003 Thieme
All rights reserved. Usage subject to terms and conditions of license.

|
|
! |
|
|
|
|
|
|
|
|
|
|
|
Given the reaction |
|
|
|
|
|
|
|||
|
|
A |
B + C, |
|
|
|
|
|
[1.25] |
||
|
|
where A is the educt and B and C are the prod- |
|||||||||
|
|
ucts, |
G0 is converted to |
G as follows: |
|
||||||
|
|
|
G ! G0 + R ! T ! ln [B] + [C] |
[1.26] |
|||||||
|
|
|
|
|
|
|
[A] |
|
|
|
|
|
|
or, at a temperature of 37 "C, |
|
|
|
||||||
|
|
|
G ! |
|
|
|
[B] + [C] |
|
|||
Physiology |
|
|
|
|
|
|
|
|
|||
|
|
G0 + 8.31 ! 310 ! 2.3 ! log |
|
[A] |
! [J ! mol–1] |
||||||
|
|
|
|
|
|
|
|
|
[1.27] |
||
|
|
|
|
|
|
|
|
|
|
||
|
|
Assuming the |
G0 of a reaction is + 20 kJ ! mol–1 |
||||||||
Cell |
|
(endergonic reaction), |
|
G will be exergonic |
|||||||
|
(# |
0) if [B] ! [C] is 104 times smaller than A: |
|
||||||||
|
|
|
|||||||||
and |
|
|
G ! 20000+5925!log10–4 |
! –3.7 kJ!mol–1. |
|||||||
|
|
|
|
|
|
|
|
|
[1.28] |
||
Fundamentals |
|
In this case, A is converted to B and C and reac- |
|||||||||
|
|
||||||||||
|
|
tion 1.25 proceeds to the right. |
|
|
|||||||
|
|
If |
[B] ! [C]/[A] = 4.2 |
$10– 4, |
G |
will equal |
|||||
|
|
zero and the reaction will come to equilibrium |
|||||||||
|
|
(no net reaction). This numeric ratio is called |
|||||||||
1 |
|
the equilibrium constant (Keq) of the reaction. |
|||||||||
|
Keq |
can be converted to |
|
G0 |
and vice versa |
||||||
|
|
using Equation 1.26: |
|
|
|
|
|
|
|||
|
|
0 ! G0 + R ! T ! lnKeq or |
|
|
|
|
|||||
|
|
|
G0 ! – R ! T ! lnKeq and |
|
|
[1.29] |
|||||
|
|
|
|
|
|||||||
|
|
Keq ! e– G"/(R ! T). |
|
|
|
|
[1.30] |
||||
|
|
Conversely, when [B] ! [C]/[A] %4.2 |
$10– 4, |
G |
|||||||
|
|
will be %0, the net reaction will proceed back- |
|||||||||
|
|
wards, and A will arise from B and C. |
|
||||||||
|
|
|
G is therefore a measure of the direction of |
||||||||
|
|
a reaction and of its distance from equilibrium. |
|||||||||
|
|
Considering the concentration-dependency of |
|||||||||
|
|
G and assuming the reaction took place in an |
|||||||||
|
|
open system (see below) where reaction prod- |
|||||||||
|
|
ucts are removed continuously, e.g., in sub- |
|||||||||
|
|
sequent metabolic reactions, it follows that |
G |
||||||||
|
|
would be a large negative value, and that the |
|||||||||
|
|
reaction would persist without reaching equi- |
|||||||||
|
|
librium. |
|
|
|
|
|
|
|
||
|
|
The magnitude of |
G0, which represents |
||||||||
|
|
the difference between the energy levels |
|||||||||
|
|
(chemical potentials) of the product Pp and |
|||||||||
|
|
educt Pe (!A), does not tell us anything about |
|||||||||
|
|
the rate of the reaction. A reaction may be very |
|||||||||
|
|
slow, even if |
G0 #0, because the reaction rate |
||||||||
|
|
also depends on the energy level (Pa) needed |
|||||||||
|
|
transiently to create the necessary transitional |
|||||||||
40 |
state. Pa is higher than Pe (!A). The additional |
|
amount of energy required to reach this level is |
||
|
called the activation energy (Ea) : Ea = Pa – Pe. It is usually so large (!50 kJ ! mol– 1) that only a tiny fraction (F !10– 9) of the educt molecules are able to provide it (!A, B). The energy levels of these individual educt molecules are incidentally higher than Pe, which represents the mean value for all educt molecules. The size of fraction F is temperature-dependent (!B). A 10 "C decrease or rise in temperature lowers or raises F (and usually the reaction rate) by a factor of 2 to 4, i.e. the Q10 value of the reaction is 2 to 4.
Considering the high Ea values of many noncatalyzed reactions, the development of enzymes as biological catalysts was a very important step in evolution. Enzymes enormously accelerate reaction rates by lowering the activation energy Ea (!A). According to the Arrhenius equation, the rate constant k (s– 1) of a unimolecular reaction is proportional to e–Ea/(R ! T). For example, if a given enzyme reduces the Ea of a unimolecular reaction from 126 to 63 kJ ! mol– 1, the rate constant at 310 "K
(37 "C) will rise by e– 63000/(8.31 ! 310)/e– 126000/(8.31 !
310), i.e., by a factor of 4 ! 1010. The enzyme would therefore reduce the time required to metabolize 50% of the starting materials (t1/2) from, say, 10 years to 7 msec! The forward rate of a reaction (mol ! L– 1 ! s– 1) is related to the product of the rate constant (s– 1) and the starting substrate concentration (mol ! L– 1).
The second law of thermodynamics also implies that a continuous loss of free energy occurs as the total disorder or entropy (S) of a closed system increases. A living organism represents an open system which, by definition, can absorb energy-rich nutrients and discharge end products of metabolism. While the entropy of a closed system (organism + environment) increases in the process, an open system (organism) can either maintain its entropy level or reduce it using free enthalpy. This occurs, for example, when ion gradients or hydraulic pressure differences are created within the body. A closed system therefore has a maximum entropy, is in a true state of chemical equilibrium, and can perform work only once. An open system such as the body can continuously perform work while producing only a minimum of entropy. A true state of equilibrium is achieved in only a very few
Despopoulos, Color Atlas of Physiology © 2003 Thieme
All rights reserved. Usage subject to terms and conditions of license.

processes within the body, e.g., in the reaction CO2 + H2O HCO3– + H+. In most cases (e.g. metabolic pathways, ion gradients), only a steady state is reached. Such metabolic pathways are usually irreversible due, for example, to excretion of the end products. The thought of reversing the “reaction” germ cell !adult illustrates just how impossible this is.
At steady state, the rate of a reaction is more important than its equilibrium. The regulation of body functions is achieved by controlling reaction rates. Some reactions are so slow that it is impossible to achieve a sufficient reaction rate with enzymes or by reducing the concentration of the reaction products. These are therefore endergonic reactions that require the input of outside energy. This can involve “activation” of the educt by attachment of a high-energy phosphate group to raise the Pe.
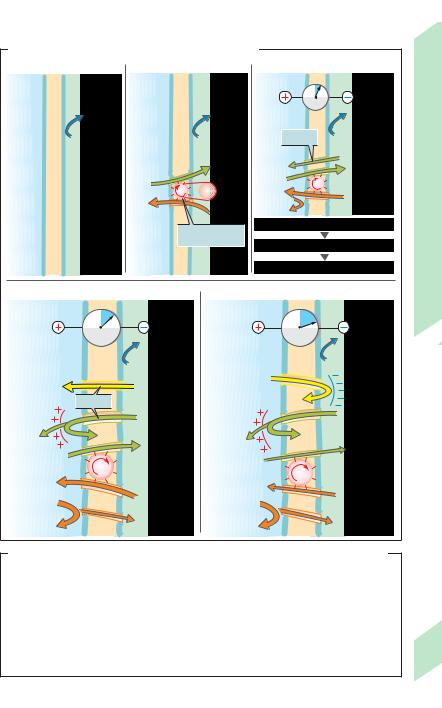
ATP (adenosine triphosphate) is the universal carrier and transformer of free enthalpy within the body. ATP is a nucleotide that derives its chemical energy from energy-rich nutrients (!C). Most ATP is produced by oxidation of energy-rich biological molecules such as glucose. In this case, oxidation means the removal of electrons from an electron-rich (reduced) donor which, in this case, is a carbohydrate. CO2 and H2O are the end products of the reaction. In the body, oxidation (or electron transfer) occurs in several stages, and a portion of the liberated energy can be simultaneously used for ATP synthesis. This is therefore a coupled reaction (!C and p. 17 B). The standard free enthalpy G0 of ATP hydrolysis,
ATP ADP + Pi [1.31] is – 30.5 kJ ! mol– 1. According to Eq. 1.27, the G of reaction 1.31 should increase when the ratio ([ADP] ! [Pi)]/[ATP] falls below the equilibrium constant Keq of ATP hydrolysis. The fact that a high cellular ATP concentration does indeed yield a G of approximately – 46 to
– 54 kJ ! mol– 1 shows that this also applies in practice.
Some substances have a much higher G0 of hydrolysis than ATP, e.g., creatine phosphate (– 43 kJ ! mol– 1). These compounds react with ADP and Pi to form ATP. On the other hand, the energy of ATP can be used to synthesize other compounds such as UTP, GTP and glucose-6- phosphate. The energy content of these sub-
stances is lower than that of ATP, but still relatively high.
The free energy liberated upon hydrolysis of ATP is used to drive hundreds of reactions within the body, including the active transmembrane transport of various substances, protein synthesis, and muscle contraction. According to the laws of thermodynamics, the expenditure of energy in all of these reactions leads to increased order in living cells and, thus, in the organism as a whole. Life is therefore characterized by the continuous reduction of entropy associated with a corresponding increase in entropy in the immediate environment and, ultimately, in the universe.
Energy Production and Metabolism
41
Despopoulos, Color Atlas of Physiology © 2003 Thieme
All rights reserved. Usage subject to terms and conditions of license.

2
42
Nerve and Muscle, Physical Work
Neuron Structure and Function
An excitable cell reacts to stimuli by altering its membrane characteristics (!p. 32). There are two types of excitable cells: nerve cells, which transmit and modify impulses within the nervous system, and muscle cells, which contract either in response to nerve stimuli or autonomously (!p. 59).
The human nervous system consists of more than 1010 nerve cells or neurons. The neuron is the structural and functional unit of the nervous system. A typical neuron (motor neuron, !A1) consists of the soma or cell body and two types of processes: the axon and dendrites. Apart from the usual intracellular organelles (!p. 8ff.), such as a nucleus and mitochondria (!A2), the neuron contains neurofibrils and neurotubules. The neuron receives afferent signals (excitatory and inhibitory) from a few to sometimes several thousands of other neurons via its dendrites (usually arborescent) and sums the signals along the cell membrane of the soma (summation). The axon arises from the axon hillock of the soma and is responsible for the transmission of efferent neural signals to nearby or distant effectors (muscle and glandular cells) and adjacent neurons. Axons often have branches (collaterals) that further divide and terminate in swellings called synaptic knobs or terminal buttons. If the summed value of potentials at the axon hillock exceeds a certain threshold, an action potential (!p. 46) is generated and sent down the axon, where it reaches the next synapse via the terminal buttons (!A1,3) described below.
Vesicles containing materials such as proteins, lipids, sugars, and transmitter substances are conveyed from the Golgi complex of the soma (!p. 13 F) to the terminal buttons and the tips of the dendrites by rapid axonal transport (40 cm/day). This type of anterograde transport along the neurotubules is promoted by kinesin, a myosin-like protein, and the energy required for it is supplied by ATP (!p. 16). Endogenous and exogenous substances such as nerve growth factor (NGF), herpes virus, poliomyelitis virus, and tetanus toxin are conveyed by retrograde transport from the peripheral regions to the soma at a
rate of ca. 25 cm/day. Slow axon transport (ca. 1 mm/day) plays a role in the regeneration of severed neurites.
Along the axon, the plasma membrane of the soma continues as the axolemma (!A1,2). The axolemma is surrounded by oligodendrocytes (!p. 338) in the central nervous system (CNS), and by Schwann cells in the peripheral nervous system (!A1,2). A nerve fiber consists of an axon plus its sheath. In some neurons, Schwann cells form multiple concentric double phospholipid layers around an axon, comprising the myelin sheath (!A1,2) that insulates the axon from ion currents. The sheath is interrupted every 1.5 mm or so at the nodes of Ranvier (!A1). The conduction velocity of myelinated nerve fibers is much higher than that of unmyelinated nerve fibers and increases with the diameter of the nerve fiber (!p. 49 C).
A synapse (!A3) is the site where the axon of a neuron communicates with effectors or other neurons (see also p. 50 ff.). With very few exceptions, synaptic transmissions in mammals are mediated by chemicals, not by electrical signals. In response to an electrical signal in the axon, vesicles (!p. 1.6) on the presynaptic membrane release transmitter substances (neurotransmitters) by exocytosis (!p. 30). The transmitter diffuses across the synaptic cleft (10–40 nm) to the postsynaptic membrane, where it binds to receptors effecting new electrical changes (!A3). Depending on the type of neurotransmitter and postsynaptic receptor involved, the transmitter will either have an excitatory effect (e.g., acetylcholine in skeletal muscle) or inhibitory effect (e.g., glycine in the CNS) on the postsynaptic membrane. Since the postsynaptic membrane normally does not release neurotransmitters (with only few exceptions), nerve impulses can pass the synapse in one direction only. The synapse therefore acts like a valve that ensures the orderly transmission of signals. Synapses are also the sites at which neuronal signal transmissions can be modified by other (excitatory or inhibitory) neurons.
Despopoulos, Color Atlas of Physiology © 2003 Thieme
All rights reserved. Usage subject to terms and conditions of license.

A. Nerve cell structure and function
1 Neuron and |
2 Myelinated and unmyelinated nerve fibers |
|
Unmyelinated fibers |
||
synapse |
||
|
Dendrites
Soma
Axon hillock
Mitochondria
Axon (neurite) |
Schwann |
|
cells |
Axolemma |
|
Endoneurium |
|
|
Myelinated |
|
fibers |
Nodes |
Myelin |
sheath |
|
of Ranvier |
|
Electron microscopic view,
1 : 22000 magnification.
Photograph courtesy of Dr. Lauren A. Langford
Nucleus of
a Schwann cell
Plate 2.1 Neuron Structure and Function
Collaterals |
Presynaptic ending |
|
|
|
(terminal |
|
3 Synapse (diagram) |
|
button) |
Electrical |
|
|
|
transmission |
|
|
|
|
Presynaptic |
|
|
Chemical |
membrane |
|
|
|
|
|
|
transmission |
Synaptic |
|
|
(neurotransmitter) |
|
|
|
cleft |
|
|
|
|
|
|
|
Electrical |
Postsynaptic |
|
|
transmission |
membrane |
|
|
|
43 |
Despopoulos, Color Atlas of Physiology © 2003 Thieme
All rights reserved. Usage subject to terms and conditions of license.

Resting Membrane Potential
|
An electrical potential difference, or mem- |
||
|
brane potential (Em), can be recorded across |
||
|
the plasma membrane of living cells. The |
||
|
potential of unstimulated muscle and nerve |
||
|
cells, or resting potential, amounts to – 50 to |
||
|
– 100 mV (cell interior is negative). A resting |
||
Work |
potential is caused by a slightly unbalanced |
||
distribution of ions between the intracellular |
|||
|
|||
Physical |
fluid (ICF) and extracellular fluid (ECF) (!B). |
||
Maintenance of an unequal distribution of |
|||
|
The following factors are involved in establish- |
||
|
ing the membrane potential (see also p. 32ff.). |
||
Muscle, |
ions: The Na+-K+-ATPase (!p. 26) continu- |
||
ously “pumps” Na+ out of the cell and K+ into it |
|||
|
|||
|
(!A2). As a result, the intracellular K+ concen- |
||
and |
tration is around 35 times higher and the intra- |
||
cellular Na+ concentration is roughly 20 times |
|||
Nerve |
lower than the extracellular concentration |
||
(!B). As in any active transport, this process |
|||
|
|||
2 |
requires energy, which is supplied by ATP. Lack |
||
of energy or inhibition of the Na+-K+-ATPase |
|||
|
|||
|
results in flattening of the ion gradient and |
||
|
breakdown of the membrane potential. |
||
|
Because anionic proteins and phosphates present in |
||
|
high concentrations in the cytosol are virtually un- |
||
|
able to leave the cell, purely passive mechanisms |
||
|
(Gibbs–Donnan distribution) could, to a slight extent, |
||
|
contribute to the unequal distribution of diffusable |
||
|
ions (!A1). For reasons of |
electroneutrality, |
|
|
[K++Na+]ICF ! [K++Na+]ECF and |
[Cl–]ICF " [Cl–]ECF. |
|
|
However, this has practically no effect on the |
||
|
development of resting potentials. |
||
|
Low resting Na+ and Ca2+ conductance, gNa, |
||
|
gCa: The membrane of a resting cell is only very |
||
|
slightly permeable to Na+ and Ca2+, and the |
||
|
resting gNa comprises only a small percentage |
||
|
of the total conductance (!p. 32 ff.). Hence, |
||
|
the Na+ concentration difference (!A3–A5) |
||
|
cannot be eliminated by immediate passive |
||
|
diffusion of Na+ back into the cell. |
||
|
High K+conductance, gK: It is relatively easy |
||
|
for K+ ions to diffuse across the cell membrane |
||
|
(gK !90% of total conductance; !p. 32ff.). Be- |
||
|
cause of the steep concentration gradient |
||
|
(!point 1), K+ ions diffuse from the ICF to the |
||
|
ECF (!A3). Because of their positive charge, |
||
|
the diffusion of even small amounts of K+ ions |
||
44 |
leads to an electrical potential (diffusion poten- |
||
|
tial) across the membrane. This (inside nega- |
||
tive) diffusion potential drives K+ back into the cell and rises until large enough to almost completely compensate for the K+ concentration gradient driving the K+-ions out of the cell (!A4). As a result, the membrane potential, Em, is approximately equal to the K+ equilibrium potential EK (!p. 32).
Cl– distribution: Since the cell membrane is also conductive to Cl– (gCl greater in muscle cells than in nerve cells), the membrane potential (electrical driving “force”) expels Cl– ions from the cell (!A4) until the Cl– concentration gradient (chemical driving “force”) drives them back into the cell at the same rate. The in-
tracellular Cl– concentration, [Cl–]i, then continues to rise until the Cl– equilibrium potential equals Em (!A5). [Cl–]i can be calculated using the Nernst equation (!p. 32, Eq. 1.18). Such a “passive” distribution of Cl– between the intraand extracellular spaces exists only as long as there is no active Cl– uptake into the cell (!p. 34).
Why is Em less negative than EK? Although the conductances of Na+ and Ca2+ are very low in resting cells, a few Na+ and Ca2+ ions constantly enter the cell (!A4, 5 ). This occurs because the equilibrium potential for both types of ions extends far into the positive range, resulting in a high outside-to-inside electrical and chemical driving “force” for these ions (!B; !p. 32f.). This cation influx depolarizes the cell, thereby driving K+ ions out of the cell (1 K+ for each positive charge that enters). If Na+-K+-ATPase did not restore these gradients continuously (Ca2+ indirectly via the 3 Na+/Ca2+ exchanger; !p. 36), the intracellular Na+ and Ca2+ concentrations would increase continuously, whereas [K+]i would decrease, and EK and Em would become less negative.
All living cells have a (resting) membrane potential, but only excitable cells such as nerve and muscle cells are able to greatly change the ion conductance of their membrane in response to a stimulus, as in an action potential (!p. 46).
Despopoulos, Color Atlas of Physiology © 2003 Thieme
All rights reserved. Usage subject to terms and conditions of license.
A. Causes and effects of resting membrane potentials |
|
|
|
|
|
||||||||
1 Passive ion distribution |
2 Active Na+-K+-pump |
|
3 K+ diffusion potential |
|
|
||||||||
ECF |
|
ICF |
ECF |
ICF |
|
ECF |
0 |
ICF |
|
|
|||
|
|
|
|
|
|||||||||
|
|
|
|
|
|
|
|
|
mV |
|
|
|
|
Membrane |
Proteins– |
– |
|
Proteins– |
– |
|
Passive |
Proteins– |
– |
Potential |
|||
Phosphates |
|
Phosphates |
|
|
Phosphates |
||||||||
|
|
|
|
|
|
|
|
|
|||||
|
|
|
K |
+ |
|
|
|
K+ |
|
||||
CI– |
|
CI– |
|
|
|
|
K+ |
|
|
|
Membrane |
||
|
K+ |
|
|
|
|
|
|
|
|||||
|
|
|
|
ATP |
|
|
Na+ |
|
|
|
|||
K+ |
|
K+ |
|
|
|
|
|
+ |
|
||||
|
Na+ |
|
|
|
|
|
Na |
|
|||||
|
|
|
|
+ |
|
|
|
|
|
||||
|
|
|
|
|
Na |
|
K+ chemical gradient rises |
|
|||||
Na+ |
|
Na+ |
|
|
Active transport |
|
|
Resting |
|||||
|
|
|
|
|
via ATPase |
|
K+ diffuses from ICF to ECF |
|
|||||
|
|
|
|
|
|
|
|
|
|||||
|
|
|
|
|
|
|
|
|
Potential develops |
|
|||
|
|
|
|
|
|
|
|
|
|
2.2 |
|||
4 Potential drives CI– from ICF to ECF |
5 End state: Resting membrane potential |
||||||||||||
Plate |
|||||||||||||
ECF |
|
0 |
|
ICF |
|
ECF |
|
0 |
ICF |
|
|||
|
|
|
|
|
|
|
|||||||
|
|
|
|
|
|
|
|
||||||
|
|
mV |
|
|
|
|
|
|
mV |
|
|
|
|
|
|
|
Proteins– |
|
|
|
|
|
Proteins– |
– |
|
||
|
|
|
|
– |
|
|
|
|
|
Phosphates |
|
|
|
|
|
|
Phosphates |
|
|
CI– |
|
|
|
|
|
||
CI |
– |
|
CI |
– |
|
|
|
|
CI– |
|
|
||
|
Passive |
|
|
|
|
|
|
|
|
||||
|
|
|
|
|
|
|
|
|
|
|
|
||
|
|
|
K+ |
|
|
|
|
|
K+ |
|
|
||
K+ |
|
|
|
|
|
|
K+ |
|
|
|
|
|
|
Na+ |
|
|
|
|
|
|
Na+ |
|
|
|
|
|
|
|
|
|
Na+ |
|
|
|
|
|
Na+ |
|
|
||
B.Typical “effective” concentrations and equilibrium potentials of important ions in skeletal muscle (at 37°C)
|
|
“Effective” concentration (mmol/kg H2O) |
|
Equilibrium |
||
|
|
|
|
|
|
potential |
|
|
Interstice (ECF) |
|
Cell (ICF) |
||
|
|
|
|
|
|
|
K+ |
|
4.5 |
|
160 |
|
– 95mV |
Na+ |
|
144 |
|
7 |
|
+ 80mV |
Ca2+ |
|
1.3 |
|
0.0001– 0.00001 |
|
+125 to +310mV |
H+ |
|
4·10–5 (pH 7.4) |
|
10–4 (pH 7.0) |
|
– 24mV |
CI– |
|
114 |
|
7 |
|
– 80mV |
HCO3– |
|
28 |
|
10 |
|
– 27mV |
(After Conway)
45
Despopoulos, Color Atlas of Physiology © 2003 Thieme
All rights reserved. Usage subject to terms and conditions of license.

2 Nerve and Muscle, Physical Work
46
Action Potential
An action potential is a signal passed on through an axon or along a muscle fiber that influences other neurons or induces muscle contraction. Excitation of a neuron occurs if the membrane potential, Em, on the axon hillock of a motor neuron, for example (!p. 42), or on the motor end-plate of a muscle fiber changes from its resting value (!p. 44) to a less negative value (slow depolarization, !A1). This depolarization may be caused by neu- rotransmitter-induced opening of postsynaptic cation channels (!p. 50) or by the (electrotonic) transmission of stimuli from the surroundings (!p. 48). If the Em of a stimulated cell comes close to a critical voltage or threshold potential (!A1), “rapid” voltage-gated Na+ channels are activated (!B4 and B1 ! B2). This results in increased Na+ conductance, gNa
(!p. 32), and the entry of Na+ into the cell (!A2). If the threshold potential is not reached, this process remains a local (subthreshold) response.
Once the threshold potential is reached, the cell responds with a fast all-or-none depolarization called an action potential, AP (!A1). The AP follows a pattern typical of the specific cell type, irregardless of the magnitude of the stimulus that generated it. Large numbers of Na+ channels are activated, and the influxing Na+ accelerates depolarization which, in turn, increases gNa and so on (positive feedback). As a result, the Em rapidly collapses (0.1 ms in nerve cells: fast depolarization phase or upsweep) and temporarily reaches positive levels (overshooting, + 20 to + 30 mV). The gNa drops before overshooting occurs (!A2) because the Na+ channels are inactivated within 0.1 ms (!B2 ! B3). The potential therefore reverses, and restoration of the resting potential, the repolarization phase of the action potential, begins. Depolarization increases (relatively slowly) the open-probability of voltage-gated K+ channels. This increases the potassium conductance, gK, thereby accelerating repolarization.
In many cases, potassium conductance, gK is still increased after the original resting potential has been restored (!A2), and Em temporarily approaches EK (!pp. 44 and 32 ff.),
resulting in a hyperpolarizing afterpotential (!A1). Increased Na+-K+-ATPase pumping rates (electrogenic; !p. 28) can contribute to this afterpotential.
Very long trains of action potentials can be generated (up to 1000/s in some nerves) since the quantity of ions penetrating the membrane is very small (only ca. 1/100 000 th the number of intracellular ions). Moreover, the Na+-K+-ATPase (!p. 26) ensures the continuous restoration of original ion concentrations (!p. 46).
During an action potential, the cell remains unresponsive to further stimuli; this is called the refractory period. In the absolute refractory period, no other action potential can be triggered, even by extremely strong stimuli, since Na+ channels in depolarized membranes cannot be activated (!B3). This is followed by a relative refractory period during which only action potentials of smaller amplitudes and rates of rise can be generated, even by strong stimuli. The refractory period ends once the membrane potential returns to its resting value (!e.g. p. 59 A).
The extent to which Na+ channels can be activated and, thus, the strength of the Na+ current, INa, depends on the pre-excitatory resting potential, not the duration of depolarization. The activation of the Na+ channels reaches a maximum at resting potentials of ca. – 100 mV and is around 40% lower at – 60 mV. In mammals, Na+ channels can no longer be activated at potentials of –50 mV and less negative values (!B3). This is the reason for the absolute and relative refractory periods (see above) and the non-excitability of cells after the administration of continuously depolarizing substances such as suxamethonium (!p. 56). An increased extracellular Ca2+ concentration makes it more difficult to stimulate the cell because the threshold potential becomes less negative. On the other hand, excitability increases (lower threshold) in hypocalcemic states, as in muscle spasms in tetany (!p. 290).
The special features of action potentials in cardiac and smooth muscle fibers are described on pages 192, 70 and 59 A.
Despopoulos, Color Atlas of Physiology © 2003 Thieme
All rights reserved. Usage subject to terms and conditions of license.

A. Action potential (1) and ion conductivity (2) (nerve and skeletal muscle)
1 |
|
|
|
|
2 |
|
|
|
|
+ |
“Overshoot” |
|
|
|
|
|
+ |
|
0 |
(20–30mV) |
|
|
|
|
|
0 |
|
|
|
|
|
|
|
||
|
– |
|
Repol |
|
|
|
Action |
– |
|
(mV) |
|
|
g |
potential |
|
||
|
potentialE |
|
arization |
|
conductance |
|
(mV) |
|
|
m |
tion |
|
|
|
|
gNa |
|
|
|
|
Action |
|
|
|
|
|
|
|
ariza |
|
potential |
|
|
|
|
|
|
|
|
|
|
|
|
|
|
Membrane |
pol |
|
|
Ion |
gK |
E |
|
|
|
De |
|
|
|
|
|
m |
|
|
|
After-hyper- |
|
|
|
|
|
|
|
Threshold |
|
|
|
|
|
|
|
|
|
polarization |
|
|
|
|
|
potential |
–90mV)to |
|
|
|
|
|
|
|
|
|
|
Resting |
|
|
|
||
|
|
|
|
|
|
|
|
|
|
|
Pre- |
|
|
GK |
|
|
|
|
|
depolari- |
|
|
Resting |
|
|
|
Resting |
(ca.–70 |
sation |
|
|
0 |
ca. 1ms |
|
|
ca. 1ms |
Time |
GNa |
|
|||||
|
|
|
|
|
|
Time |
|
|
B. Voltage-gated Na+ channel |
|
|
|
|
|||
1. Closed, |
|
|
[mV] |
|
|
|
|
activatable |
|
+ |
|
Depolarization |
|
|
|
|
|
|
|
|
|
||
|
|
0 |
|
|
|
|
|
|
|
|
|
|
|
|
|
|
|
– |
–90 mV |
|
|
|
|
|
|
|
|
|
[mV] |
|
|
|
|
|
|
|
|
|
|
|
|
|
Resting potential |
Na+ |
|
+ |
|
|
|
|
|
2. Open |
|
0 |
|
|
|
|
|
|
– |
|
|
|
Na+ channel |
|
|
Depolarization |
|||
|
|
|
Tetrodotoxin |
|
|
(first 0.5ms) |
|
|
|
|
|
|
|
|
|
Complete |
|
|
|
|
|
|
|
repolarization |
|
Veratridine |
|
|
|
|
|
|
|
|
|
|
|
Tetrodotoxin |
|
|
|
|
Batrachotoxin |
4 |
Na+ |
||
|
|
|
|
|
(TTX) |
||
|
|
|
[mV] |
|
|
|
Out |
3. Closed,
inactivated +
0
–
Reversal of potential and start of repolarization
In
Despopoulos, Color Atlas of Physiology © 2003 Thieme
All rights reserved. Usage subject to terms and conditions of license.
Plate 2.3 Action Potential
47