

книги студ / color atlas of physiology 5th ed[1]. (a. despopoulos et al, thieme 2003)
.pdf5 Respiration
128
Binding and Transport of O2 in Blood
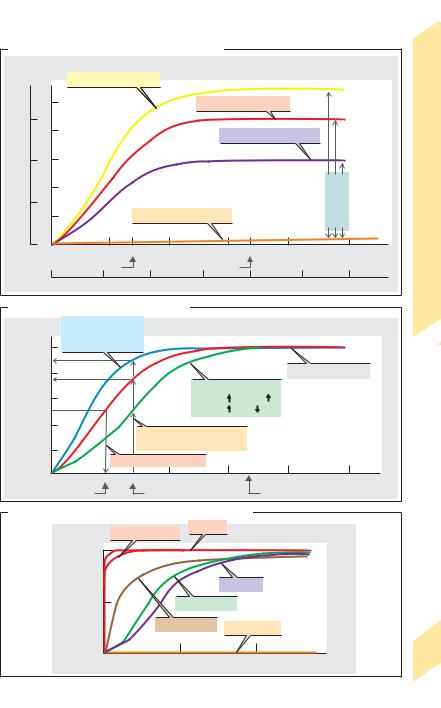
Hemoglobin (Hb) is the O2-carrying protein of red blood cells (RBCs) (mol. mass: 64 500 Da). Hb is also involved in CO2 transport and is an important blood pH buffer (!pp. 124 and 138ff.). Hb is a tetramer with 4 subunits (adults: 98%: 2α + 2" = HbA; 2% 2α + 2δ = HbA2), each with its own heme group. Heme consists of porphyrin and Fe(II). Each of the four Fe(II) atoms (each linked with one histidine residue of Hb) binds reversibly with an O2 molecule. This is referred to as oxygenation (not oxidation) of Hb to oxyhemoglobin (OxyHb). The amount of O2 which combines with Hb depends on the partial pressure of O2 (PO2): oxygen dissociation curve (!A, red line). The curve has a sigmoid shape, because initially bound O2 molecules change the conformation of the Hb tetramer (positive cooperativity) and thereby increase hemoglobin-O2 affinity.
When fully saturated with O2, 1 mol of tetrameric Hb combines with 4 mol O2, i.e., 64 500 g of Hb combine with 4 !22.4 L of O2. Thus, 1 g Hb can theoretically transport 1.39 mL O2, or 1.35 mL in vivo (Hüfner number). The total Hb concentration of the blood
([Hb]total) is a mean 150 g/L (!p. 88), corresponding to a maximum O2 concentration of
9.1 mmol/L or an O2 fraction of 0.203 L O2/L blood. This oxygen-carrying capacity is a func-
tion of [Hb]total (!A, yellow and purple curves as compared to the red curve).
The O2 content of blood is virtually equivalent to the amount of O2 bound by Hb since only 1.4% of O2 in blood is dissolved at a PO2 of 13.3 kPa (!A, orange line). The solubility coefficient (αO2), which is 10 µmol ! [L of plasma]– 1 ! kPa– 1, is 22 times smaller
than αCO2 (!p. 126).
Oxygen saturation (SO2) is the fraction of Oxy-Hb relative to [Hb]total, or the ratio of actual O2 concentration/ O2-carrying capacity. At normal PO2 in arterial blood (e.g., PaO2 = 12.6 kPa or 95 mmHg), SO2 will reach a saturation plateau at approx. 0.97, while SO2 will still amount to 0.73 in mixed venous blood (PVO2 = 5.33 kPa or 40 mmHg). The venous SO2 values in different organs can vary greatly (!p. 130).
O2 dissociation is independent of total Hb if plotted as a function of SO2 (!B). Changes in O2 affinity to Hb can then be easily identified as shifting of the O2 dissociation curve. A shift to
the right signifies an affinity decrease, and a shift to the left signifies an affinity increase, resulting in flattening and steepening, respectively, of the initial part of the curve. Shifts to the left are caused by increases in pH (with or without a PCO2 decrease) and/or decreases in PCO2, temperature and 2,3-bisphosphoglyc- erate (BPG; normally 1 mol/mol Hb tetramer). Shifts to the right occur due to decreases in pH and/or increases in PCO2, temperature and 2,3- BPG (!B). The half-saturation pressure (P0.5 or
P50) of O2 (!B, dotted lines) is the PO2 at which SO2 is 0.5 or 50%. The P0.5, which is normally 3.6 kPa or 27 mmHg, is a measure of shifting to
the right (P0.5") or left (P0.5#). Displacement of the O2 dissociation curve due to changes in pH and PCO2 is called the Bohr effect. A shift to the right means that, in the periphery (pH#, PCO2"), larger quantities of O2 can be absorbed from the blood without decreasing the PO2, which is the driving force for O2 diffusion (!B, broken lines). A higher affinity for O2 is then re-established in the pulmonary capillaries (pH", PCO2#). A shift to the left is useful when the PAO2 is decreased (e.g., in altitude hypoxia), a situation where arterial SO2 lies to the left of the SO2 plateau.
Myoglobin is an Fe(II)-containing muscle protein that serves as a short-term storage molecule for O2 (!p. 72). As it is monomeric (no positive cooperativity), its O2 dissociation curve at low PO2 is much steeper than that of HbA (!C). Since the O2 dissociation curve of fetal Hb (2α + 2γ = HbF) is also steeper, SO2 values of 45 to 70% can be reached in the fetal umbilical vein despite the low PO2 (3–4 kPa or 22–30 mmHg) of maternal placental blood. This is sufficient, because the fetal [Hb]total is 180 g/L. The carbon monoxide (CO) dissociation curve is extremely steep. Therefore, even tiny amounts of CO in the respiratory air will dissociate O2 from Hb. This can result in carbon monoxide poisoning (!C). Methemoglobin, Met-Hb (normally 1% of Hb), is formed from Hb by oxidation of Fe(II) to Fe(III) either spontaneously or via exogenous oxidants. Met-Hb cannot combine with O2 (!C). Methemoglobin reductase reduces Fe(III) of Met-Hb back to Fe(II); deficiencies of this enzyme can cause methemoglobinemia, resulting in neonatal anoxia.
Despopoulos, Color Atlas of Physiology © 2003 Thieme
All rights reserved. Usage subject to terms and conditions of license.
A. O2 dissociation curve: O2-carrying capacity
[HbO2] [O2] |
|
|
|
|
|
|
|
|
|||
in blood |
|
Increased O2 capacity |
|
|
|
|
|
Blood |
|||
|
|
|
|
|
|
|
Hb=180g/L |
||||
|
|
|
|
|
|
|
|
|
|||
|
10 |
|
|
|
|
Normal O2 capacity |
|
|
|
||
150 |
|
|
|
|
|
|
|
|
Hb=150g/L |
in |
|
|
|
|
|
|
|
|
|
2 |
|||
|
|
8 |
|
|
|
|
|
|
|
|
|
g/L |
mmol/L |
|
|
|
|
Reduced O2 capacity |
|
|
Transport of O |
||
|
|
|
|
|
|
|
|||||
|
|
|
|
|
|
|
|
|
|||
100 |
6 |
|
|
|
|
|
|
Hb=100g/L |
|||
|
4 |
|
|
|
|
|
|
capacity |
|
||
50 |
|
|
|
|
|
|
|
|
|||
|
|
|
|
|
|
|
|
|
|||
|
|
2 |
|
|
|
Dissolved O2 |
|
|
2 |
|
Bindingand |
|
|
|
|
|
|
|
|
|
|||
0 |
|
0 |
0 |
4 |
5.33 |
8 |
12 |
16 |
20 |
kPa |
|
|
|
|
|
|
|
|
|
|
O |
|
|
|
|
|
|
Mixed venous |
|
|
Arterial |
|
PO2 |
|
5.12 |
|
|
|
0 |
|
50 |
|
100 |
|
150 mmHg |
||
B. O2 dissociation curve: O2 saturation |
|
|
|
|
Plate |
||||||
Shift to left
CO2 Temp.
Temp.
1.0DPG  pH
pH 
O |
|
|
Saturation plateau |
2 |
0.8 |
|
|
S |
|
|
|
saturation, |
0.6 |
Shift to right |
|
|
|||
|
CO2 |
Temp. |
|
|
0.5 |
DPG |
pH |
2 |
0.4 |
|
|
O |
|
Variable saturation |
|
|
|
|
|
|
0.2 |
at same PO2 |
|
|
O2 half-saturation pressure |
|
|
|
|
|
|
00 |
|
3.6 |
5.33 |
8 |
|
|
12 |
|
16 |
20 |
kPa |
|
|
P0.5 |
|
|
Mixed venous |
|
|
Arterial |
PO2 |
|
|||
|
|
|
|
|
|
|
||||||
C. O2 and carbon monoxide (CO) dissociation curves |
|
|
|
|||||||||
|
|
|
|
At PO2= 13.3kPa |
|
CO-Hb |
|
|
|
|
|
|
|
|
|
|
|
|
|
|
|
|
|
||
|
|
1.0 |
|
|
|
|
|
|
|
|
|
|
|
Saturation |
|
|
|
|
|
|
Hb-O2 |
|
|
|
|
|
0.5 |
|
|
|
|
Fetal Hb-O2 |
|
|
|
|
||
|
|
|
|
|
|
|
|
|
|
|
|
|
|
|
|
|
|
O2-myoglobin |
O2 |
-Met-Hb |
|
|
|||
|
|
|
|
|
|
|
|
|
|
|||
|
|
0 |
0 |
|
|
5 |
PO2 and PCO |
10 |
kPa |
|
129 |
|
|
|
|
|
|
|
|
||||||
|
|
|
|
|
|
|
|
|
|
|
||
Despopoulos, Color Atlas of Physiology © 2003 Thieme
All rights reserved. Usage subject to terms and conditions of license.

5 Respiration
130
Internal (Tissue) Respiration, Hypoxia
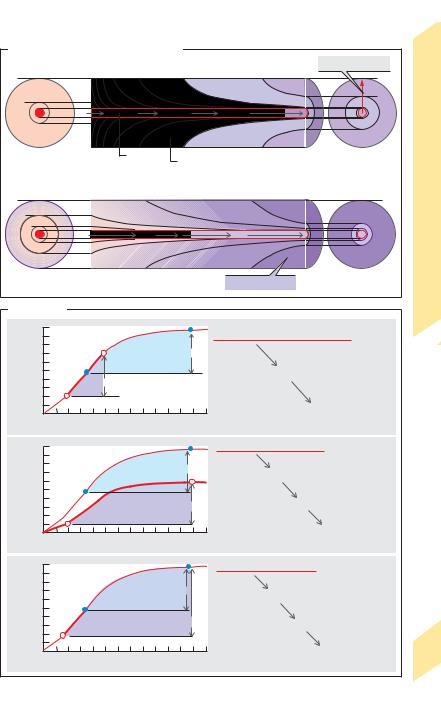
O2 diffuses from peripheral blood to adjacent tissues and CO2 in the opposite direction (!pp. 20ff. and 106). Since CO2 diffuses much faster (!p. 120), O2 diffusion is the limiting factor. Sufficient O2 delivery is ensured by a dense capillary network with a gas exchange area of about 1000 m2. The diffusion distance
(!R in A) is only 10–25 µm. The driving force for diffusion is the difference in partial pressures of oxygen ( PO2) in capillary blood and mitochondria, where the PO2 must not fall below 0.1 kPa !1 mmHg. Since PO2 decreases with distance parallel and perpendicular to the course of capillaries, the O2 supply to cells at the venous end far away from the capillaries (large R) is lowest, as shown using Krogh’s cylinder model (!A1). Since these cells are also the first to be affected by oxygen deficiency (hypoxia), this is sometimes called the “lethal corner” (!A2).
Using Fick’s principle (!p. . 106), oxygen consumption of a given organ, VO2 (in L/min), is calculated as.the difference between the arterial supply (Q ! [O2.]a) and non-utilized. venous O2 volume/time (Q ! [O2]v), where Q is rate of blood flow in the organ (L/min) and [O2] is the
oxygen fraction (L O2/L blood): |
|
|
|
. |
. |
|
[5.7] |
VO2 |
! Q ([O2]a – [O2]v) |
. |
|
To meet increased O2 demands, Q can therefore be increased by vasodilatation in the organ in question and/or by raising the oxygen extrac-
tion (EO2). EO2.describes the O2 consumption in |
|
the organ (= Q ([O2]a – [O2]v); |
.see Eq. 5.7) rela.- |
tive to the arterial O2 supply (Q ! [O2]a). Since Q |
|
can be simplified, |
|
EO2 ! ([O2]a – [O2]v)/ [O2]a |
[5.8] |
EO2 varies according to the type and function of the organ under resting conditions: skin 0.04 (4%), kidney 0.07; brain, liver and resting skeletal muscle ca. 0.3, myocardium 0.6. The EO2 of muscle during strenuous exercise can rise to 0.9. Skeletal muscle can therefore meet increased O2 demands by raising the EO2 (0.3 0.9), as can myocardial tissue to a much smaller extent (!p. 210).
Hypoxia. An abnormally reduced O2 supply to tissue is classified as follows:
1. Hypoxic hypoxia (!A2, B1): an insufficient O2 supply reaches the blood due, for ex-
ample, to decreased atmospheric PO2 at high altitudes (!p. 136), reduced alveolar ventilation, or impaired alveolar gas exchange.
2.Anemic hypoxia (!B2): reduced O2-car- rying capacity of blood (!p. 128), e.g., due to decreased total Hb in iron deficiency anemia (!p. 90).
3.Stagnant or ischemic hypoxia (!B3): in-
sufficient O2 reaches. the tissue due to reduced blood flow (Q"). The cause can be systemic (e.g., heart failure) or local (e.g., obstructed artery). The reduction of blood flow must be
compensated for by a rise in EO2 to maintain an adequate O2 delivery (see Eq. 5.7). This is not the case in hypoxic and anemic hypoxia. The influx and efflux of substrates and metabolites is also impaired in stagnant hypoxia. Anaerobic glycolysis (!p. 72) is therefore of little help because neither the uptake of glucose nor the discharge of H+ ions dissociated from lactic acid is possible.
4.Hypoxia can also occur when the diffusion distance is increased due to tissue thickening without a corresponding increase in the number of blood capillaries. This results in an insufficient blood supply to
cells lying outside the O2 supply radius (R) of the Krogh cylinder (!A).
5.Histotoxic or cytotoxic hypoxia occurs due to im-
paired utilization of O2 by the tissues despite a sufficient supply of O2 in the mitochondria, as observed in cyanide poisoning. Cyanide (HCN) blocks oxidative cellular metabolism by inhibiting cytochromoxidase.
Brain tissue is extremely susceptible to hypoxia, which can cause critical damage since dead nerve cells generally cannot be replaced. Anoxia, or a total lack of oxygen, can occur due to heart or respiratory failure. The cerebral survival time is thus the limiting factor for overall survival. Unconsciousness occurs after only 15 s of anoxia, and irreparable brain damage occurs if anoxia lasts for more than 3 min or so.
Cyanosis is a bluish discoloration of the skin, lips, nails, etc. due to excessive arterial deoxyhemoglobin ("50 g/L). Cyanosis is a sign of hypoxia in individuals with normal or only moderately reduced total Hb levels. When total Hb is extremely low, O2 deficiencies (anemic hypoxia) can be life-threatening, even in the absence of cyanosis. Cyanosis can occur in absence of significant hypoxia when the Hb level is elevated.
Despopoulos, Color Atlas of Physiology © 2003 Thieme
All rights reserved. Usage subject to terms and conditions of license.
A. O2 supply: Krogh’s cylinder model
PO2 (kPa) |
|
|
|
|
1 Normal |
|
Diffusion distance R |
8 6.7 5.3 |
4 |
|
2,7 |
1.3 |
0.8 |
||
9.3 |
|
0.8 |
|||||
|
|
|
|
|
|
||
10.7 |
|
|
|
|
|
|
1.3 |
|
|
|
|
|
|
|
|
12 |
8 |
6.7 |
5.3 |
|
4 |
|
3.5 |
Arterial end |
|
Capillary |
|
Supplied (homogeneous) tissue |
|
Venous end |
|
|
|
|
|
||||
PO2 (kPa) |
|
|
|
|
2 Hypoxemic hypoxia |
|
|
|
1.3 |
|
|
0 |
|
0 |
|
2.1 |
|
|
|
|
|
|
|
2.7 |
|
|
|
|
|
|
|
4 |
|
|
|
|
|
|
|
4.6 |
|
4.0 |
|
|
2.7 |
|
1,9 |
|
|
|
|
|
“Lethal corner” |
(after J.Piiper) |
|||
|
|
|
|
|
|
|
|
||
B. Hypoxia |
|
|
|
|
|
|
|
|
|
/Lblood) |
0.20 |
|
|
a |
Arterial PO2 falls from a to a‘ |
|
1 |
||
|
a‘ |
|
|
|
|
||||
|
Normal |
|
|
|
|
|
|||
|
|
|
|
|
|
|
|||
|
|
|
|
|
|
|
|
||
2 |
|
|
|
|
|
|
|
|
|
(LO |
0.10 |
v |
|
|
O2 extraction unchanged (here 0.5) |
|
|||
fraction |
|
Hypoxemic hypoxia |
|
|
|
|
|
|
|
v‘ |
|
|
|
|
|
|
|
|
|
|
|
|
|
|
|
|
|
|
|
2 |
0 |
|
|
|
|
|
Venous PO2 in organ falls from v to v‘ |
||
O |
5 |
10 |
kPa |
|
|
|
|
|
|
|
|
|
|
|
|
|
|||
|
|
|
PO2 |
|
|
|
|
|
|
/Lblood) |
0.20 |
|
|
a |
Hb concentration decreases |
|
2 |
||
|
|
Normala‘ |
O2-carrying capacity falls from a to a‘ |
|
|||||
2 |
|
|
|
|
|
|
|
|
|
(LO |
0.10 |
v |
|
|
|
|
|
|
|
|
|
|
|
|
|
|
|
||
fraction |
|
|
Anemic hypoxia |
|
|
O2 extraction unchanged |
|
|
|
|
v‘ |
|
|
|
|
Venous PO2 in organ falls from v to v‘ |
|||
|
|
|
|
|
|
||||
2 |
0 |
5 |
10 |
kPa |
|
|
|||
O |
|
|
|
|
|
|
|||
|
|
PO2 |
|
|
|
|
|
|
|
|
|
|
|
|
|
|
|
|
|
|
0.20 |
|
|
a |
|
|
! |
|
3 |
/Lblood) |
|
|
Perfusion Q decreases |
|
|||||
|
|
Normal |
O |
|
supply (=Q · [O ] ) falls |
|
|
||
|
|
|
|
|
· |
|
|
||
2 |
0.10 |
v |
|
|
|
2 |
2 a |
|
|
(LO |
|
|
|
|
|
|
|
||
|
Stagnant (ischemic) hypoxia |
|
|
|
|
|
|||
fraction |
|
|
|
O2 extraction rises |
|
|
|||
v‘ |
|
|
|
|
|
|
|
||
|
|
|
|
|
|
|
|
||
|
|
|
|
|
|
|
|
|
|
2 |
0 |
5 |
10 |
kPa |
|
|
Venous PO2 in organ falls from v to v‘ |
||
O |
|
|
|
|
|
|
|||
|
|
|
PO2 |
|
|
|
|
|
|
Plate 5.13 Internal (Tissue) Respiration, Hypoxia
131
Despopoulos, Color Atlas of Physiology © 2003 Thieme
All rights reserved. Usage subject to terms and conditions of license.

Respiratory Control and Stimulation
The respiratory muscles (!p. 108) are innervated by nerve fibers extending from the cervical and thoracic medulla (C4 –C8 and T1 –T7). The most important control centers are located in the medulla oblongata and cervical medulla (C1–C2), where interactive inspiratory and expiratory neurons on different levels (!A1, red and green areas). The network of these spatially separate neuron groups form a
|
rhythm |
generator (respiratory |
“center”) |
|
|
where respiratory rhythm originates (!A1). |
|||
|
The neuron groups are triggered alternately, |
|||
|
resulting in rhythmic inspiration and expira- |
|||
|
tion. They are activated in a tonic (non- |
|||
Respiration |
rhythm-dependent) manner by the formatio |
|||
reticularis, which receives signals from respira- |
||||
tory stimulants in the periphery and higher |
||||
|
||||
|
centers of the brain. |
|
||
|
Respiratory sensors or receptors are in- |
|||
5 |
volved in respiratory control circuits (!p. 4). |
|||
Central |
and peripheral chemosensors on the |
|||
|
||||
|
medulla oblongata and in the arterial circula- |
|||
|
tion continuously register gas partial pressures |
|||
|
in cerebrospinal fluid (CSF) and blood, respec- |
|||
|
tively, and mechanosensors in the chest wall re- |
|||
|
spond to stretch of intercostal muscles to |
|||
|
modulate the depth of breathing (!A2). Pul- |
|||
|
monary stretch sensors in the tracheal and |
|||
|
bronchial walls respond to marked increases |
|||
|
in lung volume, thereby limiting the depth of |
|||
|
respiration in humans (Hering–Breuer reflex). |
|||
|
Muscle spindles (!p. 318) in the respiratory |
|||
|
muscles also respond to changes in airway re- |
|||
|
sistance in the lung and chest wall. |
|
||
|
Chemical respiratory stimulants. The extent |
|||
|
of involuntary ventilation is mainly deter- |
|||
|
mined by the partial pressures of O2 and CO2 |
|||
|
and the pH of blood and CSF. Chemosensors re- |
|||
|
spond to any changes in these variables. Pe- |
|||
|
ripheral chemosensors in the glomera aortica |
|||
|
and carotica (!A3) register changes in the |
|||
|
arterial PO2. If it falls, they stimulate an increase |
|||
|
in ventilation via the vagus (X) and glos- |
|||
|
sopharyngeal nerves (IX) until the arterial PO2 |
|||
|
rises again. This occurs, for example, at high |
|||
|
altitudes (!p. 136). The impulse frequency of |
|||
|
the sensors increases sharply when the PO2 |
|||
132 |
drops below 13 kPa or 97 mmHg (peripheral |
|||
ventilatory drive). These changes |
are even |
|||
stronger when PCO2 and/or the H+ concentration in blood also increase.
Central chemosensors in the medulla react to CO2 and H+ increases (= pH decrease) in the CSF (!A4 and p. 126). Ventilation is then increased until PCO2 and the H+ concentration in blood and CSF decrease to normal values. This mostly central respiratory drive is very effective in responding to acute changes. An increase in arterial PCO2 from, say,. 5 to 9 kPa increases the total ventilation VE by a factor of ten, as shown in the CO2 response curve (!A6).
When a chronic rise in PCO2 occurs, the previously increased central respiratory drive decreases (!p. 126). If O2 supplied by artificial respiration tricks the peripheral chemosensors into believing that there is adequate ventilation, the residual peripheral respiratory drive will also be in jeopardy.
During physical work (!A5), the total ventilation increases due to (a) co-innervation of the respiratory centers (by collaterals of cortical efferent motor fibers) and (b) through impulses transmitted by proprioceptive fibers from the muscles.
Non-feedback sensors and stimulants also play an important role in modulating the basic rhythm of respiration. They include
Irritant sensors in the bronchial mucosa, which quickly respond to lung volume decreases by increasing the respiratory rate (deflation reflex or Head’s reflex), and to dust particles or irritating gases by triggering the cough reflex.
J sensors of free C fiber endings on alveolar and bronchial walls; these are stimulated in pulmonary edema, triggering symptoms such as apnea and lowering the blood pressure.
Higher central nervous centers such as the cortex, limbic system, hypothalamus or pons. They are involved in the expression of emotions like fear, pain and joy; in reflexes such as sneezing, coughing, yawning and swallowing; and in voluntary control of respiration while speaking, singing, etc.
Pressosensors (!p. 214), which are responsible for increasing respiration when the blood pressure decreases.
Heat and cold sensors in the skin and thermoregulatory center. Increases (fever) and decreases in body temperature lead to increased respiration.
Certain hormones also help to regulate respiration. Progesterone, for example, increases respiration in the second half of the menstrual cycle and during pregnancy.
Despopoulos, Color Atlas of Physiology © 2003 Thieme
All rights reserved. Usage subject to terms and conditions of license.

A. Respiratory control and stimulation |
|
|
|
|
|
|
||||
Voluntary |
|
|
|
|
|
|
|
|
|
Stimulation |
action |
|
Emotion, |
|
|
|
|
|
|
||
|
|
|
|
|
|
|
|
|||
|
temperature |
|
|
|
|
|
|
|||
|
|
|
|
Coughing, |
|
|
|
|
||
|
|
|
|
sneezing, |
|
|
|
|
||
|
|
|
|
etc. |
|
|
5 |
|
|
|
|
|
|
|
|
|
|
|
|
and |
|
|
|
|
|
|
|
|
Physical work |
|
||
|
|
Fourth |
|
|
|
Co-innervation |
|
|
|
Respiratory Control |
Respiratory neurons |
|
ventricle |
IXth/Xth |
|
|
|
||||
(respiratory “center”): |
|
|
|
|
Mechanosensors |
|
||||
expiratory |
|
Obex |
|
nerve |
|
|
|
|||
|
|
|
|
in locomotor system |
||||||
inspiratory |
|
|
|
|
|
|
||||
|
|
|
|
|
|
|
|
|||
|
|
|
|
|
|
|
|
|
||
|
1 |
|
C1, C2 |
Respiratory drive: |
|
|
5.14 |
|||
|
|
Rhythm |
|
Peripheral |
|
|
|
|||
|
|
|
Central |
|
|
|
|
Plate |
||
|
generator |
|
|
|
|
|
||||
|
|
|
|
|
|
|
||||
|
|
|
|
|
|
|
|
|
|
|
|
|
|
|
|
|
4 |
|
|
|
|
|
|
|
|
|
|
|
Central |
|
IXth |
|
|
|
|
|
|
|
|
chemosensors |
|
||
|
|
|
|
|
|
|
nerve |
|
||
|
|
|
|
|
|
|
|
|
|
|
Xth |
Respiration |
|
|
|
|
Glomera |
|
|
||
nerve |
|
|
|
|
|
|
|
carotica |
|
|
|
|
|
|
|
|
|
In CSF: |
|
Xth |
|
|
|
|
|
|
|
|
PCO2, pH |
|
nerve |
|
Depth of |
Alveolar |
|
|
|
Glomera |
|
|
|||
respiration |
ventilation |
|
|
|
aortica |
|
|
|||
2 |
|
|
|
|
|
|
|
3 |
|
|
|
|
|
|
|
|
|
Peripheral |
|
|
|
Mechanosensors |
|
|
|
|
|
|
|
chemosensors |
|
|
|
|
In blood: |
|
|
|
|
|
|
||
in lung and |
|
|
|
|
|
|
|
|
||
respiratory muscles |
|
|
PCO2, pH |
|
|
|
|
|
|
|
|
|
|
|
PO2 |
|
|
|
|
|
|
|
|
|
(L/min) |
80 |
|
|
|
|
|
|
|
|
|
60 |
|
|
|
|
|
|
|
|
|
|
ventilation |
40 |
|
|
|
|
|
|
|
6 |
|
20 |
|
|
|
|
|
|
|
CO2 response curve |
|
|
|
|
|
|
||||
Total |
|
|
|
|
|
|
||||
|
|
Normal value |
|
|
|
|||||
|
|
|
04 |
|
|
|
|
|||
|
|
|
|
|
|
|
|
133 |
||
|
|
|
|
|
6 |
8 |
10 |
|
||
|
|
|
|
|
|
|
Arterial PCO2 (kPa) |
|
|
|
Despopoulos, Color Atlas of Physiology © 2003 Thieme
All rights reserved. Usage subject to terms and conditions of license.

Effects of Diving on Respiration
Diving creates a problem for respiration due to the lack of normal ambient air supply and to higher the outside pressures exerted on the body. The total pressure on the body underwater is equal to the water pressure (98 kPa or 735 mmHg for each 10 m of water) plus the atmospheric pressure at the water surface.
|
A snorkel can be used when diving just |
|
|
below the water surface (!A), but it increases |
|
|
dead space (!pp. 114 and 120), making it |
|
|
harder to breathe. The additional pressure load |
|
|
from the water on chest and abdomen must |
|
|
also be overcome with each breath. |
|
|
The depth at which a snorkel can be used is limited 1) |
|
Respiration |
because an intolerable increase in dead space or air- |
|
way resistance will occur when using an extremely |
||
11 kPa, equivalent to 112 cm H2O (peak inspiratory |
||
|
long or narrow snorkel, and 2) because the water |
|
|
pressure at lower depths will prevent inhalation. The |
|
|
maximum suction produced on inspiration is about |
|
5 |
pressure, !p. 116). Inspiration therefore is no |
|
longer possible at aquatic depths of about 112 cm or |
||
|
||
|
more due to the risk of hypoxic anoxia (!A). |
|
|
Scuba diving equipment (scuba = self-con- |
|
|
tained underwater breathing apparatus) is |
|
|
needed to breathe at lower depths (up to about |
|
|
70 m). The inspiratory air pressure (from pres- |
|
|
surized air cylinders) is automatically adjusted |
|
|
to the water pressure, thereby permitting the |
|
|
diver to breathe with normal effort. |
|
|
However, the additional water pressure increases the |
|
|
partial pressure of nitrogen PN2 (!B), resulting in |
|
|
higher concentrations of dissolved N2 in the blood. |
|
|
The pressure at a depth of 60 meters is about seven |
|
|
times higher than at the water surface. The pressure |
|
|
decreases as the diver returns to the water surface, |
|
|
but the additional N2 does not remain dissolved. The |
|
|
diver must therefore ascend slowly, in gradual stages |
|
|
so that the excess N2 can return to and be expelled |
|
|
from the lungs. Resurfacing too quickly would lead |
|
|
to the development of N2 bubbles in tissue (pain!) |
|
|
and blood, where they can cause obstruction and |
|
|
embolism of small blood vessels. This is called |
|
|
decompression sickness or caisson disease (!B). |
|
|
Euphoria (N2 narcosis?), also called rapture of the |
|
|
deep, can occur when diving at depths of over 40 to |
|
|
60 meters. Oxygen toxicity can occur at depths of |
|
|
75 m or more (!p. 136). |
|
|
When diving unassisted, i.e., simply by holding |
|
134 |
one’s breath, PCO2 in the blood rises, since the |
|
CO2 produced by the body is not exhaled. Once |
a certain PCO2 has been reached, chemosensors
(!p. 132) trigger a sensation of shortness of breath, signaling that it is time to resurface.
To delay the time to resurface, it is possible to lower the PCO2 in blood by hyperventilating before diving. Experienced divers use this trick to stay under water longer. The course of alveolar partial pressures over time and the direction of alveolar gas exchange while diving (depth: 10 m; duration 40 s) is shown in C: Hyperventilating before a dive reduces the PCO2 (solid green line) and slightly increases the PO2 (red line) in the alveoli (and in blood). Diving at a depth of 10 m doubles the pressure on the chest and abdominal wall. As a result, the partial pressures of gases in the alveoli (PCO2, PO2, PN2) increase sharply. Increased quantities of O2 and CO2 therefore diffuse from the alveoli into the blood. Once the PCO2 in blood rises to a certain level, the body signals that it is time to resurface. If the diver resurfaces at this time, the PO2 in the alveoli and blood drops rapidly (O2 consumption + pressure decrease) and the alveolar O2 exchange stops. Back at the water surface, the PO2 reaches a level that is just tolerable. If the diver excessively hyperventilates before the dive, the signal to resurface will come too late, and the PO2 will drop to zero (anoxia) before the person reaches the water surface, which can result in unconsciousness and drowning (!C, dotted lines).
Barotrauma. The increased pressure associated with diving leads to compression of air-filled organs, such as the lung and middle ear. Their gas volumes are compressed to 1/2 their normal size at water depths of 10 m, and to 1/4 at depths of 30 m.
The missing volume of air in the lungs is automatically replaced by the scuba, but not that of the middle ear. The middle ear and throat are connected by the Eustachian tube, which is open only at certain times (e.g., when swallowing) or not at all (e.g., in pharyngitis). If volume loss in the ear is not compensated for during a dive, the increasing water pressure in the outer auditory canal distends the eardrum, causing pain or even eardrum rupture. As a result, cold water can enter the middle ear and impair the organ of equilibrium, leading to nausea, dizziness, and disorientation. This can be prevented by pressing air from the lungs into the middle ear by holding the nose and blowing with the mouth closed.
The air in air-filled organs expand when the diver ascends to the water surface. Resurfacing too quickly, i.e., without expelling air at regular intervals, can lead to complications such as lung laceration and pneumothorax (!p. 110) as well as potentially fatal hemorrhage and air embolism.
Despopoulos, Color Atlas of Physiology © 2003 Thieme
All rights reserved. Usage subject to terms and conditions of license.

A. Snorkeling |
|
B. Diving with equipment |
|
Normal |
Too deep |
Gas embolism |
|
|
|
|
|
<40cm |
spacedeadExcessive |
|
RespirationonDiving |
|
|
||
|
resistance |
|
N2 |
|
N2 bubbles |
Baro- |
|
|
|
Blood |
|
|
|
Resurfacing |
trauma |
|
or |
too rapidly |
|
Depth |
N2 |
|
|
|
|
||
>100cm |
Anoxia |
|
|
|
|
|
of |
Water pressure |
|
Depth |
Effects |
prevents inhalation |
|
ca.70 m |
|
|
|
|
|
|
|
5.15 |
C. Diving unassisted |
|
|
|
|
Plate |
|
|
|
|
|
|
|
|
0 |
|
|
|
|
|
|
Depth |
|
|
|
|
|
|
(m) |
|
|
|
|
|
|
(Water pressure 10 |
|
|
|
|
|
|
98kPa |
0 |
20 |
|
40 |
Diving time (s) |
|
at depth of 10m) |
|
|
|
|
|
|
Alveolar partial pressures |
|
|
Signal to resurface |
|
|
|
|
|
19.3 |
|
|
|
|
Hyper- |
PO2 (kPa) |
|
|
|
|
|
|
|
|
|
|
||
ventilation |
6.6 |
|
|
|
|
|
15 |
|
6.6 |
|
|||
13.3 |
PCO2 (kPa) |
148 |
|
Too late! |
|
|
|
|
|
|
|
|
|
5.2 |
|
|
|
|
|
|
|
3.5 |
|
|
|
|
|
|
|
|
|
4.2 |
|
|
|
PN2 |
(kPa) |
|
|
Anoxia |
|
|
|
76.5 |
|
|||
76.5 |
76.5 |
|
|
|
||
|
|
|
|
|
||
Alveolar gas exchange |
Water pressure |
0.0 |
|
|||
|
|
|||||
|
|
|
|
|||
Lung |
|
|
|
|
|
|
|
O2 |
O2 |
N2 |
O2 |
|
|
|
N2 |
CO2 |
|
N2 |
|
|
|
|
|
|
|
||
|
|
|
|
|
|
|
Blood |
CO2 |
|
|
CO2 |
|
135 |
|
|
|
(after Hong et al.) |
|||
|
|
|
|
|
|
|
Despopoulos, Color Atlas of Physiology © 2003 Thieme
All rights reserved. Usage subject to terms and conditions of license.

5 Respiration
136
Effects of High Altitude on Respiration
At sea level, the average barometric pressure (PB) !101 kPa (760 mmHg), the O2 fraction in ambient air (FIO2) is 0.209, and the inspiratory partial pressure of O2 (PIO2) !21 kPa (!p. 106). However, PB decreases with increasing altitude (h, in km):
PB (at h) = PB (at sea level) ! e-0.127 ! h |
[5.9] |
This results in a drop in PIO2 (!A, column 1), alveolar PO2 (PAO2) and arterial PO2 (PaO2). The PAO2 at sea level is about 13 kPa (!A, column 2). PAO2 is an important measure of oxygen supply. If the PAO2 falls below a critical level (ca. 4.7 kPa = 35 mmHg), hypoxia (!p. 130) and impairment of cerebral function will occur. The critical PAO2 would be reached at heights of about 4000 m above sea level during normal ventilation (!A, dotted line in column 2). However, the low PaO2 triggers chemosensors
(!p. 132) that stimulate an increase in total |
|
. |
deficiency |
ventilation (VE); this is called O2 |
|
ventilation (!A, column 4). As a result, larger volumes of CO2 are exhaled, and the PACO2 and PaCO2 decrease (see below). As described by the alveolar gas equation,
PAO2 ! PIO2 |
|
PACO2 |
[5.10] |
|
RQ |
||
|
|
|
|
where RQ is |
the |
respiratory quotient |
|
(!pp. 120 and 228), any fall in PACO2 will lead to a rise in the PAO2. O2 deficiency ventilation stops the PAO2 from becoming critical up to altitudes of about 7000 m (altitude gain, !A).
The maximal increase in ventilation (!3 " resting rate) during acute O2 deficiency is relatively small compared to the increase (!10 times the resting rate) during strenuous physical exercise at normal altitudes (!p. 74, C3) because increased ventilation at high altitudes reduces the PaCO2 (= hyperventilation, !p. 108), resulting in the development of respiratory alkalosis (!p. 144). Central chemosensors (!p. 132) then emit signals to lower the respiratory drive, thereby counteracting the signals from O2 chemosensors to increase the respiratory drive. As the mountain climber adapts, respiratory alkalosis is compensated for by increased renal excretion of HCO3– (!p. 144). This helps return the pH of the blood toward normal, and the O2 deficiencyrelated increase in respiratory drive can now
prevail. Stimulation of O2 chemosensors at high altitudes also leads to an increase in the heart rate and a corresponding increase in cardiac output, thereby increasing the O2 supply to the tissues.
High altitude also stimulates erythropoiesis (!p. 88ff.). Prolonged exposure to high altitudes increases the hematocrit levels, although this is limited by the corresponding rise in blood viscosity (!pp. 92, 188).
Breathing oxygen from pressurized O2 cylinders is necessary for survival at altitudes above 7000 m, where PIO2 is almost as high as the barometric pressure PB (!A, column 3). The critical PAO2 level now occurs at an altitude of about 12 km with normal ventilation, and at about 14 km with increased ventilation. Modern long-distance planes fly slightly below this altitude to ensure that the passengers can survive with an oxygen mask in case the cabin pressure drops unexpectedly.
Survival at altitudes above 14 km is not possible without pressurized chambers or pressurized suits like those used in space travel. Otherwise, the body fluids would begin to boil at altitudes of 20 km or so (!A), where PB is lower than water vapor pressure at body temperature (37 #C).
Oxygen Toxicity
Hyperoxia occurs when PIO2 is above normal ($22 kPa or 165 mmHg) due to an increased O2 fraction (oxygen therapy) or to an overall pressure increase with a normal O2 fraction (e.g. in diving, !p. 134). The degree of O2 toxicity depends on the PIO2 level (critical: ca. 40 kPa or 300 mmHg) and duration of hyperoxia. Lung dysfunction (!p. 118, surfactant deficiency) occurs when a PIO2 of about 70 kPa (525 mmHg) persists for several days or 200 kPa (1500 mmHg) for 3–6 hours. Lung dysfunction initially manifests as coughing and painful breathing. Seizures and unconsciousness occur at PIO2 levels above 220 kPa (1650 mmHg), e.g., when diving at a depth of about 100 m using pressurized air.
Newborns will go blind if exposed to PIO2 levels much greater than 40 kPa (300 mmHg) for long periods of time (e.g., in an incubator), because the vitreous body then opacifies.
Despopoulos, Color Atlas of Physiology © 2003 Thieme
All rights reserved. Usage subject to terms and conditions of license.

Usage .reserved rights All |
Atlas Color Despopoulos, |
terms to subject |
© Physiology of |
conditions and |
Thieme 2003 |
.license of |
|
A. Respiration at high altitudes (without acclimatization)
(km)Altitude 18
16
14
12
10
8
6
4
2
0
Boiling point of body fluids at 37°C
Maximum altitude
when breathing O2
Increased ventilation
when breathing O2
Maximum altitude when breathing air
Increased ventilation when breathing air
Inspiratory pressures
1
Barometric pressure
PIO2 when breathing O2
PIO2 when breathing air
5 |
15 |
25 |
|
|
kPa |
|
|
|
Alveolar Po2 |
|
|
|
|
|
|
|
Alveolar Po2 |
|
|
|
Total ventilation |
! |
|||||||
|
when breathing air |
|
|
|
|
|
|
|
(VE) |
||||||||||||||
|
when breathing O2 |
|
|
|
|
|
|
||||||||||||||||
|
|
|
|
2 |
|
|
|
|
|
|
|
|
3 |
|
|
|
|
|
|
|
|
|
|
|
|
|
|
|
|
|
|
|
|
|
|
|
|
|
|
|
|
|
4 |
||||
|
|
|
|
|
|
|
|
|
|
|
|
|
|
|
|
|
|
· |
· |
|
|
|
|
|
|
|
|
|
|
|
|
|
|
|
|
|
|
|
|
|
|
VE (VT) when |
|
||||
|
|
|
|
|
|
|
|
|
|
|
|
Critical altitude |
|
|
|
breathing O2 |
|
||||||
|
|
|
|
|
|
|
|
|
|
|
|
with increased |
|
|
|
|
|
|
|
|
|
||
|
|
|
|
|
|
|
|
|
|
|
|
ventilation |
|
|
|
|
|
|
|
|
|
|
|
|
|
|
|
|
|
|
|
|
|
|
|
Altitude gain |
from |
|
|
|
|
|
|
|
|
||
|
|
|
|
|
|
|
|
|
|
|
|
|
|
|
|
|
|
|
|
||||
|
|
|
|
|
|
|
|
|
|
|
|
|
|
|
|
|
|
|
|
||||
|
|
|
|
|
|
|
|
|
|
|
|
increased ventilation |
|
|
|
|
|
|
|
|
|||
|
|
|
|
|
|
|
|
|
|
|
|
|
|
|
|
|
|
|
|
||||
|
|
|
|
|
|
|
|
|
|
|
|
Critical altitude |
|
|
|
· |
|
· |
|
|
|||
|
|
|
|
|
|
|
|
|
|
|
|
|
|
|
|
|
|
||||||
|
|
|
|
|
|
|
|
|
|
|
|
w/o increased |
|
|
|
VE |
(VT) when |
||||||
|
|
|
|
|
|
|
|
|
|
|
|
ventilation |
|
|
|
breathing air |
|||||||
|
|
|
Critical altitude |
|
|
|
|
|
|
|
|
|
|
|
|
|
|
|
|
|
|
||
|
|
|
with increased |
|
|
|
|
|
|
|
|
|
|
|
|
|
|
|
|
|
|
||
|
|
|
ventilation |
|
|
|
|
|
|
|
|
PAO2 |
|
|
|
|
|
|
|
|
|
|
|
|
|
|
|
|
|
|
|
|
|
|
|
|
|
|
|
|
|
|
|
|
|
||
|
|
|
Altitude gain |
from |
increased ventilation |
|
|
|
Doubled |
|
Tripled |
|
|||||||||||
|
|
|
|
|
|
|
|
|
|
|
|||||||||||||
low |
|
Critical altitude |
low |
|
|
|
|
|
|
|
|
|
|
|
|
|
|||||||
too |
|
w/o increased |
too |
|
|
|
|
|
|
|
|
|
|
|
|
|
|||||||
|
ventilation |
|
|
|
|
|
|
|
|
|
|
|
|
|
|
|
|
|
|
||||
2 |
|
|
|
|
|
|
|
|
|
|
|
|
|
|
|
|
|
|
|
|
|
||
|
|
|
|
|
|
|
2 |
|
|
|
|
|
|
|
|
|
|
|
|
|
|||
|
O |
|
PAO2 |
|
|
|
|
|
|
O |
|
|
|
|
|
|
|
|
|
|
|
|
|
PA |
|
|
|
|
|
|
PA |
|
|
|
|
|
|
|
|
|
|
|
|
|
|||
|
|
|
|
|
|
|
|
|
|
|
|
|
|
|
|
|
|
|
|
|
|
|
|
|
|
5 |
15 |
25 |
|
|
|
|
|
|
5 |
15 |
25 |
|
|
|
|
10 |
· |
|
30 |
|
|
|
|
|
PAO2 (kPa) |
|
|
|
|
|
|
|
|
PAO2 (kPa) |
|
|
|
|
|
· |
|
|
|
|
|
|
|
|
|
|
|
|
|
|
|
|
|
|
|
|
|
VE |
(VT) (L/min) |
||||||
 137
137
Plate 5.16 Effects of High Altitude on Respiration