

книги студ / color atlas of physiology 5th ed[1]. (a. despopoulos et al, thieme 2003)
.pdf10 Nutrition and Digestion
228
Energy Metabolism and Calorimetry
The chemical energy of foodstuffs is first converted into energy-rich substances such as creatine phosphate and adenosine triphosphate (ATP). Energy, work and amount of heat are expressed in joules (J) or calories (cal) (!p. 374). The energy produced by hydrolysis of ATP (!p. 41) is then used to fuel muscle activity, to synthesize many substances, and to create concentration gradients (e.g., Na+ or Ca2+ gradients; !p. 26ff.). During all these energy conversion processes, part of the energy is always converted to heat (!p. 38ff.).
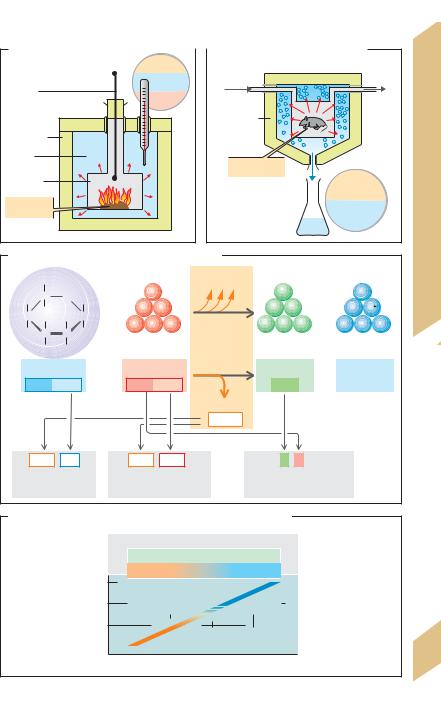
In oxidative (aerobic) metabolism (!p. 39 C), carbohydrates and fat combine with O2 to yield CO2, water, high-energy compounds (ATP etc.) and heat. When a foodstuff is completely oxidized, its biologically useable energy content is therefore equivalent to its physical caloric value (CV).
The bomb calorimeter (!A), a device consisting of an insulated combustion chamber in a tank of water, is used to measure the CV of foodstuffs. A known quantity of a foodstuff is placed in the combustion chamber of the device and incinerated in pure O2. The surrounding water heats up as it absorbs the heat of combustion. The degree of warming is equal to the caloric value of the foodstuff.
Fats and carbohydrates are completely oxidized to CO2 and H2O in the body. Thus, their physiological fuel value (PFV) is identical to their CV. The mean PFV is 38.9 kJ/g (= 9.3 kcal/ g) for fats and 17.2 kJ/g (= 4.1 kcal/g) for digestible carbohydrates (!p. 227 A). In contrast, proteins are not completely broken down to CO2 and water in the human body but yield urea, which provides additional energy when it is oxidized in the bomb calorimeter. The CV of proteins (ca. 23 kJ/g) is therefore greater than their PFV, which is a mean of about 17.2 kJ/g or 4.1 kcal/g (!p. 227 A).
At rest, most of the energy supplied by the diet is converted to heat, since hardly any external mechanical work is being performed. The heat produced is equivalent to the internal energy turnover (e.g., the work performed by the heart and respiratory muscles or expended for active transport or synthesis of substances).
In direct calorimetry (!B), the amount of heat produced is measured directly. The test subject, usually an experimental animal, is placed in a small chamber immersed in a known volume of ice. The amount of heat produced is equivalent to the amount of heat absorbed by the surrounding water or ice. This is respectively calculated as the rise in water temperature or the amount of ice that melts.
In indirect calorimetry, the amount of heat produced is determined indirectly by measur. - ing the amount of O2 consumed (VO2;
!p. 120). This method is used in humans. To determine the total. metabolic rate (or TEE;
!p. 226) from VO2, the caloric equivalent (CE) of a foodstuff oxidized in the subject’s metabolism during the measurement must be known. The CE is calculated from the PFV and the amount of O2 needed to oxidize the food. The
PFV of glucose |
is 15.7 kJ/g and 6 mol of O2 |
||
(6 !22.4 L) |
are |
required |
to oxidize 1 mol |
(= 180 g) of |
glucose (!C). |
The oxidation of |
|
180 g of glucose therefore generates 2827 kJ of heat and consumes 134.4 L of O2 resulting in a CE of 21 kJ/L. This value represents the CE for glucose under standard conditions (O"C; !C). The mean CE of the basic nutrients at 37"C is 18.8 kJ/L O2 (carbohydrates), 17.6 kJ/L O2 (fats) and 16.8 kJ/L O2 (proteins).
The oxidized nutrients must be known in order to calculate the metabolic rate from the CE. The respiratory quotient (RQ) is a rough. measure. of the nutrients oxidized. RQ = VCO2/ VO2 (!p. 120). For pure carbohydrates oxidized, RQ = 1.0. This can be illustrated for glucose as follows:
C6H12O6 + 6 O2 6 CO2 + 6 H2O |
[10.1] |
The oxidation of the fat tripalmitin yields:
2 C51H98O6 + 145 O2 102 CO2 + 98 H2O [10.2]
The RQ of tripalmitin is therefore 102/145 = 0.7. Since the protein fraction of the diet stays relatively constant, each RQ between 1 and 0.7 can be assigned a CE (!D). Using the. known CE, the TEE can be calculated as CE · VO2.
Food increases the TEE (diet–induced thermogenesis, DIT) because energy must be consumed to absorb and store the nutrients. The DIT of protein is higher than that of other substances, e.g., glucose.
Despopoulos, Color Atlas of Physiology © 2003 Thieme
All rights reserved. Usage subject to terms and conditions of license.
|
|
|
|
|
A. Bomb calorimeter |
|
|
|
B. Direct calorimetry (Lavoisier) |
|
|
|
|
|
|
|
|
4.2 kJ |
|
|
|
|
|
|
|
|
|
|
|
|
heat |
|
|
|
|
|
|
Ignition |
|
|
|
|
1LH2O |
Air |
Ice |
|
Calorimetry |
|||
|
|
|
|
by |
|
|
|
|||||
|
|
|
|
|
|
1°C |
|
|
|
|
||
|
|
|
|
|
|
|
|
Insulation |
|
|
|
|
Insulation |
|
|
|
|
|
|
|
|
|
|
||
|
|
|
|
|
|
|
H2O |
|
and |
|||
Water |
|
|
|
|
|
|
|
|
|
|||
|
|
|
|
|
|
|
Experimental |
|
|
|||
Combustion |
|
|
|
|
|
|
|
|
Metabolism |
|||
|
|
|
|
|
|
animal |
|
|
|
|||
chamber |
|
|
O2 |
O2 |
|
|
|
|
|
334 kJ |
||
|
|
|
|
|
|
|
|
|
|
|
thaw |
|
Test |
|
|
|
|
|
|
|
|
|
|
1L |
|
substance |
|
|
|
|
|
|
|
|
|
of water |
||
C. Oxidation of glucose: fuel value, CE and RQ |
|
|
|
Energy |
||||||||
|
|
|
|
|||||||||
|
H2COH |
|
|
|
O2 |
|
Energy |
CO2 |
|
|
10.2 |
|
H |
C |
O |
OH |
|
|
|
|
H2O |
Plate |
|||
|
|
|
O2 |
O2 |
|
|
CO2 CO2 |
|
H2O H2O |
|||
C |
H |
|
C |
|
|
|
|
|||||
OH |
H |
+ |
O2 |
O2 |
O2 |
Decomposition |
CO2 CO2 CO2 |
+ H2O H2O H2O |
|
|||
|
|
|
||||||||||
HO |
C |
C |
H |
|
|
|
|
(combustion) |
|
|
|
|
|
H |
OH |
|
|
|
|
|
|
|
|
|
|
|
Glucose |
|
+ |
|
O2 |
|
|
CO2 |
+ |
Water of |
|
|
|
|
|
|
|
|
|
|
|
oxidation |
|
||
|
1mol = 180g |
|
6mol = 134.4L |
|
6mol |
6mol |
|
|||||
|
|
|
|
|
|
|
|
Energie |
|
|
|
|
|
|
|
|
|
|
|
|
2827kJ |
|
|
|
|
|
2827 : 180 |
|
|
2827 : 134.4 |
|
6 : 6 = 1.0 |
|
|
||||
|
= 15.7kJ/g |
|
|
= 21kJ/L O2 |
Respiratory quotient (RQ) |
|
||||||
|
Fuel value |
|
|
Caloric equivalent (CE) |
for glucose |
|
|
|||||
D. RQ and caloric equivalent relative to nutrient composition
Composition of foodstuffs:
|
Proteins (constant 12%) |
Fats |
Carbohydrates |
1.0
Respiratory 0.9 quotient
(RQ) 0.8
0.7 |
|
|
|
|
|
|
|
|
|
|
Caloric equivalent (CE) |
229 |
|
|
|
|
|
|
|
|
|
|
|
|
|||
19.7 |
20.1 |
20.5 |
20.9 |
||||||||||
kJ/L O2 |
|
||||||||||||
Despopoulos, Color Atlas of Physiology © 2003 Thieme
All rights reserved. Usage subject to terms and conditions of license.

Energy Homeostasis and Body Weight
|
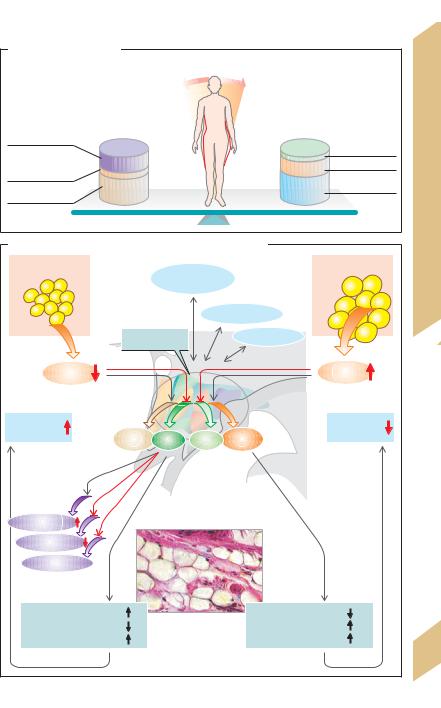
Fat depots are by far the body’s largest energy |
|
|
reserve. Accurate long-term homeostasis of |
|
|
energy absorption and consumption is neces- |
|
|
sary to keep the size of the fat depots constant, |
|
|
i.e., to maintain lipostasis. Considering that a |
|
|
person’s body weight (BW) mainly varying |
|
|
with the weight of the fat depots, it is obvious |
|
|
that energy homeostasis is synonymous with |
|
|
the regulation of body weight (!A). |
|
Digestion |
The body mass index (BMI) is commonly |
|
used to determine whether an individual is |
||
underweight, overweight or in the normal |
||
weight range. BMI is calculated from body |
||
weight (kg) and height (m) as follows: |
|
|
and |
|
|
BMI = (weight/height)2 |
[10.3] |
|
Nutrition |
The normal BMI range is 19–24 in women and 20–25 |
|
in men. The “normal” BMI range is defined as the |
||
values at which the mean life expectancy is highest. |
||
An abnormally high body mass index (BMI !24 or 25 |
||
10 |
= overweight; BMI !30 = obesity) reduces the life |
|
expectancy since this is often associated with diabetes mellitus (type II), hypertension and cardiac disease.
The following regulatory mechanisms serve to keep the fat depots and thus the body weight constant (!B):
The hypothalamus, the center responsible for feedback control of BW, maintains communication with the limbic system, cerebral cortex and brain stem. It sends and receives:
Afferent messages concerning the size of fat depots. Leptin, a 16-kDa proteohormone produced by fat cells, is the main indicator for this. The plasma leptin concentration rises as fat cell mass increases.
Efferent commands (a) to reduce nutrient absorption and increase energy consumption when plasma leptin are high (“fat reserve high!”), and (b) to increase nutrient absorption and decrease energy consumption when plasma leptin levels are low (“fat reserve low!”) (!B).
Leptin receptors. Leptin binds with type b leptin receptors (Ob-Rb) of the hypothalamus (mainly in dorsomedial, ventromedial, lateral, paraventricular and arcuate nuclei). Certain neurons with Ob-Rb lie in front of the blood–
230brain barrier. (T lymphocytes and B cells of the pancreas are also equipped with Ob-Rb recep-
tors.)
Effects of leptin. In contrast to primary starvation, the weight loss induced by leptin is restricted to the body’s fat depots and completes the feedback loop of the regulatory process. The effects of leptin are chiefly mediated by two neurotransmitters located in the hypothalamus: α-MSH and NPY (!B).
α-MSH. Leptin stimulates the release of α- MSH (α-melanocyte-stimulating hormone), one of the melanocortins (MC) synthesized from POMC (!p. 280). α-MSH inhibits the absorption of nutrients and increases sympathetic nervous activity and energy consumption via MC4 receptors in various areas of the hypothalamus.
The mechanism by which α-MSH increases energy consumption is not entirely clear, but an involuntary increase in ordinary skeletal muscle activity and tone appears to occur. In addition, uncoupling proteins (type UCP2 and UCP3) that were recently discovered in skeletal muscle and white fat make the membranes of the mitochondria more permeable to H+, thereby uncoupling the respiratory chain. As a result, chemical energy is converted into more heat and less ATP. The action of these UCPs, the expression of which may be stimulated by α-MSH, is therefore similar to that of thermogenin (UCP1; !p. 222).
NPY. Leptin inhibits the hypothalamic release of NPY (neuropeptide Y), a neuropeptide that stimulates hunger and appetite, increases the parasympathetic activity and reduces energy consumption.
Leptin deficiency. Since NPY increases the secretion of gonadotropin-releasing hormone (GnRH), extreme weight loss results in amenorrhea (!B). Certain genetic defects can lead to impaired leptin production (ob [obesity] gene) or impaired leptin receptor function (db [diabetes] gene). The symptoms include arrested development in puberty and childhood obesity.
Other neurotransmitters and neuropeptides also play a role in the long-term regulation of fat depots. Some like orexin A/B and norepinephrine (α2-adreno- ceptors) are orexigenic, i.e. they stimulate the appetite, while others like CCK, CRH, CART (cocaine and amphetamine-regulated transcript), insulin, and serotonin are anorexigenic. Peptides like CCK, GLP- 1 (glucagon-like peptide amides), somatostatin, glucagon, and GRP (gastrin-releasing peptide) signal satiety, i.e., that one has had enough to eat. Together with gustatory stimuli and stretch receptors of the stomach wall, these satiety peptides help to limit the amount of food consumed with each meal.
Despopoulos, Color Atlas of Physiology © 2003 Thieme
All rights reserved. Usage subject to terms and conditions of license.
A. Energy homeostasis |
|
|
Energy reserve |
||
(body weight) |
||
Decrease |
Increase |
|
Physical activity |
Absorption of: |
|
|
||
Energy for |
Proteins |
|
Fats |
||
absorption and |
||
nutrient storage |
Carbo- |
|
Basal |
hydrates |
|
metabolic rate |
|
|
B. Regulation of body weight by leptin, α-MSH and NPY
Weight loss |
|
Weight gain |
|
Cortex |
|
|
|
Limbic system |
Hypothalamus |
Brain stem |
|
|
||
Leptin |
|
Leptin |
Fat reserve |
|
Fat reserve |
α-MSH NPY |
NPY |
α-MSH |
Corticoliberin
Somatoliberin
Gonadoliberin 
Food intake |
Subcutaneous fat |
Food intake |
|
Energy consumption |
Energy consumption |
||
|
|||
Parasympathetic activity |
|
Sympathetic activity |
Despopoulos, Color Atlas of Physiology © 2003 Thieme
All rights reserved. Usage subject to terms and conditions of license.
Plate 10.3 Energy Homeostasis and Body Weight
231

10 Nutrition and Digestion
232
Gastrointestinal (GI) Tract: Overview,
Immune Defense, Blood Flow
Food covering the body’s energy and nutrient requirements (!p. 228ff.) must be swallowed, processed and broken down (digestion) before it can be absorbed from the intestines. The three-layered GI musculature ensures that the GI contents are properly mixed and transported. The passage time through the different GI segments varies and is largely dependent on the composition of the food (see A for mean passage times).
Solid food is chewed and mixed with saliva, which lubricates it and contains immunocompetent substances (see below) and enzymes. The esophagus rapidly transports the food bolus to the stomach. The lower esophageal sphincter opens only briefly to allow the food to pass. The proximal stomach mainly serves as a food reservoir. Its tone determines the rate at which food passes to the distal stomach, where it is further processed (chyme formation) and its proteins are partly broken down. The distal stomach (including the pylorus) is also responsible for portioning chyme delivery to the small intestine. The stomach also secretes intrinsic factor (!p. 90).
In the small intestine, enzymes from the pancreas and small intestinal mucosa break down the nutrients into absorbable components. HCO3– in pancreatic juices neutralizes the acidic chyme. Bile salts in bile are essential for fat digestion. The products of digestion (monosaccharides, amino acids, dipeptides, monoglycerides and free fatty acids) as well as water and vitamins are absorbed in the small intestine.
Waste products (e.g. bilirubin) to be excreted reach the feces via bile secreted by the liver. The liver has various other metabolic functions. It serves, for example, as an obligatory relay station for metabolism and distribution of substances reabsorbed from the intestine (via the portal vein, see below), synthesizes plasma proteins (incl. albumin, globulins, clotting factors, apolipoproteins etc.) and detoxifies foreign substances (biotransformation) and metabolic products (e.g., ammonia) before they are excreted.
The large intestine is the last stop for water and ion absorption. It is colonized by bacteria and contains storage areas for feces (cecum, rectum).
Immune defense. The large internal surface area of the GI tract (roughly 100 m2) requires a very effective immune defense system. Saliva contains mucins, immunoglobulin A (IgA) and lysozyme that prevent the penetration of pathogens. Gastric juice has a bactericidal effect. Peyer’s patches supply the GI tract with immunocompetent lymph tissue. M cells (special membranous cells) in the mucosal epithelium allow antigens to enter Peyer’s patches. Together with macrophages, the Peyer’s patches can elicit immune responses by secreting IgA (!p. 98). IgA is transported to the intestinal lumen by transcytosis (!p. 30). In the epithelium, IgA binds to a secretory component, thereby protecting it from digestive enzymes. Mucosal epithelium also contains intraepithelial lymphocytes (IEL) that function like T killer cells (!p. 98). Transmitter substances permit reciprocal communication between IEL and neighboring enterocytes. Macrophages of the hepatic sinusoids (Kupffer’s cells) are additional bastions of immune defense. The physiological colonies of intestinal flora in the large intestine prevent the spread of pathogens. IgA from breast milk protects the GI mucosa of neonates.
Blood flow to the stomach, gut, liver, pancreas and spleen (roughly 30% of cardiac output) is supplied by the three main branches of the abdominal aorta. The intestinal circulation is regulated by local reflexes, the autonomic nervous system, and hormones. Moreover, it is autoregulatory, i.e., largely independent of systemic blood pressure fluctuations. Blood flow to the intestines rises sharply after meals (acetylcholine, vasoactive intestinal peptide VIP, etc. function as vasodilatory transmitters) and falls during physical activity (transmitters: norepinephrine, etc.). The venous blood carries substances reabsorbed from the intestinal tract and enters the liver via the portal vein. Some components of reabsorbed fat are absorbed by the intestinal lymph, which transports them to the greater circulation while bypassing the liver.
Despopoulos, Color Atlas of Physiology © 2003 Thieme
All rights reserved. Usage subject to terms and conditions of license.
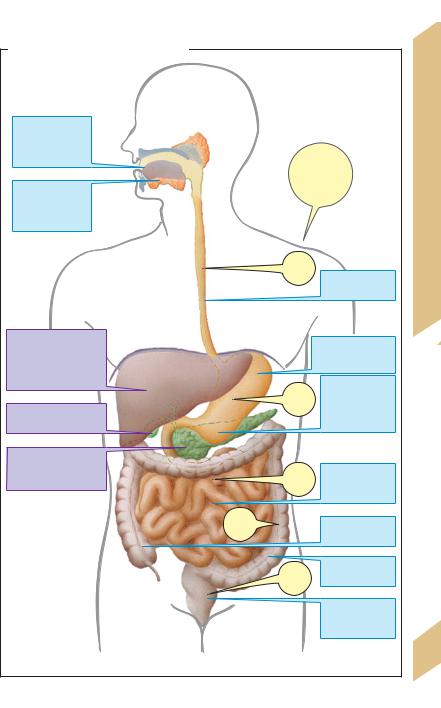
A. Function of gastrointestinal organs
Mouth:
taste,
chewing, formation of food bolus
Saliva:
lubrication,
rinsing, digestion
Liver:
bile (excretion, lipid digestion), metabolism, detoxification
Gallbladder: bile storage
Pancreas (exokrine): digestive enzymes, HCO3– as H+ buffer
25–30 h
Passage time (from time of food intake)
10s
|
Esophagus: |
|
|
transport |
|
|
Proximal stomach: |
|
|
storage |
|
1–3 |
Distal stomach: |
|
processing, |
||
h |
digestion, |
|
|
portioning |
|
7–9 |
Small intestine: |
|
digestion, |
||
h |
||
absorption |
||
|
||
|
Cecum: |
|
|
storage |
|
30–120 |
Colon: |
|
absorption |
||
h |
|
|
|
Rectum: |
|
|
storage, |
|
|
excretion |
(After Kahle, Leonhardt & Platzer)
Plate 10.4 GI Tract: Overviews, Defense, Blood Flow
233
Despopoulos, Color Atlas of Physiology © 2003 Thieme
All rights reserved. Usage subject to terms and conditions of license.

Neural and Hormonal Integration
|
Endocrine and paracrine hormones and neu- |
||||||
|
rotransmitters control GI motility, secretion, |
||||||
|
perfusion and growth. Reflexes proceed within |
||||||
|
the mesenteric and submucosal plexus (enteric |
||||||
|
nervous system, ENS ), and external innervation |
||||||
|
modulates ENS activity. |
|
|
||||
|
Local reflexes are triggered by stretch sen- |
||||||
|
sors in the walls of the esophagus, stomach |
||||||
|
and gut or by chemosensors in the mucosal |
||||||
Digestion |
epithelium and trigger the contraction or re- |
||||||
laxation of neighboring smooth muscle fibers. |
|||||||
Peristaltic reflexes extend further towards the |
|||||||
oral (ca. 2 mm) and anal regions (20–30 mm). |
|||||||
They are mediated in part by interneurons and |
|||||||
and |
|||||||
help |
to |
propel the contents of the lumen |
|||||
through the GI tract (peristalsis). |
|||||||
Nutrition |
|||||||
External |
innervation |
of |
the GI tract (cf. |
||||
p. 78ff.) |
comes from |
the |
parasympathetic |
||||
nervous system (from lower esophagus to as- |
|||||||
10 |
cending colon) and sympathetic nervous sys- |
||||||
tem. Innervation is also provided by visceral |
|||||||
|
|||||||
|
afferent fibers (in sympathetic or parasympa- |
||||||
|
thetic nerves) through which the afferent im- |
||||||
|
pulses for supraregional reflexes flow. |
||||||
|
ENS function is largely independent of external inner- |
||||||
|
vation, but external innervation has some advan- |
||||||
|
tages (a) rapid transfer of signals between relatively |
||||||
|
distant parts of the GI tract via the abdominal ganglia |
||||||
|
(short visceral afferents) or CNS (long visceral affer- |
||||||
|
ents); (b) GI tract function can be ranked subordinate |
||||||
|
to overall body function (c) GI tract activity can be |
||||||
|
processed by the brain so the body can become |
||||||
|
aware of them (e.g., stomach ache). |
||||||
|
Neurotransmitters. Norepinephrine (NE) is re- |
||||||
|
leased by the adrenergic postganglionic neu- |
||||||
|
rons, and acetylcholine (ACh) is released by |
||||||
|
pre- |
and |
postganglionic |
(enteric) fibers |
|||
|
(!p. 78ff.). VIP (vasoactive intestinal peptide) |
||||||
|
mediates the relaxation of circular and vascu- |
||||||
lar muscles of the GI tract. Metand leuenkephalin intensify contraction of the pyloric, ileocecal and lower esophageal sphincters by binding to opioid receptors. GRP (gastrin-re- leasing peptide) mediates the release of gastrin. CGRP (calcitonin gene-related peptide) stimulates the release of somatostatin (SIH).
234 |
All endocrine hormones effective in the GI |
|
tract are peptides produced in endocrine cells |
||
|
of the mucosa. (a) Gastrin and cholecystokinin
(CCK) and (b) secretin and GIP are structurally similar; so are glucagon (!p. 282ff.) and VIP. High concentrations of hormones from the same family therefore have very similar effects.
Gastrin occurs in short (G17 with 17 amino acids, AA) and long forms (G34 with 34 AA). G17 comprises 90% of all antral gastrin. Gastrin is secreted in the antrum and duodenum. Its release (!A1) via gastrin-releasing peptide
(GRP) is subject to neuronal control; gastrin is also released in response to stomach wall stretching and protein fragments in the stomach. Its secretion is inhibited when the pH of the gastric/duodenal lumen falls below 3.5 (!A1). The main effects of gastrin are acid secretion and gastric mucosal growth (!A2).
Cholecystokinin, CCK (33 AA) is produced throughout small intestinal mucosa. Longchain fatty acids, AA and oligopeptides in the lumen stimulate the release of CCK (!A1). It causes the gallbladder to contract and inhibits emptying of the stomach. In the pancreas, it stimulates growth, production of enzymes and secretion of HCO3– (via secretin, see below) (!A2).
Secretin (27 AA) is mainly produced in the duodenum. Its release is stimulated by acidic chyme (!A1). Secretin inhibits acid secretion and gastric mucosal growth and stimulates HCO3– secretion (potentiated by CCK), pancreatic growth and hepatic bile flow (!A2).
GIP (glucose-dependent insulinotropic peptide, 42 AA; formerly called gastric inhibitory polypeptide = enterogastrone) is produced in the duodenum and jejunum and released via protein, fat and carbohydrate fragments (e.g., glucose) (!A1). GIP inhibits acid secretion (!A2) and stimulates insulin release (this is why oral glucose releases more insulin than intravenous glucose).
Motilin (22 AA) is released by neurons in the small intestine and regulates interdigestive motility (!A1, 2).
Paracrine transmitters. Histamine, somatostatin and prostaglandin are the main paracrine transmitters in the GI tract.
Despopoulos, Color Atlas of Physiology © 2003 Thieme
All rights reserved. Usage subject to terms and conditions of license.

A. MGastrointge |
-Destinalrm-Hohormones |
|
|
|
|
|
|
|
|
|
|
|
||||
|
Stretch |
|
Peptides, |
|
|
H+ |
|
|
Neuronal |
Glucose |
|
Fatty acids |
|
|||
|
|
|
amino acids |
|
|
|
|
|
|
|
|
|
|
|
|
|
|
|
|
|
bits |
|
|
|
|
|
|
|
|
|
|
|
Integration |
|
|
|
inhi |
|
|
|
|
|
|
|
|
|
|
|
||
|
|
|
|
h |
|
|
|
|
|
|
|
|
|
|
|
|
|
|
|
GRP |
AC |
|
|
|
|
|
|
|
|
|
|
|
|
|
|
|
|
|
|
|
|
|
|
|
|
|
|
|
||
|
|
|
|
|
|
|
|
|
|
|
|
|
|
|
|
|
|
Gastrin |
|
|
|
Secretin |
|
|
Motilin |
GIP |
|
CCK |
|
Hormonal |
|||
|
|
|
|
|
|
|
|
|
|
|
|
|
|
|
Antrum |
|
|
|
|
|
|
|
|
|
|
|
|
|
|
|
|
and |
|
|
|
|
|
|
|
|
|
|
|
|
|
|
|
Duodenum |
||
|
|
|
|
|
|
|
|
|
|
|
|
|
|
|
|
|
|
|
|
|
|
|
|
|
|
|
|
|
|
|
|
Jejunum |
Neural |
|
|
|
|
|
|
|
|
|
|
|
|
|
|
|
|
|
|
|
|
|
|
|
|
|
|
|
|
|
|
|
|
Ileum |
10.5 |
|
|
|
|
|
|
|
|
|
|
|
|
|
|
|
|
|
1 Stimulus for release and site of secretion |
|
|
|
|
|
|
|
Plate |
||||||||
|
|
|
|
|
|
|
|
|
|
|
|
|
|
|
|
|
|
|
|
|
|
|
|
|
|
|
|
|
|
|
|
Stimulates |
|
|
|
|
|
|
|
|
|
|
|
|
|
|
|
|
Inhibits |
|
Acid secretion |
Pepsinogen secretion |
Motility (digestive) |
Motility (interdigestive) |
Emptying |
Mucosal growth |
secretion |
Enzyme secretion |
Growth |
Insulin secretion |
Bile flow |
secretion |
Gallbladder emptying |
Mucosal growth |
Motility (interdigestive) |
Satiety |
|
– |
– |
|
||||||||||||||
3 |
3 |
|
||||||||||||||
HCO |
HCO |
|
||||||||||||||
|
|
|
|
|
Stomach |
|
|
Pancreas |
Pancreas (B cells) |
|
Bile ducts |
Gallbladder |
|
Gut |
Brain |
235 |
2 Main effects of gastrointestinal hormones |
|
|
|
(Partly after L.R. Johnson) |
||||||||||||
|
|
|
|
|||||||||||||
Despopoulos, Color Atlas of Physiology © 2003 Thieme
All rights reserved. Usage subject to terms and conditions of license.

10 Nutrition and Digestion
236
Saliva
The functions of saliva are reflected by its constituents. Mucins serve to lubricate the food, making it easier to swallow, and to keep the mouth moist to facilitate masticatory and speech-related movement. Saliva dissolves compounds in food, which is a prerequisite for taste buds stimulation (!p. 338) and for dental and oral hygiene. Saliva has a low NaCl concentration and is hypotonic, making it suitable for rinsing of the taste receptors (NaCl) while eating. Infants need saliva to seal the lips when suckling. Saliva also contains α-amylase, which starts the digestion of starches in the mouth, while immunoglobulin A and lysozyme are part of the immune defense system (!p. 94ff.). The high HCO3– concentration in saliva results in a pH of around 7, which is optimal for α-amylase-catalyzed digestion. Swallowed saliva is also important for buffering the acidic gastric juices refluxed into the esophagus (!p. 238). The secretion of profuse amounts of saliva before vomiting also prevents gastric acid from damaging the enamel on the teeth. Saliva secretion is very dependent on the body water content. A low content results in decreased saliva secretion—the mouth and throat become dry, thereby evoking the sensation of thirst. This is an important mechanism for maintaining the fluid balance (!pp. 168 and 184).
Secretion rate. The rate of saliva secretion varies from 0.1 to 4 mL/min (10–250 µL/min per gram gland tissue), depending on the degree of stimulation (!B). This adds up to about 0.5 to 1.5 L per day. At 0.5 mL/min, 95% of this rate is secreted by the parotid gland (serous saliva) and submandibular gland (mucinrich saliva). The rest comes from the sublingual glands and glands in the buccal mucosa.
Saliva secretion occurs in two steps: The acini (end pieces) produce primary saliva (!A, C) which has an electrolyte composition similar to that of plasma (!B). Primary saliva secretion in the acinar cells is the result of transcellular Cl– transport: Cl– is actively taken up into the cells (secondary active transport) from the blood by means of a Na+-K+-2Cl– cotransport carrier and is released into the lumen (together with HCO3–) via anion chan-
nels, resulting in a lumen-negative transepithelial potential (LNTP) that drives Na+ paracellularly into the lumen. Water also follows passively (osmotic effect). Primary saliva is modified in excretory ducts, yielding secondary saliva. As the saliva passes through the excretory ducts, Na+ and Cl– are reabsorbed and K+ and (carbonic anhydrase-dependent) HCO3– is secreted into the lumen. The saliva becomes hypotonic (far below 100 mOsm/kg H2O; !B) because Na+ and Cl- reabsorption is greater than K+ and HCO3– secretion and the ducts are relatively impermeable to water (!B). If the secretion rate rises to values much higher than 100µL/(min · g), these processes lag behind and the composition of secondary saliva becomes similar to that of primary saliva (!B).
Salivant stimuli. Reflex stimulation of saliva secretion occurs in the larger salivary glands (!D). Salivant stimuli include the smell and taste of food, tactile stimulation of the buccal mucosa, mastication and nausea. Conditioned reflexes also play a role. For instance, the routine clattering of dishes when preparing a meal can later elicit a salivant response. Sleep and dehydration inhibit saliva secretion. Saliva secretion is stimulated via the sympathetic and parasympathetic nervous systems (!C2):
Norepinephrine triggers the secretion of highly viscous saliva with a high concentration of mucin via
"2 adrenoreceptors and cAMP. VIP also increases the cAMP concentration of acinar cells.
Acetylcholine: (a) With the aid of M1 cholinoceptors and IP3 (!pp. 82 and 274), acetylcholine mediates an increase in the cytosolic Ca2+ concentration of acinar cells. This, in turn, increases the conductivity of luminal anion channels, resulting in the production of watery saliva and increased exocytosis of
salivary enzymes. (b) With the aid of M3 cholinergic receptors, ACh mediates the contraction of myoepithelial cells around the acini, leading to emptying of the acini. (c) ACh enhances the production of kallikreins, which cleave bradykinin from plasma kininogen. Bradykinin and VIP (!p. 234) dilate the vessels of the salivary glands. This is necessary because maximum saliva secretion far exceeds resting blood flow.
Despopoulos, Color Atlas of Physiology © 2003 Thieme
All rights reserved. Usage subject to terms and conditions of license.
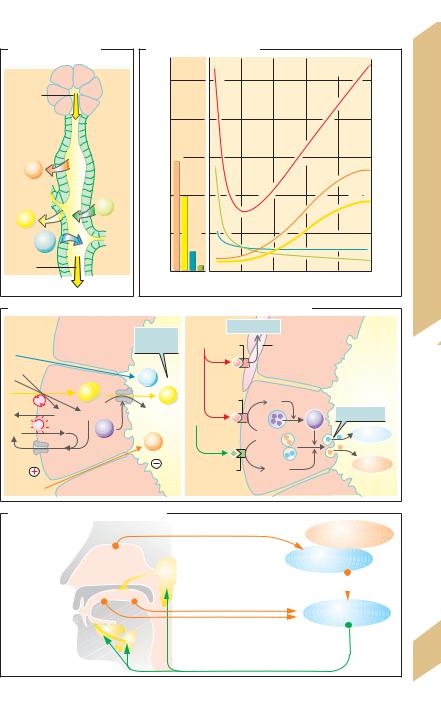
A. Saliva secretion |
|
Primary |
End- |
saliva |
piece |
|
with |
|
acinar cells |
|
Ductal |
|
system |
Na+ |
|
|
K+ |
Cl– |
|
HCO3– |
|
Secondary |
|
saliva |
|
|
B. Electrolytes in saliva |
|
|
|
|
|
|
|||
|
|
|
|
|
|
|
Osmolality |
|
|
|
(mmol/L) |
250 |
|
|
|
|
|
|
|
250 |
|
200 |
|
|
|
|
|
|
|
200 |
||
Electrolyteconcentration |
Cl |
|
|
|
|
|
|
|||
|
|
|
|
|
|
|
|
(mOsm/kgHOsmolality |
||
|
|
|
|
|
|
|
|
|
|
O) |
|
|
|
|
|
|
|
|
|
|
2 |
|
|
+ |
|
|
|
|
|
|
|
|
|
150 |
Na |
|
|
|
|
|
Na+ |
150 |
|
|
|
|
|
|
|
|
|
|
|
|
|
|
– |
|
|
|
|
|
|
|
|
|
100 |
|
|
|
|
|
|
Cl– |
100 |
|
|
50 |
– |
|
|
|
|
|
|
50 |
|
|
3 |
|
|
|
|
|
|
|
||
|
|
HCO |
|
|
|
|
HCO3– |
|
|
|
|
|
+ |
|
|
|
|
|
|
|
|
|
|
K |
|
|
|
|
|
K+ |
0 |
|
|
0 |
|
|
|
|
|
|
|
||
|
Plasma and |
0 |
50 |
100 |
150 |
200 |
250 |
|
||
|
primary saliva |
Saliva secretion ( L/min per g of gland tissue) |
||||||||
C. (1) Mechanism and (2) control of saliva secretion in acinar cells |
|
|||||
1 |
|
|
2 |
Contraction |
|
|
|
Acinar cell |
Primary |
ACh |
M3 |
Myoepithelial |
|
|
|
saliva |
|
|
||
|
|
|
|
|
cells |
|
|
|
H2O |
Norepinephrine |
|
|
|
|
Cl– |
Cl– |
M1 |
IP3 |
|
|
|
|
HCO3– |
|
|||
Na+ |
K+ |
|
Ca2+ |
Exocytosis |
||
ATP |
Ca2+ |
|
|
|
|
|
K+ |
Na+ |
|
|
|
Proteins |
|
|
|
|
|
|
|
|
|
|
Lumen |
|
β2 |
cAMP |
Mucin |
|
|
|
|
|||
Blood side |
|
Blood side |
|
|
Lumen |
|
|
|
|
|
|||
D. Stimulation of saliva secretion
|
|
|
|
|
|
|
Higher centers |
|
|
|
|
|
|
|
|
|
|
Stimuli |
|
|
|
|
|
|
Hypothalamus |
|
|
|
|
|
|
|
|
||
Smell |
|
|
|
|
|
Parotid gland |
|
|
|
|
|
|
|
|
|
||
Taste |
|
|
|
|
|
|
|
|
Touch |
|
|
|
|
|
|
Salivary center |
|
Mastication |
|
|
|
|
Sublingual gland |
|
|
|
|
|
|
|
|
|
|||
|
|
|
|
|
|
|
|
|
Nausea |
|
|
|
|
Submandibular |
Sympathetic and |
||
|
|
|
|
|||||
|
|
|
|
gland |
parasympathetic |
|||
etc. |
|
|
|
|
||||
|
|
|
|
|
|
activation |
||
|
|
|
|
|
|
|
||
|
|
|
|
|
|
|
|
|
Plate 10.6 Saliva
237
Despopoulos, Color Atlas of Physiology © 2003 Thieme
All rights reserved. Usage subject to terms and conditions of license.