


6.7 Time-of-Flight Ultrasonic Displacement Sensors
Teklic Ole Pedersen and Nils Karlsson
Ultrasound is an acoustic wave with a frequency higher than the audible range of the human ear, which is 20 kHz. Ultrasound can be within the audible range for some animals, like dogs, bats, or dolphins. In the years around 1883, Sir Francis Galton performed the first known experiments with whistles generating ultrasound. Many decades later, people started to find ultrasound applications in engineering, medicine, and daily life. The basic principle for the use of ultrasound as a measurement tool is the time-of-flight technique. The pulse-echo method is one example. In the pulse-echo method, a pulse of ultrasound is transmitted in a medium. When the pulse reaches an another medium, it is totally or partially reflected, and the elapsed time from emission to detection of the reflected pulse is measured. This time depends on the distance and the velocity of the sound. When sound travels with a known velocity c, the time t elapsed between the outgoing signal and its incoming echo is a measure of the distance d to the object causing the echo.
d = |
ct |
(6.82) |
|
||
2 |
|
|
Figure 6.61 shows a simple pulse-echo system. The transmitter and the receiver could be the same device, but they are separated for clarity in this figure.
The oscillator generates an electric signal with a typical frequency of 40 kHz. This electric signal is transformed into mechanical vibrations of the same frequency in the transmitter. These vibrations generate sound waves that are reflected by the object. The reflected sound echo causes an electric signal in the receiver. For precise measurements, the speed of sound is a crucial parameter. A typical value in air at 1 atm pressure and room temperature is 343 m s–1, but the speed of sound is influenced by air pressure, air temperature, and the chemical composition of air (water, CO2, etc.). For example, the speed of sound is proportional to the square root of absolute temperature. Measuring distances in an environment with large temperature gradients can result in erroneously calculated distances. As an advantage, ultrasound waves are robust against other disturbances such as light, smoke, and electromagnetic interference [1–4].
Physical Characteristics of Sound Waves
Sound is a vibration in matter. It propagates as a longitudinal wave, i.e., the displacement in the material is in the direction of the sound wave propagation. A plane wave that propagates in the x direction can be described by
æ |
x ö |
|
|
Dx = Asinwçt - |
|
÷ |
(6.83) |
|
|||
è |
c ø |
|
|
where A is the amplitude, ω = 2πf, f being the frequency of the wave and |
x is the displacement of a |
||
particle at time t at the position x. |
|
|
|
The velocity of sound depends on the medium in which it propagates. In a homogeneous and isotropic solid, the velocity depends on the density ρ and the modulus of elasticity E according to Equation 6.84.
c = |
E |
(6.84) |
|
r |
|||
|
|
In a liquid, the velocity depends on the density and the adiabatic compressibility K, Equation 6.85.
© 1999 by CRC Press LLC
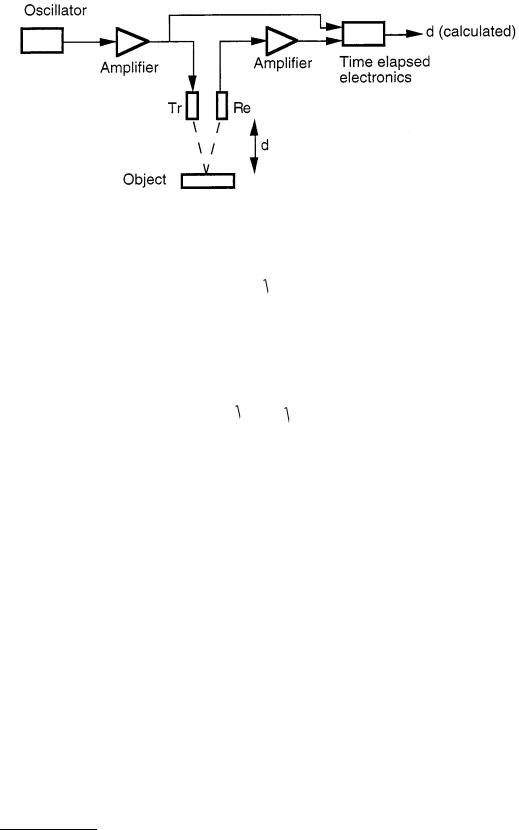
FIGURE 6.61 Principle of a pulse-echo ultrasound system for distance measurements (Tr = transmitter, Re = receiver).
c = |
1 |
(6.85) |
|
Kρ |
|||
|
|
In gases, the velocity of sound is described by Equation 6.86. Here g represents the ratio of the specific heat at constant pressure (cp) to the specific heat at constant volume (cv), p is pressure, R is the universal gas constant, T is the absolute temperature, and M is the molecular weight.
c = |
gRT |
= |
cp |
|
p |
(6.86) |
M |
cv |
|
ρ |
|||
|
|
|
|
An important quantity is the specific acoustic impedance. It is, in general, a complex quantity but in the far field (Figure 6.63), the imaginary component disappears, leaving a real quantity. This real quantity is the product of the density ρ and the sound speed c in the medium. This product is called the characteristic impedance Ra (Equation 6.87).
Ra = ρc |
(6.87) |
The characteristic impedance is thus independent of the sound frequency.
An acoustic wave has an intensity I (rate of flow of energy per unit area), which can be expressed in watts per square meter (W m–2). A usually unwanted phenomenon arises when the sound wave has to pass from one medium with characteristic impedance R1 to another medium with characteristic impedance R2. If R1 and R2 have different values, a part of the wave intensity will reflect at the boundary between the two media (see Figure 6.61 and 6.62). The two media are said to be mismatched, or poorly coupled, if a major part of the wave intensity is reflected and a minor part is transmitted. The relative amounts of reflected and transmitted wave intensities can be defined by:
Reflection coefficient = |
|
Irefl |
|
(6.88a) |
|
Iincident |
|||||
|
|
||||
Transmission coefficient = |
Itrans |
(6.88b) |
|||
|
|
||||
Iincident
© 1999 by CRC Press LLC

FIGURE 6.62 Reflection and transmission of a sound wave at the interface between media of different characteristic impedances.
It can be shown [1] that these coefficients have simple relations to the previously mentioned characteristic impedances.
Reflection coefficient = |
(R1 |
− R2 )2 |
(6.89a) |
||
(R1 |
+ R2 )2 |
|
|||
Transmission coefficient = |
|
4R1R2 |
(6.89b) |
||
(R1 + R2 )2 |
|||||
The practical importance of the acoustic impedance is realized when the ultrasonic pulse-echo system shown in Figure 6.61 is considered. First, the electric energy is converted into mechanical vibrations of a membrane in the transmitter. Second, the vibrations (the sound wave) have to pass through the boundary between the membrane (usually a solid material) and free air. Because the transmitter membrane and the free air have different characteristic impedances, much of the acoustic intensity is reflected (Figure 6.62).
The transmitted ultrasound in free air will first propagate in a parallel beam (near field of the transducer); but after a distance L, the beam diverges (the far field of the transducer). See Equation 6.90 and Figure 6.63.
L ≈ |
D2 |
(6.90) |
|
4λ |
|||
|
|
D is the diameter of the circular transmitter and λ is the wavelength of the ultrasound.
The sound intensity in the near field is complicated due to interference effects of sound originating from different parts of the transducer membrane. In the far field, the intensity is approximately uniform and the beam spread follows:
sinβ = 1.22 |
λ |
(6.91) |
|
D |
|||
|
|
where β is the half lobe angle.
© 1999 by CRC Press LLC
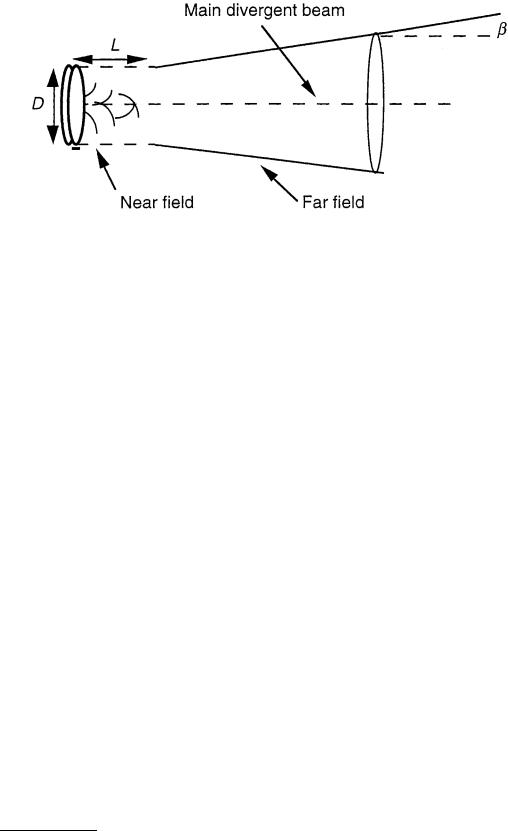
FIGURE 6.63 Illustration of the ultrasound beam in the near field and the far field of the transducer.
To get a narrow beam, the transmitter membrane diameter must be large with respect to the wavelength. High-frequency ultrasound cannot be the general solution as ultrasound of a high frequency is absorbed faster than ultrasound of a low frequency [1–4].
Ultrasound Transducers
Most ultrasound transducers convert electric energy to mechanical energy and vice versa. The most common types of in-air transducers are [5–7]:
1.Mechanical
2.Electromagnetic
3.Piezoelectric
4.Electrostatic
5.Magnetostrictive
The simplest type, mechanical transducers such as whistles and sirens, are used up to approximately 50 kHz. This type works only as a transmitter.
Electromagnetic transducers such as loudspeakers and microphones can be used for ultrasonic wave generation, but they are mainly suited for lower frequencies.
The piezoelectric transducer (Figure 6.64) is more suitable for use in ultrasonics and is quite common. It uses a property of piezoelectric crystals: they change dimensions when they are exposed to an electric field. When an alternating voltage is applied over the piezoelectric material, it changes its dimensions with the frequency of the voltage. The transducer is mainly suited for use at frequencies near the mechanical resonance frequency of the crystal. The piezoelectric transducer can be both a transmitter and a receiver: when a piezolectric material is forced to vibrate by a sound pulse, it generates a voltage. Some natural crystals, such as quartz, are piezoelectric. Ceramics can be polarized to become piezoelectric; so can some polymers like PVDF (polyvinylidene fluoride). Polymers are suitable as transducers in air since their acoustic impedance is low [8–10] compared with other standard piezoelectric materials.
The electrostatic transducer (Figure 6.64) is a plate capacitor with one plate fixed and the other free to vibrate as a membrane. When a voltage is applied between the plates, the electrostatic forces tend to attract or repel the plates relative to each other depending on the polarity of the voltage. This transducer can be used both as a transmitter and a receiver [11].
The magnetostrictive transducer is based on the phenomenon of magnetostriction, which means that the dimensions of a ferromagnetic rod change due to the changes of an externally applied magnetic field. This transducer can also act as both a receiver and a transmitter.
© 1999 by CRC Press LLC
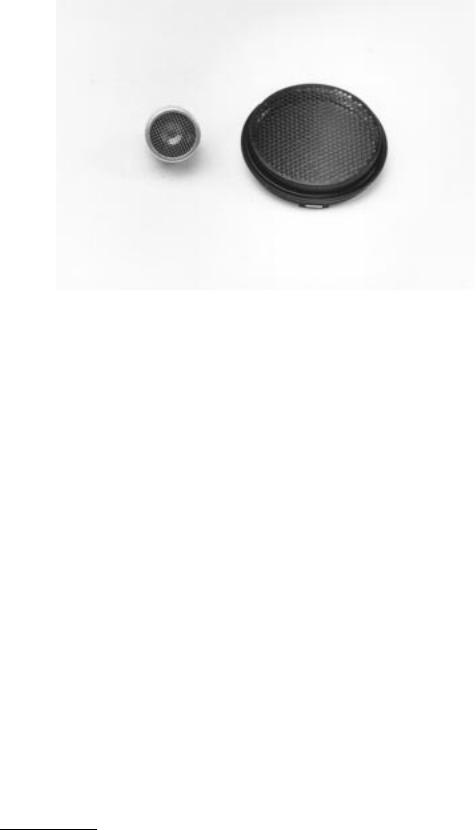
FIGURE 6.64 Ultrasonic transducers piezoelectric (left) and electrostatic (right).
Principles of Time-of-Flight Systems
There are several techniques for ultrasonic range measurements [12–15].
The previously described pulse echo method is the simplest one. Usually, this method has a low signal- to-noise ratio (SNR) because of the low transmitted energy due to the short duration of the pulse. Multireflections are detectable.
In the phase angle method, the phase angle is measured between the continuous transmitted signal and the continuous received signal and is used as a measure of the distance. The method is relatively insensitive to disturbances. Multireflections are not detectable in a meaningful way. When the distance is longer than one wavelength, another method must be used to monitor the distance.
The frequency modulation method uses transmitted signals that are linearly frequency modulated. Thus, detected signals are a delayed replica of the transmitted signal at an earlier frequency. The frequency shift is proportional to the time-of-flight. The method is robust against disturbing signals, and multireflections are detectable.
The correlation method (Figure 6.65) determines the cross-correlation function between transmitted and received signals. When the transmitted signal is a random sequence, i.e., white Gaussian noise, the cross-correlation function estimates the impulse response of the system, which, in turn, is a good indicator of all possible time delays. The method is robust against disturbances, and multireflections are detectable.
Industrial acoustic noise can affect the received signals in an ultrasound time-of-flight system. The noise can be generated from leaking compressed air pipes, noisy machines, or other ultrasonic systems. This external noise is not correlated with the relevant echo signals of the transmitted noise and can therefore be eliminated by the use of correlation methods. Disturbances correlated with the relevant echo signal (e.g., unwanted reflections) will not be eliminated by the use of correlation methods.
The impulse response h(t,t0) is used as a sensitive indicator of time delay between transmitted signal at time t0 and received signal at time t . The impulse response is given by [14]:
h(t, t0 ) = F |
é |
ù |
|
|
−1 ê |
Sxy |
ú |
(6.92) |
|
|
||||
|
êSxx ú |
|
||
|
ë |
û |
|
|
© 1999 by CRC Press LLC
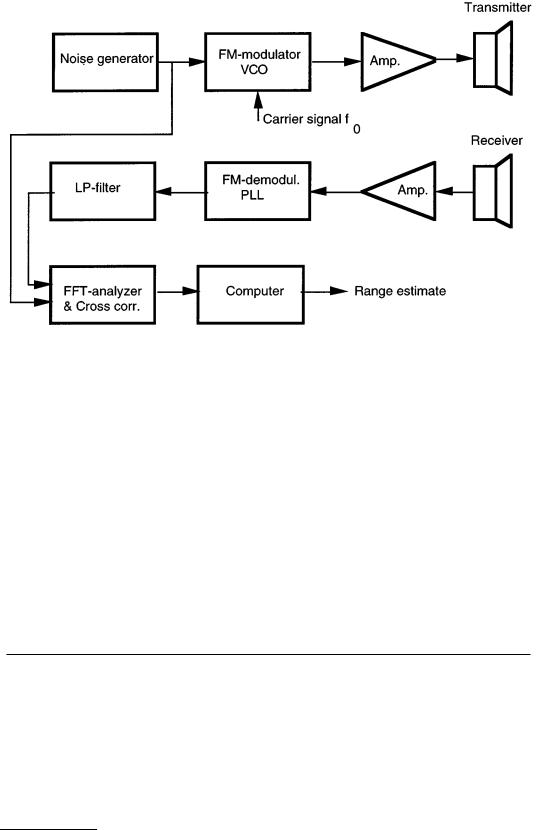
FIGURE 6.65 Diagram of a correlation-based time-of-flight system.
where F–1 is the inverse Fourier transform, x is the transmitted signal, y is the received signal, Sxy (f) is the cross-spectral density function [the Fourier transform of the cross-correlation function of the transmitted signal x(t) and the received signal y(t)] and Sxx is the power density function (the Fourier transform of the auto-correlation function of the transmitted signal).
To analyze the transfer channel by data acquisition requires a high sampling rate, theoretically at least two times the highest frequency component in the received signal (and in practice as high as 10 times the highest frequency). One way to reduce the sampling rate is to first convert the signal from its bandpass characteristics around a center frequency f0 (approx. 50 kHz) to lowpass characteristics from dc to B/2, where B is the appropriate bandwidth. The accuracy of the range estimate, and hence the time interval t – t0 , can be improved by processing the estimate of the impulse response h(t – t0) with a curve-fitting (least square) method and digital filtering in a computer. A block diagram of a correlation-based time- of-flight system is shown in Figure 6.65. Further details and complete design examples can be found in the literature [12–15].
Table 6.17 lists some advantages and drawbacks of the described time-of-flight methods.
TABLE 6.17 Advantages and Disadvantages of Time-of-Flight Methods
Method |
Main advantage |
Main disadvantage |
|
|
|
Pulse echo method |
Simple |
Low signal-to-noise ratio |
Phase angle method |
Rather insensitive to disturbances |
Cannot be used directly at distances longer than the |
|
|
wavelength of the ultrasound |
Frequency modulation |
Robust against disturbances; |
Can give ambigous results |
method |
multireflections detectable |
measurements on long and short distances can give the |
|
|
same result (compare with phase angle method) |
Correlation method |
Very robust against disturbances |
Make relatively high demands on hardware and/or |
|
|
computations |
|
|
|
© 1999 by CRC Press LLC