

Kluwer - Handbook of Biomedical Image Analysis Vol
.1.pdfWavelets in Medical Image Processing |
325 |
multiscale framework for spatial-frequency adaptation and solve certain noise amplification problems. For a better separation of noise and signal components in the transform domain, other multiscale representations have also been widely investigated. Examples of such multiscale representations can be found in Section 6.2.3.
The magnitude of the wavelet coefficients is related to the correlations between the signal and the wavelet basis function, which is the only criterion to determine whether or not noise variation appears. Therefore, the selection of the wavelet basis is a critical step in the design of the denoising and enhancement procedure. Wavelet basis constructed from derivatives of spline functions [46] were shown to have many advantages in denoising and enhancement. Such wavelet functions, either symmetric or antisymmetric, are smooth with compact support. Higher order spline function resembles Gaussian function, therefore providing ideal spatial-frequency resolution for signal analysis. Moreover, moduli of wavelet coefficients using first-derivative spline wavelets are proportional to the magnitude of a gradient vector [47]. Analysis over such modulus therefore provides extra information on directional correlations, and is especially important for three or higher dimensional data analysis. Other wavelet basis functions have also been developed to provide specific adaptation to different type of signals. To name a few, slantlet [48], curvelet [49, 50], and ridgelet [51] were designed to improve the correlations with edge information and were used for edge-preserved denoising, while Fresnelets functions, based on B-spline functions [52], were designed for processing of digital holography.
In a parallel direction, many research works on multiscale denoising focused on improving thresholding operators. In the following discussion, “thresholding operator” is a rather general concept that includes both denoising and enhancement operators as described before. A determination of thresholding method includes both selection of the thresholding operator and a decision or estimation of the threshold parameters (threshold level, enhancement gain, etc.). Some examples of thresholding operators designed to improve the basic thresholding rules as shown in Eqs. (6.36)–(6.38) include the non-negative garrote thresholding [53]:
ρTG (x) |
|
0, |
T2 |
if |
|x| ≤ T , |
(6.42) |
|
|
|
|
− |
|
|
| | |
|
|
= x |
|
|
, if |
x > T |
|
|
x
326 |
|
|
|
|
|
|
|
|
Jin, Angelini, and Laine |
|
and the SCAD thresholding [53, 54]: |
|
|
|
|
|
|||||
|
= |
|
|
− |
− |
− |
|
if |
|x| ≤ |
| | ≤ |
|
|
|
sign(x)max(0, |x| − T), |
|
|
2T |
||||
ρTSCAD(x) |
|
((α |
|
1)x αTsign(x))/(α |
|
2), |
if |
2T < |
x αT. (6.43) |
|
|
|
|
|
|
|
|
|
if |
|x| > αT |
|
|
|
x, |
|
|
|
|
||||
On the other hand, cross-validation [55–57] and recursive hypothesis testing procedure [58] were investigated for automatically determining the threshold level T.
6.3.5 State-of-the-Art and Applications
In this section, we review two examples of multiscale denoising. To illustrate the power of multiscale analysis, two extreme cases of medical imaging modalities (ultrasound and PET/SPECT) with high noise level and complicated noise patterns were considered. A more detailed description of these clinical applications can be found in [59, 60].
6.3.5.1Spatial-Temporal Analysis of Real-Time 3D Cardiac Ultrasound Using Brushlet [59]
Recent development of a real-time three-dimensional (RT3D) ultrasound imaging modality that captures an entire cardiac volume instantaneously with fixed geometric parameters over a complete cardiac cycle raises new issues and challenges for denoising and volume extraction. On one hand, resolution of RT3D is lower than with previous 2D and 3D generations of ultrasound modalities and the level of speckle noise is very high. On the other hand the amount of information recorded per cardiac cycle is much more as this is a true 3D+time modality. Because of the fast acquisition time and the true three-dimensional nature of the transducer, there exists a strong coherence of surfaces in 3D space and time for echocardiograms recorded from moving cardiac tissue that should be exploited for optimal denoising and enhancement.
A simple observation of ultrasound images reveals the absence of true boundaries between the blood cavity and the myocardium muscle tissue. The myocardial wall is rather depicted as a field of bright moving texture and the denoising problem can therefore be approached as a texture characterization task. Approaches for texture classification and denoising can be divided into structural
Wavelets in Medical Image Processing |
327 |
and statistical methods adapted respectively to macroand micro-textural elements. Recent work on texture characterization and more specifically denoising of ultrasound data via spatio-temporal analysis include steerable filters and Gabor oriented filters [61, 62]. Both techniques are nonorthogonal and therefore suffer from noncomplete partitioning of the Fourier domain. As we showed in previous section, brushlets allow more flexibility on the partitioning of the Fourier domain and work with an orthogonal basis that provides perfect reconstruction of an original signal. In this application, modifications from the original implementation, which extended the analysis to three and four dimensions and performed the analysis in an overcomplete framework, have been made.
Brushlet basis functions decompose an N-dimensional signal along specific spatial-directions via analysis of its Fourier domain. As they only depend on spatial-frequency content, brushlet decompositions are invariant to the intensity or contrast range in the original data. This makes them very suitable and a powerful basis for the analysis of RT3D ultrasound where choosing a single global-intensity-based edge threshold is not possible due to position-dependent attenuation of the signal. There are as many basis functions as there are subintervals in the Fourier domain defining brushstrokes associated with the center frequency of each interval. The tiling of the Fourier domain therefore determines the resolution and orientation of the brushlet basis functions as illustrated in Fig. 6.12(a).
The resolution of each brushstroke is inversely proportional to the size of the interval, as illustrated in Fig. 6.12(b). The major difference between the brushlet basis and wavelet packets is the possibility of any arbitrary tiling of the time–frequency plane and the perfect localization of a single frequency in one coefficient.
Spatial Denoising via Thresholding. Denoising was performed via thresholding of the brushlet coefficients. In the case of RT3D ultrasound, speckle noise components are concentrated in the high-frequency coefficients without specific direction whereas cardiac structures are decomposed into the low-frequency components along different orientations. Decorrelation of signal and noise in the frequency domain was therefore performed by removing the higher frequency components and thresholding only the lower frequency components prior to reconstruction. Denoising performance was compared for processing in 2D and

328 |
|
|
|
Jin, Angelini, and Laine |
|||
|
|
|
|
|
|
|
|
|
|
ln/2 |
|
|
LN=32 an=16 ln=8 |
LN=32 an=16 ln=16 |
|
|
|
|
hm/2 |
|
|
|
|
|
|
Orientation |
|
|
|
|
|
|
|
|
|
|
|
|
|
|
|
angle |
|
|
(a.1) |
(a.2) |
|
|
|
0,0 |
|
|
LN=64 an=32 ln=8 |
LN=64 an=32 ln=16 |
|
|
|
|
|
|
|||
|
|
Tiling of |
|
|
|
|
|
|
|
Fourier Plane |
|
|
|
|
|
|
|
|
|
|
(b.1) |
(b.2) |
|
|
|
|
|
|
|
|
|
|
|
(a) |
|
|
|
(b) |
|
Figure 6.12: (a) Orientation and oscillation frequency of brushlet analysis functions in 2D. The size of each subquadrant in the Fourier plane determines the resolution of the analysis function while the position of the subquadrant center determines the orientation of the analysis function. (b) Illustration of selected brushlet orientation and oscillation frequencies. Fourier plane size L N , center frequency an, and subintervals size ln are provided for each 2D brushlet basis function.
3D to demonstrate the advantage of extending the brushlet analysis to 3D as illustrated in Fig. 6.13, for a set of six long-axis and six short-axis slices.
Qualitatively, it was observed that the third dimension improved the quality of the denoised data in terms of spatial resolution at the cost of losing some contrast. When compared to 2D denoising, 3D denoising produced smoother features with better-localized contours. Specifically, small local artifacts not persistent in adjacent slices were eliminated and inversely weak contours persistent in adjacent slices were enhanced. This phenomenon can be best appreciated in the short-axis examples where the resolution is the lowest.
Improving Denoising by Including Time: Results on a Mathemati-
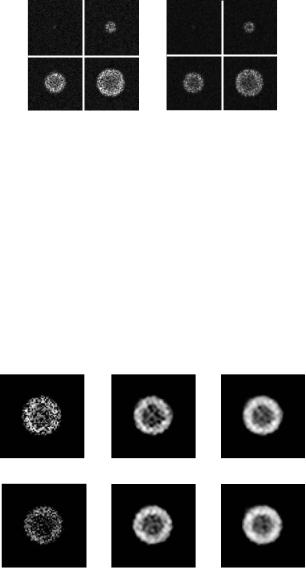
cal Phantom. To quantitatively evaluate potential denoising performance improvement brought about by including the temporal dimension, initial testing was performed on a mathematical phantom. The phantom, plotted in Fig. 6.14, consisted of an ovoid volume growing in time that schematically mimicked aspects of the left ventricle with an inner gray cavity surrounded by a thick white

Wavelets in Medical Image Processing |
329 |
Original
2D Denoising
3D Denoising
(a)
Original
2D Denoising
3D Denoising
(b)
Figure 6.13: 2D versus 3D spatial denoising on RT3D ultrasound data. (a) Series of six consecutive short-axis slices extracted from a clinical data set. (b) Series of six consecutive long-axis slices extracted from the same clinical data set.
wall on a black background. The size of a single volume was 64 × 64 × 64 and there were 16 frames growing in time. The volume increased by 70% over 16 time frames, similar to the average ejection fraction in normal patients.
The phantom was corrupted with two types of noise: (1) multiplicative speckle noise with uniform distribution and (2) multiplicative speckle noise with Rayleigh distribution.
The level of speckle noise was set so that the signal-to-noise ratio (SNR) of the noisy data was equal to −15 dB. Cross-sectional slices through a single volume of the noisy phantoms are displayed in Fig. 6.15.
|
|
Time |
1 |
8 |
16 |
Figure 6.14: Mathematical phantom. Ovoid volume with 16 frames growing in
time.
330 |
Jin, Angelini, and Laine |
(a) |
(b) |
Figure 6.15: Mathematical phantom corrupted with speckle noise. (a) Speckle noise with uniform distribution. (b) Speckle noise with Rayleigh distribution.
Denoising was carried out with both 3D and 4D brushlet analyses. Regular tiling was applied with four subintervals in each dimension. Volumes were reconstructed after resetting the higher frequency coefficients and hard thresholding the lower frequency coefficients at 25% of their maxima. Results for a single slice are provided in Fig. 6.16.
These results revealed that inclusion of the temporal dimension greatly improved the denoising performance. From a qualitative point of view, the contrast
-15 db |
6.6 db |
17 db |
(a.1) |
(a.2) |
(a.3) |
-15 db |
7.5 db |
16.3 db |
(b.1) |
(b.2) |
(b.3) |
|
|
|
Figure 6.16: Denoising of mathematical phantom with 3D and 4D brushlet analyses. (a) Results for phantom corrupted with uniformly distributed speckle noise. (b) Results for phantom corrupted with Rayleigh distributed speckle noise. ((a.1)–(b.1)) Original slices. ((a.2)–(b.2)) Slices denoised with 3D brushlet expansion. ((a.3)–(b.3)) Slices denoised with 4D brushlet expansion. SNR values are indicated for each slice.
Wavelets in Medical Image Processing |
331 |
of the denoised slices improved and with a better definition of borders and more homogeneity inside the white and gray areas. Quantitatively, SNR values improved by 50% between 3D and 4D denoising.
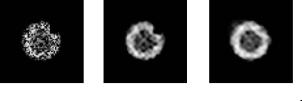
A second motivation for performing multidimensional analysis on cardiac clinical data is to take full advantage of the continuity of spatial and temporal frequency content of multidimensional RT3D signals. The high level of speckle noise in ultrasound clinical data sets recorded with the real-time 3D transducer, the nonuniform absorption coefficients of cardiac tissues, and the motion of the heart contribute to the addition of artifacts that can either add echolike signals inside the cavity or suppress echo signals from the myocardium wall. These artifacts complicate the segmentation task by introducing artificial edges inside the cavity or destroying edges at the epicardial and endocardial borders. Since these artifacts are not persistent in time, inclusion of the temporal component in the analysis helps resolve them. To illustrate the aptitude of the brushlet analysis to provide missing contour information, the previous mathematical phantom was modified by removing a part of the white wall in the eighth time frame. Both 3D analysis on the time frame with the defect and 4D brushlet analysis applied to the 16 time frames were computed after corruption with Rayleigh speckle noise. Results are displayed in Fig. 6.17.
Results showed a remarkable correction of the wall defect with the 4D (3D+time) brushlet denoising that could not be obtained with 3D analysis alone. This type of artifact is similar to the dropouts in echo signals that result in loss of myocardium tissue in some frames or the introduction of tissuelike signals inside the cavity. Such artifacts are not persistent in time and could be removed with the inclusion of temporal dimension in the denoising process.
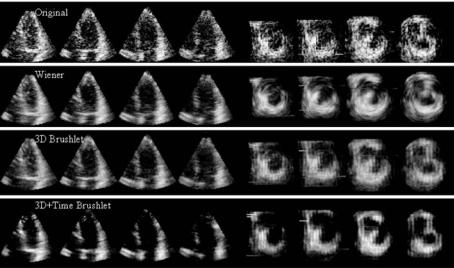
Finally, experiments on clinical data sets, as illustrated in Fig. 6.18, showed the superior performance of spatio-temporal denoising versus simple spatial
(a) |
(b) |
(c) |
|
|
|
Figure 6.17: (a) Original noisy slice with defect, (b) denoised slice with 3D
brushlet analysis, and (c) denoised slice with 4D brushlet analysis.
332 |
Jin, Angelini, and Laine |
Figure 6.18: Spatio-temporal denoising with brushlet expansion on RT3D ultrasound data illustrated on four long-axis and four short-axis slices.
denoising and Wiener filtering on RT3D ultrasound data. Adding the time dimension leads to images with better contrast and sharper contours while preserving the original textural aspect of the ultrasound data. Wiener filtering provided good results but introduced blurring artifacts that severely altered the quality of the short-axis denoised images. This type of artifact is unacceptable in medical applications where anatomical structure detail needs to be preserved. It was also observed that the epicardium borders were enhanced with sharper contrast when combining brushlet spatial and temporal denoising. Such enhancement is very desirable for quantification of LV mass and wall thickness analysis that requires segmentation of both the myocardial endocardial and epicardial borders.
6.3.5.2 Cross-Scale Regularization for Tomographic Images [60]
Tomographic image modalities such as PET and SPECT rely on an instable inverse problem of spatial signal reconstruction from sampled line projections. Tomographic reconstruction includes backprojection of the sinogram signal via Radon transform and regularization for removal of noisy artifacts. Because the Radon transform is a smoothing process, backprojection in the presence of additive noise is an ill-posed inverse problem that requires a regularization of the reconstructed noise component, which can become very large. Standard
Wavelets in Medical Image Processing |
333 |
regularization methods include filtered backprojection (FBP) with nonlinear filtering corrections, expectation-maximization and maximum a posteriori estimators [63–66]. The most commonly used tomographic reconstruction method combines a low-pass filter, for noise suppression, and a ramp filter for standard filtered backprojection algorithm. The cut-off frequency of the low-pass filter controls the balance between SNR and spatial resolution. While high-frequency noise is eliminated after low-pass filtering, useful high-frequency information, such as sharp varied signals and edges, is also attenuated. In addition, noise components in low-frequency bands still exist. For these two reasons, tomographic images reconstructed with FBP algorithms often suffer from over-smoothness or/and low SNR. Post-processing including denoising and enhancement is therefore helpful in improving image qualities for reliable clinical interpretation.
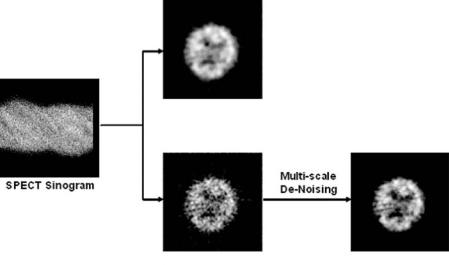
As low-pass filtering has always been considered one of the most fundamental denoising techniques, embedding a multiscale denoising module to partially replace the low-pass filtering operator in the FBP algorithm can potentially improve the image quality of reconstruction in terms of both spatial resolution and signal-to-noise ratio. The intuitive approach to combine FBP and denoising is therefore to preserve more high-frequency features during the FBP reconstruction by using a low-pass filter with higher cut-off frequency, or removing the lowpass prefiltering. The noise mixed with the high-frequency signal components is then further processed via a multiscale denoising operator. An illustration of the denoising performance is provided in Fig. 6.19 for simple comparison between traditional FBP using a clinical console (low-pass filter using Hann filter with cutoff frequency set to 0.4) and the proposed two-step processing. It can be observed that the second method, based on FBP using Hann filter with a higher cut-off frequency, generates a reconstructed image containing more detailed information as well as more significant noisy features. After multiscale denoising (combining wavelet packets thresholding and brushlet thresholding), image quality markedly improved, showing more anatomical details and spatial information.
Thresholding on Three-Dimensional Wavelet Modulus. Both PET and SPECT image reconstructed using FBP display strong directional noise patterns. Most feature-based denoising methods, including wavelet thresholding, are based on edge information and are not suited to directional noise components that resemble strong edges. Indeed, edge information alone cannot accurately separate noise from meaningful signal features in a single image. A novel approach to overcome this limitation is to apply the multiscale analysis and
334 |
Jin, Angelini, and Laine |
FBP with Hann (0.4)
|
|
Multiscale |
|
SPECT Sinogram |
|||
|
Denoising |
||
|
|
|
FBP with Hann (0.7)
Figure 6.19: Illustration, on a clinical brain SPECT slice, of the combination of multiscale denoising and traditional FBP with higher cut-off frequency to improve tomographic reconstruction.
denoising scheme using three-dimensional wavelet expansion that integrates edge information along continuous boundaries in 3D space. In three dimensions, such integration can accurately separate anatomical surfaces from noisy components that do not exhibit a directional pattern across adjacent tomographic slices. Unlike traditional wavelet denoising techniques, thresholding was performed on the modulus of the wavelet coefficients (“wavelet modulus”). A first derivative of the cubic spline function was used for the wavelet basis function which approximates the first derivatives of a Gaussian function and therefore benefits from the following properties:
1.By the uncertainty principle [14], the Gaussian probability density function is optimally concentrated in both time and frequency domains, and thus is suitable for time–frequency analysis.
2.Derivatives of Gaussian function can be used for rotation-invariant processing [67].
3.The Gaussian function generates a causal (in a sense that a coarse scale depends exclusively on the previous finer scale) scale space. This makes scale-space “tracking” of emergent features possible [68].