

Biomedical EPR Part-B Methodology Instrumentation and Dynamics - Sandra R. Eaton
.pdf332 |
DEREK MARSH ET AL. |
relaxation enhancements and slow exchange processes. Both of these aspects have assumed considerable importance in stuctural and dynamic studies of biological membranes. The former is an essential part of site-directed spinlabelling methodology.
Approximate solutions of the Bloch equations that explicitly include the Zeeman modulation field (see section 4 and Páli et al., 1996) yield the following approximate expressions for the different out-of-phase dispersion  and absorption
  displays, where n is the harmonic with respect to the Zeeman modulation frequency and the prime indicates out-of-phase detection. To illustrate simply the dependence on
  and
and  times, the effects of molecular motion are neglected.
The amplitude of the first-harmonic dispersion measured at the centre of the resonance is (Marsh et al., 1997):
where  is the amplitude of the modulation field,
  that of the microwave field and
  is the electron gyromagnetic ratio. The sensitivity of the
  amplitude to
  therefore does not extend beyond that of the conventional saturation factor
  The amplitude of the first-harmonic absorption measured at a distance from the resonance position that is equal to the zeroth harmonic linewidth
  is (Marsh et al., 1997):
where the amplitude at the centre of the line is zero. This displays a considerably greater sensitivity to  than does
  or the conventional in-phase adsorption spectrum,
  The amplitude of the second harmonic out-of-phase absorption spectrum is given by (Marsh et al., 1997):
This spectral display corresponds to the standard second-harmonic saturation transfer spectroscopy. Again, as for the first-harmonic, the second-harmonic out-of-phase absorption signal possesses an additional sensitivity to 

SATURATION TRANSFER SPECTROSCOPY |
333 |
beyond that expressed simply by the saturation factor. The first and secondharmonic non-linear absorption ESR spectra therefore both possess a sensitivity to  processes superior to that of conventional progressive saturation experiments, which are performed on the in-phase
 As seen from Fig. 8, the first-harmonic out-of-phase
  has advantages over the second-harmonic out-of-phase
  for determining
  enhancements. The
  depends far less on the
  time than does the
  As will be seen in Section 7.2, it is also insensitive to molecular motion. This makes it an almost pure
  and, as seen below, this is the nonlinear display of choice for studies of spin-lattice relaxation enhancement.
Figure 8. Dependence of the amplitude of: A. the first-harmonic (Eq. 35) and B. the secondharmonic (Eq. 36) out-of-phase EPR absorption signals on  time, for the values of
  indicated. Amplitudes are normalised to the in-phase absorption signal.
  (and
(and  for
for  ) (see Marsh et al., 1997).
Below follows a description of studies of the  of the different nonlinear spin-label EPR displays. Particular attention is paid to the use of integrated intensities in the analysis, and also to the effects of molecular motion in the progressive saturation and out-of-phase first harmonic absorption experiments. For the latter two methods, detailed spin-
334 |
DEREK MARSH ET AL. |
lattice relaxation time calibrations of the spectral intensities are presented in the Appendix to this chapter.
7.1Progressive Saturation  Experiments
The saturation behaviour of the integrated intensity of the zeroth harmonic absorption,  spectrum is independent of the degree of inhomogeneous broadening, because integration over the entire absorption lineshape eliminates the effect of saturation broadening (Páli et al., 1993). Spectral simulation using the methods described in Section 4 confirms that this is also the case in the presence of molecular motion and at 100 kHz Zeeman modulation frequencies (Livshits et al., 1998b). Practically, and in the simulations, the integrated
  intensity is obtained by double integration of the conventional first-harmonic
  spectrum. The
 of the integrated absorption intensity, S, is given by:
where |
is a scaling factor and P is the saturation factor that depends upon |
|
With slow passage conditions and in the absence of molecular motion |
||
|
The |
of this factor in the presence of molecular |
motion and Zeeman modulation can thus be expressed to a first
approximation in terms of an effective |
time, |
More precise |
calibrations are given in the Appendix. |
|
|
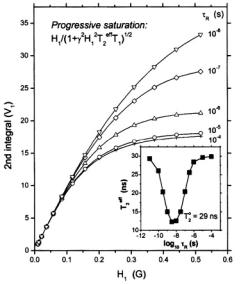
Figure 9 gives the progressive saturation curves for the integrated absorption intensity of first harmonic spectra as a function of the molecular
rotation frequency |
Spectra were simulated as described in Section |
|
4 with high-frequency Zeeman modulation, |
All saturation |
|
curves have the dependence on microwave field intensity, |
that is given |
|
by Eq. 37, irrespective of rotational frequency, or the presence of inhomogeneous broadening. The saturation behaviour depends strongly on molecular motion in the extreme motional broadening region, for rotational correlation times  The effective values of
  that are deduced from the saturation curves are given by the inset in Fig. 9. A
minimum value of |
is achieved for |
that corresponds to the |
||
frequency equivalent |
of the |
hyperfine |
anisotropy. In this extreme |
|
motional broadening regime the values of |
are independent of, and much |
|||
shorter than, the intrinsic |
and depend only relatively weakly on |
the |
||
rotational correlation time, |
This regime |
is readily identified from the |
||
conventional |
lineshapes from which approximate values of |
are |
||
SATURATION TRANSFER SPECTROSCOPY |
335 |
deduced. Spin-lattice relaxation times can therefore be determined from progressive saturation experiments in this motional regime without a detailed knowledge of  (or
(or  ).
).
Figure 9. Simulated saturation curves for the double integrated intensity ofthe  signal at a Zeeman modulation frequency of
  for different values of the inverse frequency ofmolecular rotation (or rotational correlation time),
  The intrinsic spin-lattice relaxation time is fixed at
  The inset gives the dependence on rotational correlation time
  of the effective
  that appears in the saturation factor:
 theintrinsic
  is 29 ns (see Livshits et al., 1998b).
In both the motional narrowing regime  and the very slow motion regime
  the saturation behaviour depends directly on the intrinsic
  as expected conventionally for progressive saturation experiments. In the extreme motional narrowing regime
  and quasi-rigid limit regime
  the values of
  are no longer dependent on rotational correlation time and are equal to the intrinsic values,
  More precise calibrations, which are essential in the intermediate regime, are given in the Appendix. The method of extracting the spin-lattice relaxation times from the experimental saturation factors is outlined there.

336 |
DEREK MARSH ET AL. |
7.2First harmonic, out-of-phase absorption 
As already mentioned, the first-harmonic, out-of-phase absorption spectrum  has been identified as a non-linear display that is sensitive to
  but relatively insensitive to both molecular motion (Hyde and Thomas,
1973) and |
(Livshits et al., 1998a). Fig. 10 gives the dependence |
|
of the out-of-phase to in-phase integrated intensity ratio, |
on spin-lattice |
|
relaxation time that is obtained from spectral simulations for different
rotational correlation times |
Clearly the dependence on molecular |
|
motion is relatively small, throughout the entire correlation time range |
||
especially for a Zeeman modulation frequency of 25 kHz. The |
||
dependence on intrinsic |
is also similarly slight (Livshits et al., 1998a; |
|
Livshits and Marsh, 2000). |
|
|
The best sensitivity to |
is obtained at relatively high microwave |
|
magnetic field intensities, |
(Livshits et al., 1998a). The data in |
|
Fig. 10 are calculated for |
The dependence of the out-of-phase to |
|
in-phase ratio on |
can be |
fitted by an empirical expression of the form |
(Livshits et al., 1998a):
where  and m are fitting parameters. Calibration values are given in the Appendix.
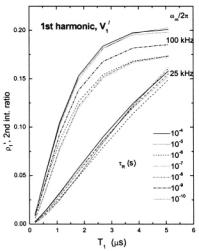
The most striking feature of Fig. 10 is the dependence on Zeeman modulation frequency. For  the out-of-phase/in-phase ratio is most sensitive to short spin-lattice relaxation times,
  The lower modulation frequency of 25 kHz extends this range of sensitivity to the
 range, for which the out-of-phase intensities become comparable to those at 100 kHz modulation frequency. Thus the sensitivity of the firstharmonic out-of-phase display can be tuned to different ranges of spin-lattice relaxation time by changing the modulation frequency. Practical examples are given by Livshits et al. (1998a).
SATURATION TRANSFER SPECTROSCOPY |
337 |
Figure 10. Dependence of the ratio,  of out-of-phase to in-phase integrated intensities of the first-harmonic absorption spectra
  on spin-lattice relaxation time,
  Data are obtained from spectral simulations according to Section 4 for various rotational correlation times,
  and for Zeeman modulation frequencies:
  and 25 kHz (see Livshits and Marsh, 2000)
7.3Second Harmonic out-of-phase Absorption 
Although the second-harmonic out-of-phase absorption spectrum is less optimal for estimation of  times than is the first harmonic equivalent, it is included here because it is the classical ST-EPR display and to date is also that most used for determining spin-lattice relaxation enhancements (see e.g., Marsh et al., 1998). There are obvious advantages to determining both rotational mobility and spin-lattice relaxation enhancements in one and the same experiment.
Figure 11 illustrates the application to relaxation enhancements induced by spin-spin interactions (i.e., cross relaxation) for a spin-labelled lipid in gel-phase bilayer membranes. Theoretical dependences of the second harmonic  integrated intensity on spin-lattice relaxation time are given in the inset to this figure. The
  intensity ratio,
  is strongly dependent on spin-lattice relaxation time in the range
  but also depends strongly on the intrinsic
  From the correlation with the effective
  relaxation time product obtained from progressive saturation experiments (see Fig. 11), a consistent value of
  at 25°C (8.5 ns at 15°C and 6.5 ns at 35°C) is obtained to describe the experimental correlation between

 is appropriate to the experimental data at 15°C and 25°C that essentially correspond to a “no motion” situation.
 of spin-labelled phosphatidylcholine (5-PCSL) at different concentrations in gel-phase (
 relaxation time products obtained from progressive saturation of the second integral of the conventional
  spectra. The solid line is the dependence on
  calculated according to Section 4 in the absence of molecular motion with
  The dashed line is a linear regression. The
  integrated intensity on
  from no-motion simulations
  in Section 4) for different values of
  (see Páli et al., 1996).
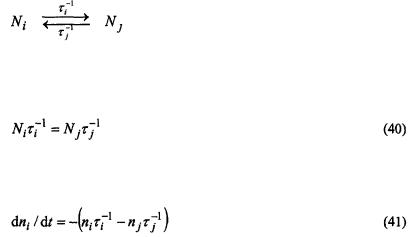
SATURATION TRANSFER SPECTROSCOPY |
339 |
8.SLOW EXCHANGE AND PARAMAGNETIC ENHANCEMENTS
This section describes the different processes, other than slow rotational diffusion, to which nonlinear spin-label EPR spectroscopy is sensitive. It therefore covers the non-classical aspects of saturation transfer EPR spectroscopy (Marsh et al., 1998). There are three basic areas of application: slow physical or chemical exchange processes; weak spin-spin interactions between spin labels; and weak relaxation enhancements induced by paramagnetic species. In the latter two cases, both Heisenberg spin exchange and magnetic dipole-dipole interactions contribute to the relaxation mechanism.
8.1Relaxation enhancement by exchange processes
Exchange at rates comparable to that of the spin-lattice relaxation alleviates saturation in nitroxide ESR spectra. This results either from transfer of spin polarisation, in the case of physical or chemical exchange, or by mutual antiparallel spin flips (i.e., cross relaxation), in the case of Heisenberg exchange (see Fig. 1). For exchange between two sites, both cases are equivalent as is seen immediately below. The analysis uses rate equations for spin population differences following Yin and Hyde (1987).
Consider two sites with total spin populations  and
and  between which physical or chemical exchange takes place:
where  is the rate of transfer from site i, and
  that from site j. These rate constants are related by detailed balance:
The rate equation for the spin population difference,  at site i is then:
340 |
|
DEREK MARSH ET AL. |
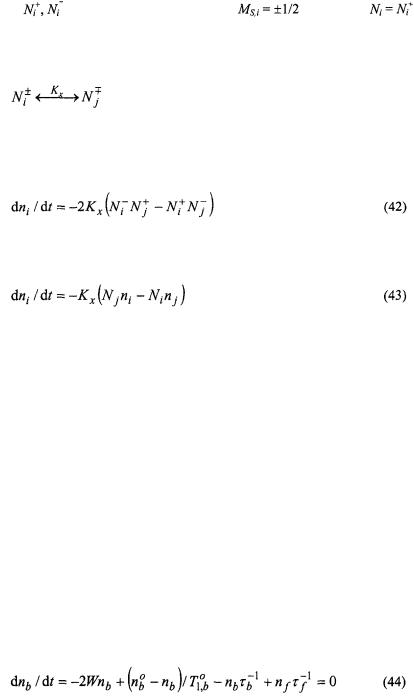
where |
are the spin populations of the |
states (with |
 at site i, and similarly for
Heisenberg spin exchange between the two sites, on the other hand, can be depicted as:
where  is the bimolecular rate constant for spin exchange. The corresponding rate equation for the spin population difference at site i is (Yin and Hyde, 1987):
where the right-hand side can be rewritten in terms of population differences  (Marsh, 1992a):
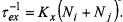
The exchange frequency defined in the usual bimolecular formalism is:
 Thus physical/chemical exchange and Heisenberg spin exchange are kinetically equivalent, with the following identities obtained from Eqs. 40 to 42:
  and
and  where the fractional population of state i is and
The two-site spin exchange situation is specifically applicable to double labelling experiments (Snel and Marsh, 1994; Páli et al., 1999). Commonly, however, Heisenberg exchange takes place between more than two distinguishable spin label species in a concentration-dependent, singlelabelling experiment. Depending on spin-label concentration, the relaxation enhancement can then be considerably more efficient than in the two-site case. This more usual single-labelling case is considered after first treating two-site exchange.
8.1.1Relaxation by slow two-site exchange
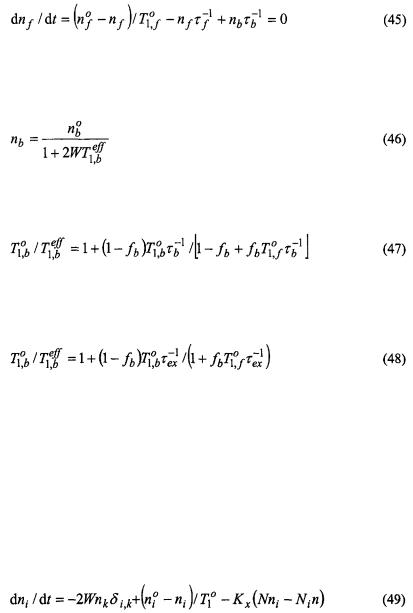
Consider exchange between two sites b and f (see Fig. 1) where spin transitions are induced at rate 2W by  at site b. The steady-state condition for the spin population difference at site b, including exchange and spin-lattice relaxation, is:
SATURATION TRANSFER SPECTROSCOPY |
341 |
where  is the spin population difference at Boltzmann equilibrium, and
  is the spin-lattice relaxation time in the absence of exchange. A corresponding steady-state condition applies to the spins at site f that are not
irradiated (i.e., with W= 0):
Solution of rate equations 44 and 45, together with Eq. 40 (that holds also for population differences), yields the standard expression for saturation of the spin system at site b (see Slichter, 1978):
where the effective spin-lattice relaxation time in the presence of exchange is given by (Horváth et al., 1993):
from which the off-rate,  for exchange may be determined. The corresponding expression for Heisenberg spin-exchange between two distinguishable spin-labelled species is (Snel and Marsh, 1994):
which can be deduced from the identities between the exchange rates in the two cases, viz.,  (see above).
8.1.2Concentration dependence of Heisenberg exchange
In the general case, Heisenberg exchange takes place between many spin labels of the same type that are distinguished either by their different 
 states, or by their different orientations with respect to the static magnetic field. Equation 43 must be summed over all states j with which the state i is exchanging. The steady state rate equation for the population difference of the ith transition is then (Marsh, 1992a):