

Biomedical EPR Part-B Methodology Instrumentation and Dynamics - Sandra R. Eaton
.pdfDIGITAL DETECTION BY TLSS IN EPR |
211 |
single exponential decay is expected. The data are the result of  repetitions at a rate of
  repetitions per second (about 2 min).
Figure 8. Saturation-recovery data: (a) raw IF recovery; (b) SR after the word shuffle.
The primary benefits of TLSS detection of SR data based on the experiments conducted thus far include simultaneous detection of saturationrecovery dispersion and absorption and elimination of low frequency distortions that cause droop of the tail of the exponential decay. In data not shown in Hyde (1998), the pulse ELDOR experiment of Hyde et al. (1984) was replicated using TLSS detection. The pulse TLSS spectrometer that was constructed is convenient for pulse ELDOR experiments. One simply translates the SR pump arm to a different frequency such that the frequency difference between the pump and observed microwaves matches an interval of interest in the EPR spectrum.
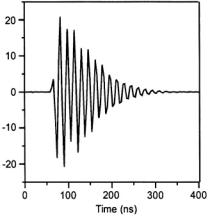
Figure 9 shows an FID signal of one line of a rapidly tumbling nitroxide radical spin label that was obtained at the output of the time-locked A/D converter. The magnetic field was not precisely centered on the EPR line, being shifted slightly down field. The resulting FID signal is a decaying microwave signal with a frequency that differs from the frequency of the excitation by an amount that depends on the offset of the magnetic field from the center of the line. In a conventional FID display, mixing of the FID microwave frequency with a microwave reference at the excitation frequency results in decaying oscillations at the offset frequency. This is not what one sees in Fig. 9. This figure shows the decaying FID signal directly as translated to an intermediate frequency. The oscillations in Fig. 9 are not at the offset frequency, but rather at the excitation minus the offset frequency – translated, of course, to an intermediate frequency.
212 |
JAMES S. HYDE ET AL. |
Figure 9. FID signal using TLSS detection.
5.SELECTED ENGINEERING CONSIDERATIONS
There are two goals in this section: to give to the EPR spectroscopist an overview of key engineering aspects of digital detection, and to provide the EPR spectrometer designer with technical detail and access to the literature that will be of practical value. There are five parts in this section of the chapter: i) frequency synthesizers, ii) image reject filters, iii) anti-aliasing filters, iv) A/D converters and v) data processing.
5.1Frequency Synthesizers
Frequency synthesizers are required in Class 3 digital detectors (Fig. 1) as well as to generate various excitation irradiation patterns. Synthesizerbased excitation methods can introduce distinctive noise effects into digital detection systems. In this section, we review our experience in the use of synthesizers both for excitation and detection.
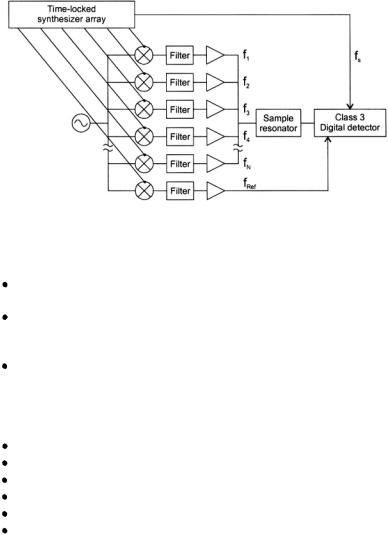
Various techniques for generating the frequencies in the microwave bridge arms have been considered (Strangeway et al., 1995). The double sideband/ fixed filter technique has been pursued extensively (Berliner et al., 2000; Hyde et al., 1995) and utilizes synthesizers to drive the mixers in a direct translation approach. The synthesizers are time-locked through the use of a common reference clock, typically a low-noise crystal oscillator. A block diagram of a generic synthesizer-based microwave bridge is shown in Fig. 10 (Schweiger and Jeschke, 2001). The bridge can be used for either conventional field modulation or multiquantum (MQ) EPR. ELDOR and
DIGITAL DETECTION BY TLSS IN EPR |
213 |
MQ-ELDOR modes of operation are also available if a sufficient number of excitation (main) arms are present.
Figure 10. EPR bridge with multiple time-locked microwave signals incident on the sample followed by Class 3 digital detection.
Synthesizers are utilized for three primary functions in this microwave bridge circuit:
Drive the translation mixer(s) in the main arm(s) that feed into the sample resonator.
Drive the translation mixer in the reference arm at a frequency appropriate to the desired bridge detection mode. The reference arm frequency is  in Fig. 10 and is
  in Fig. 1, Class 3.
Provide the A/D converter clock 
Incorporation of synthesizers into bridge designs introduces another set of characteristics that must be considered. The following parameters are relevant (beyond the normal parameters of output frequency, microwave output power, and reference clock frequency):
spurious content amplitude noise absolute phase noise residual phase noise residual phase drift frequency resolution
Knowledge of the spurious content of the synthesizer output spectrum is important, because a spurious frequency could interfere with a frequency component of an EPR signal. For example, a spur at 100 kHz would be detrimental to detecting 100 kHz EPR signals in field modulation. The modulation frequency could be adjusted to place the spur in the rejection band of eventual filtering. In MQ EPR, one should check that none of the spurs align with the MQ EPR frequencies (if the main arms are separated by
214 |
JAMES S. HYDE ET AL. |
10 kHz, then the frequencies of concern are 15, 25, 35, etc. kHz from the nominal mean frequency). The maximum spurious level of a synthesizer is normally specified by the manufacturer, but the frequencies at which the spurs occur are not specified and generally must be measured.
Amplitude noise, often stated through a noise floor specification, is usually less than phase noise in modern synthesizers, but should be checked for a given synthesizer. Phase noise is considered from two aspects: absolute phase noise and residual phase noise. Absolute phase noise is represented by the phase noise power density-to-carrier ratio vs. offset frequency under the small angle condition (Fantanas, 1992). In the context of synthesizers, residual phase noise is the uncorrelated phase noise between two synthesizers when they are locked to a common reference clock. The distinction is complicated in synthesizers because, for example in indirect synthesizers (Goldberg, 1999), there are frequency offset regions where either the absolute phase noise or the residual phase noise is dominant and regions where both are significant. Furthermore, these frequency offset regions are dependent on the particular synthesizer design. Impact of synthesizer phase noise on the spectrometer performance is dependent on the bridge operating mode. In general, a lower absolute phase noise vs. frequency offset for a synthesizer produces lower system noise levels. Hence, low phase noise synthesizers are clearly desirable. Absolute phase noise is normally specified for modern synthesizers, but residual phase noise specifications are rare and must generally be measured by the user.
Residual phase drift is the drift of the phase between two synthesizers with a common reference clock. The outputs of two synthesizers set to the same frequency have a nominal phase shift between them. If the synthesizer frequencies are the same, residual phase drift is the change of phase shift between the two sinusoidal signals and is easily measured (Bates, 1999). If the synthesizer frequencies are different, it is the change of phase shift from what the phase ought to be vs. time. The latter is more difficult to measure. Synthesizer frequencies must be mixed and then phase detected against a reference source that is also time-locked to the synthesizer reference clock. The reference source must have a phase drift that is known to be significantly less than the residual phase drift being measured. Often, the reference is at a lower frequency (the difference frequency between the two synthesizers) and satisfies this condition.
Residual phase drift is an unspecified parameter. It is important because, if significant, it can change the absorption/dispersion proportion while the scan is in progress. One must insure that the synthesizers are fully warmed up and their temperature is stable. It is insufficient that the synthesizers are connected to the wall power source – the reference clock may be warmed-up and stable, but not the remainder of the circuits. All synthesizers should be
DIGITAL DETECTION BY TLSS IN EPR |
215 |
turned on and set to the desired frequencies. A minimum warm-up period is typically one day. Many users leave the synthesizers on at all times.
Resolution, i.e., frequency resolution, is the minimum frequency increment that can be set in the synthesizer. It is not a measure of absolute frequency accuracy (Yates, 1982). Resolution is significant to the extent that one wishes to resolve absolute nominal frequencies. For example, if an ideal sampling frequency of  is desired, a higher resolution allows one to set the actual sampling frequency closer to the ideal. Frequency resolution is a standard synthesizer specification.
Other parameters, such as switching speed and modulation capability, may become significant as EPR applications with synthesizer-based bridges evolve.
Synthesizer performance has improved significantly over the past few decades. The original intent for synthesizers was to use them to generate several frequencies, often from one stable source, although sets of stable sources such as crystal oscillators, have been used (Smith, 1998). Generally, synthesizers are classified as either direct synthesizers, based on arithmetic generation of the output frequency from a reference frequency, or indirect synthesizers, based on the phase-locked loop (PLL). Analog and digital versions of both classes exist. Direct analog synthesizers are based on frequency mixing, division, multiplication or combinations thereof (Galani and Campbell, 1991). The direct digital synthesizer (DDS) has grown in prominence in the last decade with the ever-increasing capacity of digital circuits. It is based on digital circuits and digital-to-analog converters to generate the output signal (Pozar, 2001). Impressive phase noise performance of DDS synthesizers with good spurious specifications are now available: for a 0.01 to 3.0 GHz frequency range with at least 0.1 Hz resolution, the phase noise is -112, -132, and -155 dBc/Hz at 1, 10, and 100 kHz offsets, respectively, with –80 dBc non-harmonic spurious suppression (Stavenick, 2002).
Indirect analog synthesizers have a long history, but indirect digital synthesizers now dominate with the evolution of digital circuit technology. Indirect digital synthesizers with divide-by-N PLLs traditionally have elevated phase noise levels when fine frequency resolution is required (Dell’Aera and Riley, 2002). Multi-loop architectures exist to reduce the impact of the divide-by-N on phase noise (Goldberg, 1999), but the advent of the fractional-N PLL has resulted in significant phase noise reductions while maintaining fine frequency resolutions. The main difficulty with fractional-N PLL has been spurs, which have been significantly reduced recently through digital correction techniques (Owen, 2001). Dell’Aera and Riley present a succinct overview of integer-N and fractional-N synthesizers in Smith, 1998. Impressive phase noise performance of indirect digital synthesizers with good spurious specifications is now available: for a 0.675
216 |
JAMES S. HYDE ET AL. |
to 1.35 GHz frequency range with a 0.1 Hz resolution, the phase noise is - 115 dBc/Hz at 1 kHz offset and is –140 dBc/Hz at a 20 kHz offset and above, with –90 dBc non-harmonic spurious suppression (see IFR Systems Product Brochure).
These recent synthesizer improvements are providing direct system performance improvement in synthesizer-based microwave bridges. For example, previous synthesizer phase noise exceeded the phase noise of the microwave oscillator in the microwave bridge. Synthesizer phase noise is now equal to or lower than the phase noise of many fundamental microwave oscillators. Improved spur suppression and frequency resolution further promote the usefulness of synthesizers in microwave bridges. Synthesizer performance has improved and costs have decreased to the point where they are viable for routine incorporation into microwave bridges.
5.2Image Rejection in Class 2 and 3 Receivers
Any superheterodyne receiver including Classes 2 and 3 receivers, Fig. 1, must take into consideration noise introduced by the image frequency band into the IF output of the signal mixer. The image frequency band consists of frequencies that, when mixed with the  will produce an output within the IF bandwidth at the mixer IF output port (Stremler, 1979). Noise and spurious signals in this band will elevate the noise at the output of the signal mixer, and should be suppressed. Increased noise degradation may occur in an EPR bridge due to reactive effects of the sample resonator on frequencies outside its bandwidth. In other words, noise originating in the main arm source around the image frequency will be reflected off the sample resonator into the signal LNA and mixed to the IF bandwidth by the signal mixer.
This additional noise can be diminished by bandpass IR filtering of the signal incident on the RF port of the signal mixer, or through the use of an IR mixer as the IF mixer. This type of mixer inherently rejects frequencies either above or below  depending on the internal phasing of quadrature hybrids used in its construction. It will operate over relatively wide RF and IF bandwidths (up to one octave), with typically 20 dB of image signal suppression (Maas, 1993).
The choice of suppression method depends on the relationship of the image frequency band to the incoming RF, desired IF frequency and bandwidth. For example, if the IF is very low compared to the incoming RF (say 10 MHz IF and 10 GHz RF), it may not be practical to construct a tunable bandpass filter that can remove the image frequency band over the full 1 GHz tuning range of the bridge. In this case, an IR mixer may be used to reduce at least 20 dB of noise in the receiver resulting from conversion of the image band into the IF. Where an appropriate filter can be constructed,
DIGITAL DETECTION BY TLSS IN EPR |
217 |
considerably more rejection of image noise can be achieved. A double conversion scheme using conversion to a high and then to a lower IF may be used to improve image rejection over a wide bridge tuning range. The final IF can be relatively low, which may be mandated by analog input bandwidth considerations of the A/D converter.
5.3Anti-Aliasing (aa) Filters
The anti-aliasing filter for the A/D converter in an IF sampling system such as Class 3 or 4 receivers, Fig. 1, must have a bandpass response. The maximum allowable signal bandwidth is limited by the sampling freqeuncy  Frequencies outside this bandwidth must be rejected or they will alias into the passband in the A/D converter. This may be particularly troublesome if the aliasing frequencies are harmonically related to the desired signals, as would be the case in a greatly over-modulated EPR line. Out-of- band noise not attenuated by filtering will fold over into the passband, increasing the apparent noise level of the receiver. An engineering guideline is that the undesired frequencies and spurious signals should be attenuated to a level of less than one quantization level of the A/D converter, but greater attenuation may be desirable. The bandpass filter must not distort the phase and amplitude of the IF signal over the desired bandwidth in order to allow accurate digital detection of I and Q (absorption and dispersion).
The need for a sharp filter cutoff characteristic, and for uniform amplitude and group delay (implying linear phase response) may result in an unrealizable or very high order filter design (Zverev, 1967). There are several solutions to this problem. The sampling frequency of the A/D converter may be increased, resulting in oversampling of the desired signal bandwidth. This allows the band-reject specifications of the filter to be relaxed because the filter cutoff frequencies may be moved further from the center frequency, and less steep attenuation characteristics will be required to reject out-of-band signals to a level below the final resolution. Signals outside of the desired IF passband will not be aliased because they are actually within the wider Nyquist bandwidth implied by the higher sampling frequency. Secondly, amplitude and phase distortion can be corrected by signal processing after A/D conversion if the filter is adequately characterized over the passband.
5.4A/D Converters
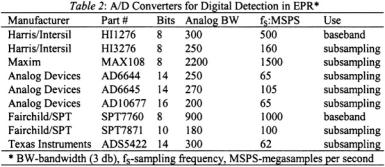
Table 2 lists A/D converters that have been considered by us for possible use for digital detection in EPR spectrometers. Of the entries in the table, we have considerable practical experience with the Harris/Intersil HI1276
218 |
JAMES S. HYDE ET AL. |
and the Analog Devices AD6644 converters. The table provides a snapshot in late 2002 of a rapidly changing technology.
The Nyquist ratio of the bandwidth-to-sampling frequency of about ½ is used only in the HI1276 chip. All other entries in the table could be used for subsampling. Several of the entries have high ratios: about 3.5 for the Analog Devices products and 5 for the Texas Instruments ADS5422. These same devices also have the highest vertical resolution, 14 to 16 bits.
The Maxim MAX108 device has by far the highest analog bandwidth. A 2.2 GHz microwave signal can be introduced directly to the device and sampled at 1500 MSPS. For example, the sampling of the 2.2 GHz microwave frequency could be four samples in seven cycles, which would be convenient for Class 4 digital TLSS detection, Fig. 1. One can also imagine the use of this device for Class 3 digital TLSS detection based on an intermediate frequency of 2.2 GHz. This would result in the fastest possible time response for pulse EPR at X-band and higher microwave frequencies within the constraints of the entries in the Table.
We were attracted to the AD6644 chip in part because of its high vertical resolution. For digital detection in CW EPR, there is a potential risk of overranging the A/D converter in Class 3 designs because the IF carrier is too high. This device minimizes the risk. The fairly large analog bandwidth, 250 MHz, permits reasonable temporal response for pulse EPR using a relatively high intermediate frequency, noting that high IF facilitates design of the aa filter, Fig. 1. For subsampling with I-Q detection, one can collect a data point in each channel every 60 nanoseconds. This is 1/4 of  With the AD6645, this interval drops to 40 nanoseconds, and with the recently announced AD10677, the vertical resolution increases from 14 to 16 bits.
The number of A/D converters with sampling rates over 1 MSPS – including 67 devices from Texas Instruments alone – indicates their growth in popularity. Of the more than 40 chips with sample rates above 10 MSPS, only a handful have analog bandwidths below the sample rate, indicating that the target market for most of the chips is subsampling.
DIGITAL DETECTION BY TLSS IN EPR |
219 |
5.5Data Processing
A number of factors combine to make archiving and processing possible . Subsampling (bandpass sampling) is a way of reducing data flow from the A/D to subsequent processing stages. The rates and bandwidths need only be sufficient to capture the desired information. Decimation, the process of sample rate reduction, can also be used for reducing data rates to a value high enough to capture the bandwidth required and low enough to be
processed by the attached computer.
Device clock rates, particularly central processing units (CPU) and memory, have increased. The advent of GHz PCs, for example, pushed the development of memory technology as the CPUs became starved for data. Data buses also increased in clock speed. Peripheral Component Interconnect (PCI) bus clock speed, for example, doubled from 33 MHz to 66 MHz with PCI-eXtended (PCI-X) enhancements. At the same time, the width of the bus – the number of bits it carries in parallel – also doubled from 32 to 64 bits.
Storage rates of disk systems also increased due to increased bus speeds and Redundant Array of Inexpensive Disk (RAID) arrays. There are several ways in which RAID arrays can be used. The one of interest in our application writes a stream of data across several disks to reduce access delays. The RAID system we have in-house streams data to disk at 50 to 60 MB/sec. Raw data streaming is now near 200 MB/sec.
When the bus is wider, in terms of data bits, than the data word we are storing (14 bits for the AD6644), only clock speed and not bus width increases the rate at which our samples can be acquired. This is true in the typical PC architecture where the PCI bus and the path to disk are 32 bits or larger. Additional hardware or software is needed to pack the 8-16 bits output data of the A/D onto a wider bus. Most manufacturers have added multiple A/Ds operating in parallel to fill the bus width. These give very impressive throughput rates – hundreds of MB/sec – but this does not help our single channel application. As switched fabrics are used in place of conventional backplanes, throughput rates will rise because multiple transfers can take place in parallel. Switched fabrics are used in switches and routes for network applications. But unless the data is multiplexed, single channel acquisition speeds are not improved.
Several devices have been optimized for the communications industry that are applicable to our work. They include the subsampling A/Ds mentioned above as well as Digital Down Converters on a single chip. These are digital logic integrated circuits, several of which are made by both Intersil and Graychip, designed to connect directly to the A/D. They include a sine generator, quadrature mixer and filters, as well as data handling and formatting hardware. The Digital Signal Processor (DSP) chip is another such device. DSPs were designed to use wide data buses and have multiple
220 JAMES S. HYDE ET AL.
processor units on the chip. They are optimized for the multiply-accumulate instructions needed in fast Fourier transforms. The C6xxx family from Texas Instruments, for example, has eight processors in parallel. This provides instruction rates above one Giga Floating Point Operation per second (GFLOP), with only a 167 MHz clock. With new products, DSP clock speeds are also rising.
Field Programmable Gate Arrays (FPGAs) are standard parts that can be programmed for specific functions. Their clock speeds and ability to handle complex algorithms allow them to replace DSPs in some applications. Pentek is providing an environment to make use of FPGAs in a development setting. They will even provide an FPGA programmed to perform FFTs. Xilink, a manufacturer of FPGA chips, has an intellectual property (ip) core that programs the FPGA to provide the functions of a Digital Down Converter. FPGAs can also perform data packing and improve data acquisition rates. Hardware and software tradeoffs are again blurred by the FPGAs.
Platforms designed for development of digital radio include most of the pieces mentioned above. These development stations designed for the commercial market have made it easier and less expensive for us to obtain a system useful for our objectives. Evaluation modules also make creating digital receiver systems possible while avoiding concerns with other issues such as power supply noise, ground planes and clock skew.
As hardware improves, software is following. Higher level programming is now easier to accomplish. For efficient implementations, DSPs previously required extensive hand coding in assembly language. The C language compiler in Texas Instruments (TI) Code Composer developer software is reported to generate assembly language instructions that not only make use of the parallel processors available in the DSP chip, but also produce code that is within 90% of the performance of what can be done by hand. National Instruments is developing an interface for their high level graphical program (LabVIEW) to allow control of the DSP and its integration into LabVIEW-based software systems. MATLAB from Mathworks, as well as similar software from other companies, allows creation of DSP algorithms and integrates them with the DSP chip.
6.CONCLUSION
Digital detection in EPR spectroscopy will become increasingly common in the years ahead. The benefits are primarily broadband detection, digital filtering and increased opportunities for data analysis. Real-time displays of data will become increasingly elaborate. For example, in CW EPR using field modulation, all harmonics for both I and Q could be displayed almost