

Biomedical EPR Part-B Methodology Instrumentation and Dynamics - Sandra R. Eaton
.pdfSATURATION TRANSFER EPR |
373 |
dynamics of spin labeled proteins, including membrane proteins, have appeared in the literature (e.g. Hyde and Thomas, 1974; Hyde, 1978; Hyde and Dalton, 1979; Hyde and Thomas, 1980; Thomas, 1985; Thomas et al., 1985; Robinson et al., 1985; Hemminga and de Jager, 1989; Beth and Robinson, 1989). These reviews provide an introduction to ST-EPR, discussions of the sensitivity of ST-EPR to rotational motions in the  to msec time range, and extensive discussions of applying the method to systems undergoing anisotropic rotational diffusion. The interested reader is also referred to a small collection of seminal papers that describe the discovery, early applications, and the theory underlying the method (Hyde et al., 1970; Hyde and Dalton, 1972; Thomas and McConnell, 1974; Robinson et al., 1974; Thomas et al., 1976). These papers, and the comprehensive review by Hyde and Dalton (1979), will provide readers with a thorough introduction to the basic principles of ST-EPR.
The remainder of this chapter will discuss the capabilities of modern multi-frequency ST-EPR for determining the very slow global rotational dynamics of membrane proteins and in particular, recent advances that have permitted rigorous testing of diffusion models and determination of correlation times from global nonlinear least squares fitting of experimental data sets (Hustedt et al., 1993; Hustedt and Beth, 1995; 2001). While the major emphasis is on rotational dynamics of integral membrane proteins, it should be noted that the methods and computational approaches that have been developed can easily be adapted to investigations of the very slow rotational dynamics of other spin labeled macromolecules. Also, though this chapter only addresses the capabilities of continuous wave (CW) ST-EPR, there are other nonlinear saturation transfer EPR approaches, such as continuous wave and time-domain electron-electron double resonance (ELDOR; Hyde and Feix, 1989; Borbat et al., 2001), that continue to be explored for their potential to provide additional insights into the rotational motions of spin labeled proteins. In addition, multiquantum EPR (MQ-EPR), a technique developed by Hyde and coworkers (Sczaniecki et al., 1990; Mchaourab and Hyde, 1993), is potentially useful for obtaining very slow rotational motion.
2.METHODS FOR ANALYSIS OF ST-EPR DATA
Linear EPR lineshapes are sensitive to motions which effectively average elements of the nitroxide A- and g-tensors, and thus the resonant field position, within a timescale determined by the spread in resonant positions of the manifolds that make up the rigid limit spectrum. ST-EPR derives its sensitivity to motion from a complex competition between the rotational
374 |
ALBERT H. BETH AND ERIC J. HUSTEDT |
|
dynamics, Zeeman modulation, |
and |
This competition is in response |
to the partial saturation effects of a nonlinear microwave field. ST-EPR lineshapes also depend on the relative orientation of the spin label reference frame relative to the diffusion tensor, on the microwave frequency and amplitude, and to a lesser extent, on the principal values of the A- and g- tensors. Fortunately, many of these parameters can be selected (e.g. microwave and modulation frequencies and amplitudes) or measured (e.g.
and |
using |
saturation recovery EPR (Percival and Hyde, |
1976; |
Robinson et |
al., |
1994); A- and g-tensor elements from linear EPR |
|
measurement, |
(e.g. |
Hustedt et al., 1993)). With this information, |
it is |
possible to carry out detailed simulations of experimental data in order to determine the unique elements of the diffusion tensor. Even in the absence of precise values for  and
and  it is possible to analyze experimental STEPR data using estimated values for these parameters (e.g. Robinson et al., 1994) and obtain very good agreement between theory and experiment.
The paucity of computational algorithms for analyzing experimental STEPR data has undoubtedly limited its use for measuring the global URD of membrane proteins as compared with TOA. URD, and other anisotropic rotational diffusion processes, present special challenges for the analysis of ST-EPR data since the orientation of the spin label reference frame relative to the molecular reference frame and the uniqueness of this orientation both have profound spectral effects (Robinson and Dalton, 1980; 1981; Robinson et al., 1985; Beth and Robinson, 1989). Explicit consideration of this additional complexity, compared to simple isotropic rotational diffusion, and the inclusion of nonlinear microwave and modulation field effects, results in a computationally demanding problem for calculation of ST-EPR lineshapes. Therefore, the early ST-EPR literature on membrane protein rotational dynamics is dominated by estimation of effective correlation times via the comparison of motion-sensitive ratio parameters measured from experimental spectra with calibration curves of the same parameters obtained from an isotropic model system such as spin labeled hemoglobin in glycerol/water solutions (Thomas et al., 1976). While this model system approach has permitted very useful assessments of rotational dynamics, including changes in rotational dynamics of membrane proteins in different functional states (e.g. Beth et al., 1986; Bigelow and Thomas, 1987; Squier et al., 1988; Squier and Thomas, 1988; Cobb et al., 1990; Schwarz et al., 1990; Lewis and Thomas, 1991; Mahaney and Thomas, 1991; Esmann et al., 1992; Qiu et al., 1992; Mahaney and Grisham, 1992; Rousseau et al., 1993; Cornea and Thomas, 1994; Middleton et al., 1995; Negash et al., 1996; Wolkers et al., 1997; Schwarz et al., 1999; Marsh and Henderson, 2001), it has not permitted the determination of true rotational correlation times nor the rigorous testing of rotational diffusion models (Robinson and Dalton,
SATURATION TRANSFER EPR |
375 |
1980; Beth and Robinson, 1989). Both of these provide important insights into the size(s), and hence the oligomeric state(s) of membrane proteins and the nature and extent of their interactions with other proteins (e.g. Nigg and Cherry, 1980; Cherry and Godfrey, 1981; Hustedt and Beth, 1995; 2001).
The importance of developing computational approaches for analyzing experimental ST-EPR data was appreciated at the time of its discovery as discussed in several early papers (e.g. Thomas and McConnell, 1974; Robinson et al., 1974; Coffey et al., 1976; Thomas et al., 1976; Perkins et al., 1976). However, the limitations of computers at that time necessitated that a number of approximations be made, including axially symmetric magnetic tensors and simple isotropic rotational diffusion, in order to speed up the simulations. These approximations precluded the use of these early algorithms for rigorously analyzing the ST-EPR data from integral membrane proteins undergoing anisotropic rotational diffusion by optimization of the agreement between experiment and theory. However, this early work established two independent ways of treating the effects of rotational diffusion on ST-EPR spectra. The first, based on the work of McCalley et al. (1972), treats molecular motion in terms of the transition rate matrix approach (Thomas and McConnell, 1974; Thomas et al., 1976). The second is based on the orthogonal eigenfunction expansion approach (Robinson et al., 1974). Both of these basic approaches have been widely employed in the evolution of computational algorithms for simulation of STEPR spectra (Robinson and Dalton, 1980; 1981; Howard et al., 1993; Hustedt and Beth, 1995; 2001).
The phenomenal increase in computation speed and memory of modern computers, compared to what was available at the time of the development of ST-EPR, makes it possible to include full A- and g-tensor anisotropy, relevant relaxation rates, nonlinear microwave and modulation effects, anisotropic rotational diffusion, and spin label orientation in ST-EPR calculations while maintaining acceptable computation times even on inexpensive desktop personal computers. Computational algorithms, based upon the transition rate matrix approach, have been developed for unconstrained URD (Hustedt and Beth, 1995) and for constrained URD (Hustedt and Beth, 2001). These algorithms can be utilized to analyze single experiments or to globally analyze multiple ST-EPR spectra using automated nonlinear least squares methods to optimize the agreement between experiment and theory (Hustedt et al., 1993; Hustedt and Beth, 1995; 2001). These methods have been employed to globally analyze multiple ST-EPR spectra from the anion exchange protein (AE1) in human erythrocytes (Blackman et al., 2001) and from the EGF receptor in A-431 membrane vesicles (Stein et al., 2002) that were recorded at different microwave or different Zeeman modulation frequencies. These analyses
376 |
ALBERT H. BETH AND ERIC J. HUSTEDT |
have permitted testing of the adequacy of the URD model for rotational diffusion of membrane proteins, determination of the best fit values for the correlation time(s) for URD, constraints to the amplitude of URD, and the number of different motional species that are present. These data analysis methods, in combination with the computational algorithms based upon the orthogonal eigenfunction expansion approach that have been developed by Robinson and Dalton (1980; 1981), provide users with a fairly comprehensive set of tools that can be utilized to analyze ST-EPR data from intrinsic membrane proteins at a quantitative level. Using these methods, STEPR can provide detailed insights into the assembly and interactions of membrane proteins thereby providing an important complement to TOA methods for understanding the complex interactions and dynamics of membrane proteins.
3.OVERVIEW OF THEORY FOR CALCULATION OF ST-EPR SPECTRA
3.1The Uniaxial Rotational Diffusion Model
The anisotropic arrangement of the lipid bilayer places severe constraints on the global rotational diffusion of integral membrane proteins since rotations about axes that are orthogonal to the membrane normal require the cooperative displacement of lipids. Therefore, most studies of rotational diffusion by TOA and by ST-EPR have utilized the URD model as a starting point for analysis of experimental data. Though there is not an extensive literature that evaluates the adequacy of the URD model for a wide range of intrinsic membrane proteins, the spectroscopic data from studies of global rotational diffusion of bacteriorhodopsin reconstituted in proteoliposomes (Cherry and Godfrey, 1981) and AE1 in erythrocyte membranes (Hustedt and Beth, 1995) can be accurately described using this model. The study by Cherry and Godfrey (1981), in particular, showed that the TOA data from bacteriorhodopsin reconstituted in liposomes at low protein/lipid ratios could be fit quantitatively with the URD model using the known orientation of the intrinsic chromophore relative to the URD axis. Moreover, the correlation time for global URD  that was determined was consistent with the intramembrane dimensions of the protein and the effective viscosity of the bilayer and in reasonable agreement with the theoretical predictions of Saffman and Delbrück (1975).
ST-EPR spectra provide the greatest sensitivity to the correlation time for rotational diffusion at those positions of the spectrum where the change in resonance condition  with a change in the orientation of the spin label

SATURATION TRANSFER EPR |
377 |
with respect to the external magnetic field due to molecular reorientations is large (i.e. where  is maximum. Here, the variable
  represents the polar angles between the spin label principal axes (x, y, and z) and the external field (Z); Thomas et al., 1976; Fajer and Marsh, 1983; Beth and Robinson, 1989). The plots in Figure 1 show the regions of the second harmonic out-of-phase absorption ST-EPR signal, denoted
  where sensitivity to rotational motions about the three spin label principal axes is maximized at microwave frequencies of 9.8, 34, and 94 GHz. These plots, which complement those published previously by Fajer and Marsh (1983) for X-band, provide qualitative insight into how URD would be manifested in the observed spectrum and why the orientation of the spin label reference frame relative to the URD axis, as defined in Figure 2, would be such an important determinant of lineshape. For example, if the nitroxide z-axis is aligned with the URD axis, rotational motion will only lead to interconversion of the nitroxide x- and y-axes with no motional averaging of the z-axis into the minor plane while alignment of the nitroxide x-axis with the URD axis leads to motional averaging of the nitroxide y- and z-axes.
Figure 1. Top: Linear EPR signals at X- (left panel), Q- (center panel), and W-band (right panel) respectively calculated for a  spin label. Middle: Plots of
  (Gauss/radian). Bottom:
  ST-EPR spectra calculated assuming
 and
and 
Beth and Robinson (1989) provided an extensive discussion of the sensitivity of ST-EPR signals to a variety of rotational diffusion models including URD at 3.0, 9.8, and 22 GHz. A generalization of these discussions is that the higher microwave frequencies (i.e. X- and K-bands) provide increased sensitivity to the details of anisotropic motion relative to the nearly axial character of spectra recorded at S-band, and below.  signals at Q-band show excellent sensitivity to the correlation time for URD at all labeling geometries (Hustedt and Beth, 2001; Figure 4, below). As
378 |
ALBERT H. BETH AND ERIC J. HUSTEDT |
originally pointed out by Johnson and Hyde (1981), Q-band offers some unique capabilities for detailed studies of rotational diffusion due to the comparable anisotropy arising from the g- and A-tensor interactions. Commercial EPR spectrometers that operate at Q-band and that provide excellent signal-to-noise ratios with aqueous samples have permitted the use of this higher microwave frequency for ST-EPR studies on membrane proteins even at their natural levels in the cell membrane (Blackman et al., 2001). Though ST-EPR studies at W-band have not been explored experimentally to date, the plots of  at W-band in Figure 1 and calculated spectra (Hustedt and Beth, 2001; Figure 5, below) suggest that this frequency could provide outstanding sensitivity to the correlation time for URD regardless of the geometry of the spin label relative to the URD axis. Access to spectrometers that operate at Q- and W-band is increasing and this should facilitate the use of these higher microwave frequencies as a routine complement to X-band for detailed characterization of the dynamics of membrane proteins or to any systems that exhibit complex anisotropic rotational motions.
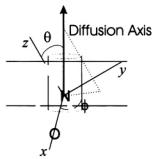
Figure 2. Orientation of the nitroxide with respect to the URD axis.
3.2Transition Rate Matrix
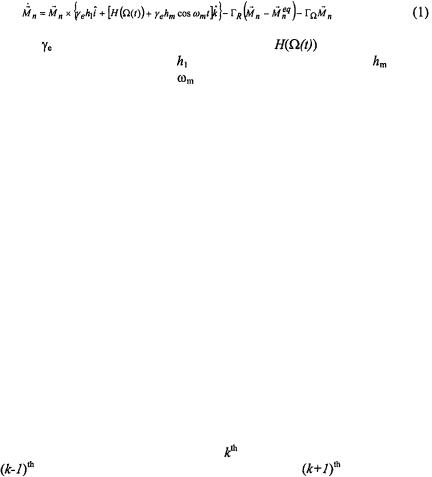
ST-EPR utilizes nonlinear microwave power and Zeeman modulation amplitude to maximize sensitivity to slow rotational diffusion. Therefore, calculation of ST-EPR spectra requires treatment of not only the orientation dependent spin Hamiltonian and the stochastic reorientation processes, but also, the nonlinear microwave power and Zeeman modulation amplitude. Two approaches have been employed to simulate the effects of rotational motion on ST-EPR spectra. In the first approach, the spin dynamics are treated in terms of Bloch equations for the absorption, dispersion, and z-
SATURATION TRANSFER EPR |
379 |
components of the magnetization and the orientation variables are quantized to a grid of N sites.
where |
is the electron gyromagnetic |
ratio; |
is the |
orientation |
|
dependent |
spin Hamiltonian; |
is the |
microwave amplitude; |
is the |
|
Zeeman modulation amplitude; |
is the Zeeman modulation frequency; and |
||||
 is the phenomenological spin relaxation operator. Rotational dynamics are modeled as hopping between nearest neighbor sites on the angular grid. The transition rate matrix,
  which determines the rates at which transitions between neighboring orientations occurs, is constructed based on the equilibrium orientation distribution. The application of the transition rate matrix approach is limited, for practical purposes, to models of rotational dynamics that are inherently one-dimensional such as isotropic rotational diffusion under the assumption that the nitroxide A- and g-tensors are axial (Thomas and McConnell, 1974; Thomas et al, 1976; Howard et al., 1993) or URD with nonaxial A- and g-tensors (Hustedt and Beth, 1995).
ST-EPR spectra are typically detected as that component of the absorption that is out-of-phase at the second harmonic of the Zeeman modulation frequency, denoted  or that component of the dispersion that is out-of-phase at the first harmonic of the Zeeman modulation frequency, denoted
  (Hyde and Dalton, 1972; Thomas et al., 1976). Experimentally, both of these ST-EPR signals depend on the Zeeman modulation amplitude (Robinson, 1983) and on the modulation frequency (Hyde and Dalton, 1972; Beth and Robinson, 1989). In order to simulate these effects, Zeeman modulation must be explicitly included in the Bloch equations. The components of the magnetization are written as a Fourier series at harmonics of the Zeeman modulation frequency. The steady-state solution to the Bloch equations gives the Fourier coefficients which are the observable EPR
signals. The Fourier coefficients at the |
harmonic depend on those at the |
|
harmonic and are also coupled to those at the |
harmonic. The |
|
back coupling of terms at one harmonic to those at the next lowest harmonic determine the nonlinear effects of Zeeman modulation.
In practice, the infinite series of modulation harmonics can be truncated at  where
where  is defined operationally as the number of harmonics required for the calculated signal to converge to a constant lineshape as additional harmonics are included. Alternatively, as an approximation, all back coupling terms can be neglected. The simulated lineshape is then independent of Zeeman modulation amplitude and the Fourier coefficients at each harmonic are determined progressively. Computational algorithms
380 |
ALBERT H. BETH AND ERIC J. HUSTEDT |
using both of these approaches have been developed for unconstrained URD as described in detail in Hustedt and Beth (1995).
3.3Orthogonal Eigenfunction Expansion
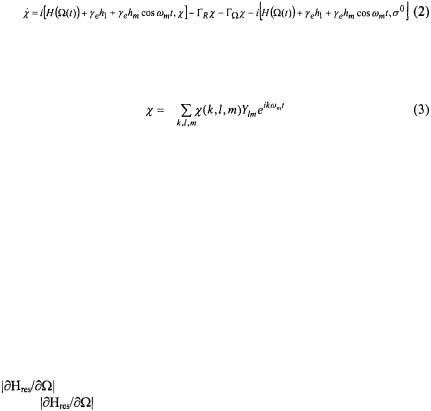
An alternative approach to the simulation of ST-EPR spectra has been developed by Robinson and Dalton (1980; 1981). Starting with the Stochastic Liouville Equation (SLE) one writes
Individual elements of the reduced density matrix,  are written in terms of the spherical harmonics,
  and as a Fourier series at harmonics of the Zeeman modulation frequency.
The simulation of ST-EPR spectra using the eigenfunction expansion method is complicated by the fact that there are two indices in the expansion of  which range to infinity. These are the index k over the harmonics of
  and the index l over the spherical harmonics. Treatment of the expansion in k is the same as discussed for the transition rate matrix approach above. The expansion over l is more problematic since the eigenfunction expansion is inherently numerically inefficient in the slow motion regime applicable to ST-EPR. The eigenfunction expansion approach converges to a constant lineshape very efficiently at low microwave frequencies (i.e. X-band, S- band, L-band). However, convergence requires the inclusion of much higher values of l and m as the microwave frequency is increased. Various extrapolation schemes have been implemented to determine, point-by-point, the number of l and m indices that are required for convergence. These extrapolations greatly speed up calculations since the calculated signals converge to a constant lineshape much more rapidly at field position where
|
approaches 0 (i.e. at the turning points) than they do at regions |
where |
is large. In practice, the existing eigenfunction algorithms |
are very tractable at X-band microwave frequencies, and below. However, they can be problematic at Q-band and very difficult at W-band, particularly at correlation times near 1 msec.
Both the transition rate matrix approach (in the limit that the number of angles in the grid is infinite) and the eigenfunction expansion approach (in the limit that all l up to  are included) will, in principle, yield identical results. In applying these approaches to the calculation of ST-EPR spectra, these limits are not met and other approximations have been made. In the
SATURATION TRANSFER EPR |
381 |
transition rate matrix approach three significant approximations have been employed: 1) the use of reflective rather than cyclic boundary conditions to model the rotational dynamics; 2) the neglect of nitrogen nuclear spin-lattice relaxation time,  and 3) the use of an approximate treatment of the pseudosecular terms in the spin Hamitonian. Algorithms have been developed using the transition rate matrix approach to calculate ST-EPR spectra for a nitroxide undergoing URD which either include (Algorithm I) or neglect (Algorithm II) Zeeman overmodulation effects. A direct comparison between the eigenfunction expansion method developed by Robinson and coworkers and Algorithm II has shown that these three approximations do not significantly alter the calculated ST-EPR lineshape at correlation times greater than
  Comparison of Algorithms I and II has shown that either algorithm can be used to obtain meaningful parameters describing the rotational dynamics (Hustedt and Beth, 1995).
3.4Constrained URD
Linear EPR and ST-EPR are sensitive both to the rate of rotational dynamics and also to the RMS angular amplitude of motion when rotational dynamics are restricted. Just as the sensitivities of the two techniques to the rate of motion are different, so also are the sensitivities to the amplitude of rotational dynamics. The first work to directly address the sensitivity of STEPR spectra to the RMS amplitude of rotation for a restricted rotational diffusion model was done by Thomas and coworkers (Howard et al., 1993). In this work, an algorithm was developed, based upon the transition rate matrix approach, to treat the case of motion in a cone under the assumption of axially symmetric magnetic tensors. The calculations of Howard et al. (1993), carried out at X-band using 5 Gauss modulation amplitude and a modulation frequency of 50 kHz, established sensitivity limits of ST-EPR under these conditions for detection of restricted amplitude motion for the model considered. Three general conclusions can be drawn from this work. First, ST-EPR has limited sensitivity to the angular amplitude of motion. Under all the conditions tested by Howard et al. (1993), maximal effects were obtained for rotational motion that was constrained to an angular amplitude of 90°, or less. Second, the sensitivity of ST-EPR to the amplitude of angular motion decreases as the rate of motion decreases. Third, the effects on the ST-EPR lineshape of reducing the rate or the angular amplitude of diffusion are similar. Nonetheless, there are unique spectral features for each combination of rate and amplitude.
Methods previously developed to simulate ST-EPR spectra for unrestricted URD based on the transition rate matrix approach (Hustedt and Beth, 1995) have been adapted to treat URD within a square-well restriction
382 |
ALBERT H. BETH AND ERIC J. HUSTEDT |
(Hustedt and Beth, 2001). URD in a square-well of width  is modeled as random jumps between equally spaced sites on an angular grid between
 and
and  The final simulation is obtained as the sum for a number of different values of
  Simulations have been performed for different values of
  and
and  at 9.8, 34, and 94 GHz (Hustedt and Beth, 2001). The results of these simulations for restricted amplitude URD, which are discussed in section 5.2, below, mirror the conclusions that were drawn from the diffusion in a cone model by Thomas and coworkers (Howard et al., 1993).
4.NONLINEAR LEAST SQUARES METHODS OF DATA ANALYSIS
With the enormous increase in the speed of computers since ST-EPR was first developed in the early 1970’s, along with the accompanying decrease in their cost, it became practical in the past decade to adapt routines capable of simulating ST-EPR spectra into nonlinear least squares data analysis programs. Initially, the eigenfunction expansion algorithm developed by Robinson, Dalton, and coworkers (Dalton et al., 1976; Robinson and Dalton, 1980; 1981) was incorporated into the nonlinear least squares global analysis package developed by Beechem and colleagues for analyzing fluorescence data (Beechem, 1992). Using this approach, the ST-EPR spectra of labeled bovine serum albumin in glycerol/water mixtures were successfully analyzed according to an isotropic rotational diffusion model (Hustedt et al., 1993). Subsequently, transition rate matrix algorithms were developed and incorporated into this global analysis package (Hustedt and Beth, 1995; 2001). These algorithms have been employed in fitting the ST-EPR data obtained from spin labeled AE1 of the human erythrocyte (Hustedt and Beth, 1995; Blackman et al., 2001), and spin labeled EGF bound to the EGF receptor in A-431 cell membranes (Stein et al., 2002).
Two important features of the global analysis approach are that it allows the simultaneous analysis of data obtained at multiple modulation and microwave frequencies according to the same rotational diffusion model and it also allows determination of the uncertainties in fitting parameters that are recovered from the analyses. As it has been applied to data from ST-EPR experiments, the global analysis approach uses the Marquardt-Levenberg algorithm to perform the nonlinear least squares analysis. The integrated amplitude of a  ST-EPR signal is a function of many factors including both the Zeeman modulation frequency and the rotational dynamics of the spin label (Dalton et al., 1976; Hyde and Dalton, 1979; Beth and Robinson, 1989). As a result, components with different rotational mobility, if present in the sample, will make a varying degree of contribution to the total
  ST-
ST-