

suai.ru/our-contacts |
quantum machine learning |
44 P. D. Bruza and L. Fell
This sum is essentially based on the sum of di erences between marginal prob-
abilities. If |
0 ≥ 1, |
then the di erences between the marginal probabilities |
is deemed |
too great |
for any meaningful conception of contextuality. When |
0 ≤ 0 < 1, then failure of any of the four inequalities signifies the presence of contextuality. Note that these inequalities revert to the standard CHSH inequal-
ities when signalling is not present ( 0 = 0). |
|
|
|
|C11R11 |
+ C12R12 + C21R21 − C22R22| ≤ 2(1 + |
0) |
(11) |
|C11R11 |
+ C12R12 − C21R21 + C22R22| ≤ 2(1 + |
0) |
(12) |
|C11R11 |
− C12R12 + C21R21 + C22R22| ≤ 2(1 + |
0) |
(13) |
| − C11R11 |
+ C12R12 − C21R21 + C22R22| ≤ 2(1 + |
0) |
(14) |
where |
|
|
|
C11R11 = (p1 |
+ p4) − (p2 + p3) |
(15) |
|
C12R12 |
= (p5 |
+ p8) − (p6 + p7) |
(16) |
C21R21 |
= (p9 |
+ p12) − (p10 + p11) |
(17) |
C22R22 |
= (p13 + p16) − (p14 + p15) |
(18) |
|
4 Experiment
4.1Subjects
Participants consisted of 34 workers using the online crowdsourcing platform, Amazon Mechanical Turk (AMT), and 85 workers using the online crowdsourcing platform, Prolific. Both platforms are used by researchers, amongst others, to post experiments and surveys to a wide audience of thousands of potential participants to view and complete. Participants involved in the present study were able to view any project before agreeing to participate, and were paid a small but standard amount ($1.50 for AMT participants, £1.00 for Prolific participants) per HIT. Both AMT and Prolific platforms allow workers of certain skill, ability or reputation to be specified for a HIT. In this experiment, workers of at least 96% or greater approval rating were selected to balance worker quality with the need to attract a su cient number of participants. De-identified worker IDs were used to ensure participants did not participate in more than one condition. Participants were sourced from a wide variety of countries, including the US, UK, France, Italy, Australia, New Zealand, and South Africa. A test question was first presented to participants to ensure they could properly view the experiment on their browsers. Data collected from participants who could not correctly answer this test question, did not respond to written segments of the experiment in English, or who were deemed not to have understood instructions based on the relevancy/quality of their responses, were excluded from the study. In total, 3 workers were excluded.
suai.ru/our-contacts |
quantum machine learning |
Are Decisions of Image Trustworthiness Contextual? A Pilot Study |
45 |
4.2Design and Materials
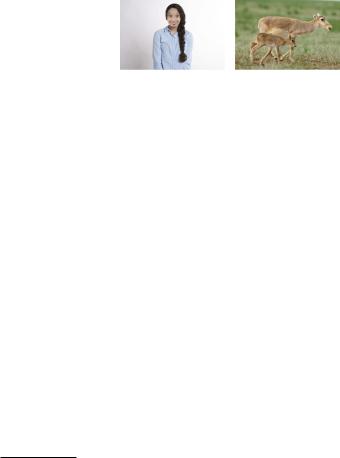
Images were selected to fall into two subject categories: untrustworthy subjects and neutral subjects. The first two images depicted infamously untrustworthy subjects: an image of Vladimir Putin2, and an image of a shark3. Figure 2 depicts the images of the neutral subjects: an unknown woman4, and an antelope with her calf 5. All images were manipulated in a detectable way. Image presentation was counter-balanced, and each image was accompanied by three responses: A question-pair, a confidence rating, and a reasoning explanation. The question pairs consisted of combinations of the following four questions:
Fig. 2. Image stimuli
–Do you think the person in this image is honest? (for a human image subject)/ Do you think the animal in this image is safe? (for an animal image subject) (Honest/Safe)
–Do think this image has been altered? (Altered)
–Do you think the person in this image is dishonest? (for a human image subject)/ Do you think the animal in this image is unsafe? (for an animal image subject) (Dishonest/Unsafe)
–Do think this image has been unaltered? (Unaltered)
The questions were intended to capture a decision about the subject of the image (human or animal) as well as the features of the image itself (the representation of the subject). The first two questions are the opposite counterparts of the second two. Responses to opposing questions were expected to be unique to each other, based on research showing asymmetry between positive and negatively worded questions [14]. The pairs were combined in the following four ways to form the 4 measurement contexts in a Bell scenario design where two variables (H and D) are related to the content of the image and two variables (A and U ) are related to its representation.
2https://www.iol.co.za/news/world/us-releases-putin-list-13013292.
3https://www.complex.com/life/2017/11/scientists-discover-ancient-shark-with-300- teeth-and-people-want-no-part-of-it.
4Sourced from Pixabay.
5Sourced from Flickr (Igor Shpilenok) under the following license: https:// creativecommons.org/licenses/by/2.0/.
suai.ru/our-contacts |
quantum machine learning |
46 P. D. Bruza and L. Fell
–Honest/Safe (H ) and Altered (A)
–Honest/Safe (H ) and Unaltered (U )
–Dishonest/Unsafe (D) and Altered (A)
–Dishonest/Unsafe (D) and Unaltered (U )
Each image was displayed for 1 s. Placed in a Dual Process context, decisions of trust are assumed to be based on a ective characteristics (the ‘Hot’ system) as well as more rational characteristics (the ‘Cold’ system). The time pressure was designed to access the ‘Hot’ system.
4.3Procedure
Participants were instructed to peruse the task (one condition of the experiment) before agreeing to participate. They were given a test question to ensure they understood instructions and could properly view the images displayed in the task before continuing. This was done by presenting an image of a cat, along with a question asking what animal featured in the image. If the participant could correctly answer this, they were asked to continue to the rest of the task.
Following this question were instructions aimed at introducing the question pair as well as preparing users for the shortness of the image display time. Once understood, users were asked to scroll to the first image. Each image and question group was structured in the following way:
1.A short repeat of image reveal instructions
2.A blank image with the text ‘Click to show image’ Once clicked, this changed to one of the images outlined earlier, with a number beneath counting down from 1 s. Once 1 s had elapsed, the image disappeared.
3.First response: The full question pair is displayed again (the same question pair as in the instructions and accompanying each image of the HIT), as well as a short version (e.g., Safe/Altered). Beneath this was a multiple choice format with the answers:
(a)Yes, Yes
(b)Yes, No
(c)No, Yes
(d)No, No
These were aligned to the short version of the questions to avoid confusion about what each answer referred to.
4.Second response: Participants were then asked to rate, on a slider with a scale from 1 to 7, their confidence in the answers they gave.
5.Third response: Lastly, participants were asked to provide reasoning for the answers they gave in written form. This was to gather further insight into the first response, as well as to determine whether participants correctly understood the questions being asked.
This was repeated for all 4 images, and was followed by a question asking for the country the participants resided in, and a ‘Submit’ button.
suai.ru/our-contacts |
quantum machine learning |
Are Decisions of Image Trustworthiness Contextual? A Pilot Study |
47 |
Fig. 3. Pairwise probability distributions corresponding to Eq. (1) for Putin (top left), Shark (top right), Girl (bottom left), antelope (bottom right). Variables H - honest/safe, D - dishonest/unsafe, A -altered, U - unaltered
Table 1. Di erences in marginal probabilities: Putin (L) and Shark (R)
|
|
|di | |
z−score (p−val) |
0.161 |
0.194 |
0.032 |
-0.894 (0.896) |
0.733 |
0.839 |
0.105 |
-0.894 (0.381) |
0.226 |
0.300 |
0.074 |
-0.333 (0.751) |
0.774 |
0.581 |
0.194 |
1.344 (0.192) |
|di | z−score (p−val)
0.065 0.194 0.129 -0.430 (0.742)
0.700 0.774 0.074 -0.566 (0.578)
0.484 0.567 0.083 -0.468 (0.647)
0.484 0.452 0.032 0.174 (0.864)
Table 2. Di erences in marginal probabilities: Girl (L) and Antelope (R)
|
|
|di | |
z−score (p−value) |
0.710 |
0.677 |
0.032 |
0.229 (0.821) |
0.233 |
0.258 |
0.025 |
-0.111 (0.915) |
0.581 |
0.5 |
0.081 |
-0.463 (0.649) |
0.516 |
0.419 |
0.097 |
0.519 (0.611) |
|
|
|
|
|di | z−score (p−value)
0.645 0.677 0.032 -0.218 (0.830)
0.367 0.387 0.020 -0.101 (0.922)
0.387 0.333 0.053 0.261 (0.799)
0.774 0.645 0.129 0.945 (0.355)
4.4Results
Tables 1 and 2 show that di erences in marginal probabilities vary across all four images. Z–scores were computed to determine whether the di erences between marginal probabilities were significant. None of these di erences where found to be significant. Table 3 reveals that 0 < 1 for all images which means that the system of CHSH inequalities (11)–(14) can be meaningfully applied to determine the presence of contextuality. The resulting analyses revealed no violations as none of the maximum CHSH values exceeded the degree of contextuality required.
4.5Discussion
The di erences in marginal probabilities reveal that there is signalling between the content and representation decision systems. This is despite the fact the experimental protocol was designed to isolate these sub-systems.