
Industry, trade and services, tourism and the information society
Industrial activities such as manufacturing are integrated with many service activities such as transport and communications, distribution and business services, which in turn depend on industry to produce the equipment and hardware they use. Creating a positive climate in which entrepreneurs and businesses can flourish is considered by many as the key to generating growth and jobs; this is all the more important in a globalised economy, where some businesses have considerable leeway to select where they wish to operate.
Main findings
The line graphs presented on the next two double pages (Figures 7.1 to 7.3) illustrate developments for industrial output, industrial output prices and retail trade sales using key short-term business statistics. The statistics presented here are annual indices but the underlying series are normally monthly or quarterly data which facilitate a rapid assessment of the economic climate. These short-term statistics show developments over time and so may be used to calculate rates of change.
The impact of the global financial and economic crisis on industrial activities and the subsequent recovery can be clearly seen for the two industrial indicators in Figures 7.1 and 7.2. In the years leading up to the recent crisis there was growth in industrial output in the vast majority of G20 members – note that the industrial production index is a volume index and so has been adjusted to remove price changes. From the second half of 2007 many economies started to experience a contraction in output alongside an acceleration of price growth. Already in 2008 the annual rates of change in the industrial production index turned negative for some G20 members, notably Japan, the United States and the EU 27. In 2009 most of the other G20 members (note that no data are available for Argentina, China or Saudi Arabia) also reported negative rates of change for industrial production, the most notable exception being India (6.6 % growth), while industrial output remained relatively unchanged in Indonesia and South Korea. By 2010 the annual rates of change had turned positive for all G20 members, although they turned negative again in Japan in 2011 in part as a consequence of the tsunami in March 2011.
|
The EU in the world 2013 — a statistical portrait |
|
73 |
|

|
|
|
7 |
|
Industry, trade and services, tourism and the information society |
|
|
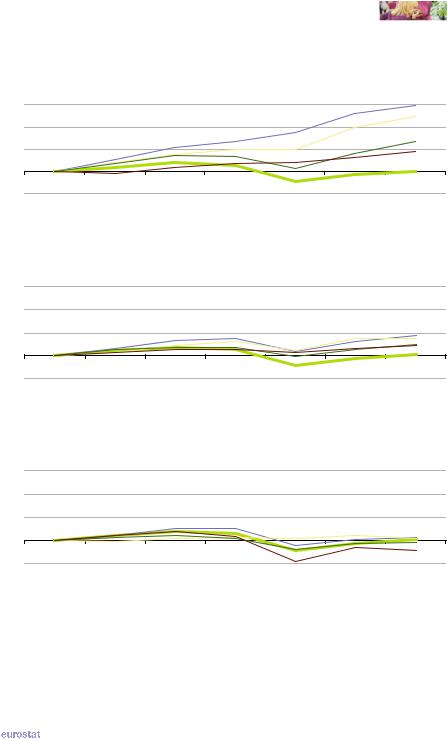
The crisis was remarkable not just for its global scale, but also for the depth of the downturn, particularly in industrial activities. In 2009 industrial output fell by more than 10 % in Turkey, South Africa and the EU 27 and as much as 21.3 % in Japan.
As well as clearly illustrating the impact of the financial and economic crisis, Figure 7.1 shows the contrasting developments of industrial activity among the G20 members in recent years as all three parts are shown with the same scale and each include the time series for the EU 27. Rapid industrial growth can be seen in India and South Korea, and to a somewhat lesser extent in Turkey, Indonesia, Russia and Brazil. By contrast, industrial output in 2011 in South Africa, Australia, the EU 27 and the United States was approximately the same as it had been in 2005; in other words, by 2011 output had not returned to the pre-crisis levels of 2007 and/or 2008.
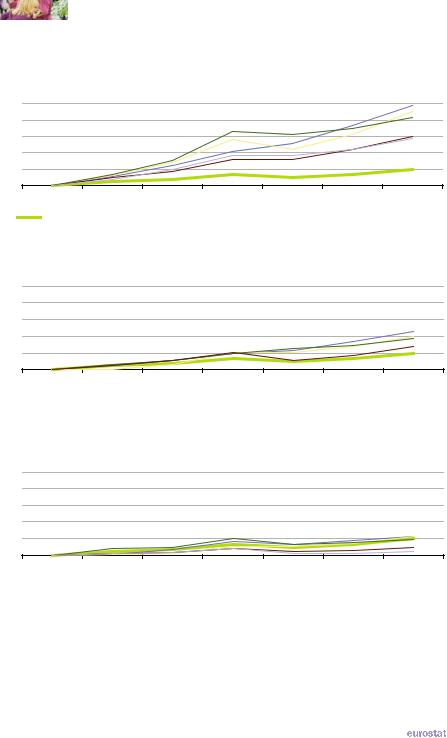
As already noted, the growth rate in industrial output prices accelerated in the period leading up to the financial and economic crisis, as prices rose in 2008 by more than 10 % in Turkey, Brazil, South Africa and Argentina and by more than 20 % in Russia and Indonesia. Often the rapid increase in prices reflected the rising cost of energy, food and other natural resources, as increased demand from developing countries outstripped supply. In 2009 many G20 members recorded an abrupt fall in output prices, although there were rises in Argentina, Mexico, India and Turkey in 2009 that were more modest than those experienced in 2008. The largest falls in output prices in 2009 were recorded in the United States, Russia, Australia and Japan, where industrial output prices fell more than 5 %. By 2010 all G20 members, except for Japan, recorded rising industrial output prices which continued into 2011.
Over the period from 2005 to 2011 industrial output prices nearly doubled in Argentina, equivalent to an annual growth rate of 12.0 %. Russia (11.4 %) and Indonesia (10.6 %) also averaged double-digit price increases during the period shown in Figure 7.2. Despite falling prices in 2009, EU 27 industrial output prices increased by 3.1 % per year on average between 2005 and 2011, while Japanese industrial output prices averaged increases of just 0.8 % per annum.
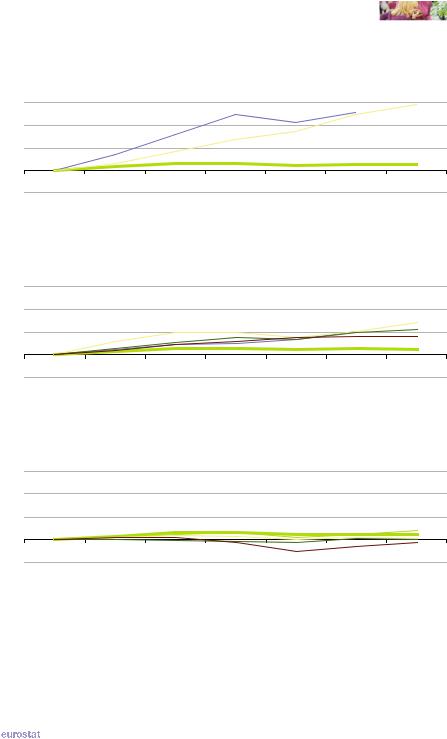
The volume of retail sales index reflects developments once price changes have been removed; retail sales indices have particular importance as they can be used as short-term approximations for final domestic demand by households. From Figure 7.3 it can be clearly seen that the financial and economic crisis also had an impact on retail trade output, although a much less profound one than on industrial output. The volume of retail sales fell in 2008 by 5.0 % in the United States and by a more modest 0.8 % in the 17 member euro area (the index was unchanged in the EU 27). In 2009 many G20 members recorded a fall for their volume of retail sales, most notably -7.6 % in the United States and -5.0 % in Russia; among the G20 members with data available, only Brazil, Australia and South Korea continued to record an increase in their volume of retail sales in 2009. By 2010 this index had returned to an upward path in all G20 members shown in Figure 7.3 and by 2011, the volume of sales index had returned above pre-crisis levels in all G20 members except for the EU 27 and the United States.
74 |
|
The EU in the world 2013 — a statistical portrait |
|
|
|
|
|
Industry, trade and services, tourism and the information society |
|
7 |
|
|
Figure 7.1: Industrial production index, 2005-2011(1)
(2005=100)
Highest growth among G20 countries
160
140
120
100
80
2005 |
2006 |
2007 |
2008 |
2009 |
2010 |
2011 |
||||
|
EU-27 |
|
India |
|
South Korea |
|
Turkey |
|
|
Indonesia (2) |
|
|
|
|
|
|
|||||
Intermediate growth among G20 countries
160
140
120
100
80
2005 |
2006 |
2007 |
2008 |
2009 |
2010 |
2011 |
|||||
|
EU-27 |
|
|
Russia |
|
Brazil |
|
Mexico |
|
|
Canada |
|
|
|
|
|
|
|
|||||
Lowest growth among G20 countries
160
140
120
100
80
2005 |
2006 |
2007 |
2008 |
2009 |
2010 |
2011 |
||||
|
EU-27 |
|
South Africa |
|
Australia |
|
|
United States |
|
Japan |
|
|
|
|
|
|
|||||
(1) The EU-27 series is shown in all three figures for the purpose of comparison. (2) Covers manufacturing instead of industry.
Source: Eurostat (online data code: sts_inpr_a) and the International Monetary Fund (International Financial Statistics)
|
The EU in the world 2013 — a statistical portrait |
|
75 |
|
|
|
|
7 |
|
Industry, trade and services, tourism and the information society |
|
|
Figure 7.2: Industrial producer price index, 2005-2011(1)
(2005=100)
Highest growth among G20 countries
200
180
160
140
120
100
2005 |
2006 |
2007 |
2008 |
2009 |
2010 |
2011 |
||||
EU-27 |
|
Argentina |
|
Russia |
|
Indonesia |
|
Turkey |
|
South Africa |
|
|
|
|
|
||||||
Intermediate growth among G20 countries
200
180
160
140
120
100
2005 |
2006 |
2007 |
2008 |
2009 |
2010 |
2011 |
|||||
|
EU-27 |
|
|
India |
|
Brazil |
|
Mexico |
|
|
United States |
|
|
|
|
|
|
|
|||||
Lowest growth among G20 countries
200
180
160
140
120
100
2005 |
2006 |
2007 |
2008 |
2009 |
2010 |
2011 |
||||||
|
EU-27 |
|
Saudi Arabia |
|
|
South Korea |
|
Australia |
|
Canada |
|
Japan |
|
|
|
|
|
|
|
||||||
(1) The EU-27 series is shown in all three figures for the purpose of comparison.
Source: Eurostat (online data code: sts_inpp_a) and the International Monetary Fund (International Financial Statistics)
76 |
|
The EU in the world 2013 — a statistical portrait |
|
|
|
|
|
Industry, trade and services, tourism and the information society |
|
7 |
|
|
Figure 7.3: Volume of retail sales index, 2005-2011(1)
(2005=100)
Highest growth among G20 countries
160
140
120
100
80
2005 |
2006 |
2007 |
2008 |
2009 |
2010 |
2011 |
|||
|
|
EU-27 |
|
|
Russia |
|
|
|
Brazil |
|
|
|
|
|
|
|
|||
Intermediate growth among G20 countries
160
140
120
100
80
2005 |
2006 |
2007 |
2008 |
2009 |
2010 |
2011 |
|||||
|
EU-27 |
|
South Korea |
|
South Africa |
|
|
Canada |
|
Australia |
|
|
|
|
|
|
|
||||||
Lowest growth among G20 countries
160
140
120
100
80
2005 |
2006 |
|
2007 |
2008 |
2009 |
2010 |
2011 |
|||||
|
EU-27 |
|
|
Mexico |
|
|
EA-17 |
|
Japan |
|
|
United States |
|
|
|
|
|
|
|
|
|||||
(1) The EU-27 series is shown in all three figures for the purpose of comparison.
Source: Eurostat (online data code: sts_trtu_a) and the International Monetary Fund (International Financial Statistics)
|
The EU in the world 2013 — a statistical portrait |
|
77 |
|

|
|
|
7 |
|
Industry, trade and services, tourism and the information society |
|
|
Structural business statistics provide a snapshot of the business economy for a particular year, mainly focused on the level of inputs (such as labour and goods and services) and the level of output, in particular value added; data are often available at a very detailed level, for several hundred industrial, construction and services activities. The analysis presented in Tables 7.1 and 7.2 focuses on manufacturing divisions: for the EU-27 the dataset used was composed of the 24 manufacturing divisions of the NACE Rev. 2 classification (for the purpose of analysis in Table 7.1 the divisions for food and beverages have been aggregated), while for the other G20 members the ISIC Rev.3 classification was used which has 23 manufacturing divisions.
With the exception of South Korea, food and beverages manufacturing was one of the three largest manufacturing divisions (in value added terms) in all G20 members (see Table 7.1), and in several G20 members it was the largest of all manufacturing activities. The manufacture of basic metals, chemicals and motor vehicles as well as fuel processing (mainly refining and coking) were also activities that frequently figured in the top three manufacturing divisions. Somewhat less common was machinery manufacturing which was one of the three largest manufacturing activities in Japan, the EU 27 and the United States, while metal products manufacturing figured in third place in the EU 27 and the manufacture of radio, television
Table 7.1: Largest manufacturing activities, based on value added, 2009(1)
(% share of manufacturing)
|
|
Largest activity |
|
Second largest |
|
Third largest |
|
EU-27 |
|
Food & beverages |
11.7 |
Machinery |
10.7 |
Metal products |
9.8 |
Argentina |
|
: |
: |
: |
: |
: |
: |
Australia |
|
: |
: |
: |
: |
: |
: |
Brazil (2) |
|
Food & beverages |
17.5 |
Fuel processing |
11.5 |
Chemicals |
11.2 |
Canada (3) |
|
Food & beverages |
13.9 |
Basic metals |
8.5 |
Chemicals |
8.1 |
China (2) |
|
Basic metals |
14.3 |
Chemicals |
10.8 |
Food & beverages |
8.8 |
India (3) |
|
Chemicals |
15.5 |
Basic metals |
14.4 |
Fuel processing |
13.0 |
Indonesia |
|
Food & beverages |
17.7 |
Chemicals |
17.2 |
Motor vehicles |
7.4 |
Japan (2) |
|
Motor vehicles |
14.3 |
Machinery |
12.9 |
Food & beverages |
10.3 |
Mexico (2) |
|
Food & beverages |
24.4 |
Fuel processing |
17.4 |
Motor vehicles |
13.6 |
Russia |
|
Food & beverages |
19.5 |
Fuel processing |
17.8 |
Basic metals |
12.3 |
Saudi Arabia |
|
: |
: |
: |
: |
: |
: |
South Africa (4) |
|
Fuel processing |
20.0 |
Food & beverages |
19.0 |
Basic metals |
10.6 |
South Korea (3) |
|
Radio, TV & comm. |
20.2 |
Motor vehicles |
10.2 |
Basic metals |
9.1 |
Turkey (3) |
|
Basic metals |
11.9 |
Food & beverages |
10.3 |
Motor vehicles |
8.4 |
United States (3) |
Chemicals |
16.2 |
Food & beverages |
13.3 |
Machinery |
9.1 |
|
(1) EU 27 data based on 24 divisions of the NACE Rev. 2 classification; data for other countries based on 23 divisions of the ISIC Rev.3 |
|
||||||
classification. |
|
|
|
|
|
|
|
(2) 2007. |
|
|
|
|
|
|
|
(3) 2008. |
|
|
|
|
|
|
|
(4) Food and beverages manufacturing includes also tobacco manufacturing; fuel processing includes also chemicals and chemical |
|
||||||
products manufacturing. |
|
|
|
|
|
||
Detailed notes. |
|
|
|
|
|
|
|
EU 27: |
includes 2008 data for food and beverages and basic metals manufacturing. |
|
|
||||
Canada: |
excluding 1514, 1532, 1542, 1543, 16, 221, 231, 233, 2693, 2696, 2914, 2921, 2923, 2925, 2926, 2927, 3313, 332, 333, 3592, |
||||||
|
3599, 3692 and 37. |
|
|
|
|
|
|
China: |
excluding 221 and 233. |
|
|
|
|
|
|
India: |
includes 2007 data for 313; excluding 221, 233 and 37. |
|
|
|
|||
Japan: |
excluding 221, 30 and 372. |
|
|
|
|
|
|
Mexico: |
excluding 182, 221, 223, 231, 233, 273, 333, 353 and 37. |
|
|
|
|||
Russia: |
excluding 233, 311, 32, 343, 351, 353, 359. |
|
|
|
|
||
South Africa: |
excluding 243 and 30. |
South Korea: |
excluding 221, 233, 313 and 37. |
United States: |
includes 2007 data for 182 and 231; excluding 221, 233 and 37. |
Source: Eurostat (online data code: sbs_na_ind_r2) and the United Nations (Indstat)
78 |
|
The EU in the world 2013 — a statistical portrait |
|
|
|
|
|
Industry, trade and services, tourism and the information society |
|
7 |
|
|
and communication equipment was the largest manufacturing division in South Korea. The cumulative share of manufacturing valued added generated by the three largest manufacturing divisions ranged from 31 % in Canada and Turkey to 55 % in Mexico.
The most specialised G20 member for a particular manufacturing activity is the one where that activity’s share in the non-financial business economy is highest, regardless of the size of the economy or the activity concerned. There are many reasons why a country or region specialises in a particular activity; these are varied and include the availability of natural resources (for example, for mineral and forest-based manufacturing), the availability of skilled employees, costs, infrastructure, legislation and the proximity to markets. Table 7.2 shows which G20 country outside of the EU-27 was the most specialised for each of the manufacturing divisions and compares the share of that activity in total manufacturing value added in the most specialised G20 country with the share for the EU-27. Compared with the most specialised G20 countries, the EU-27 was relatively specialised in publishing, printing and reproduction of recorded media and fabricated metal products, while it was relatively unspecialised in fuel processing, the manufacture of tobacco products and the manufacture of radio, television and communication equipment.
Table 7.2: Most specialised country in each manufacturing division, based on value added share within manufacturing, 2007 to 2009
(% share of manufacturing value added total)
|
|
Most specialised G20 country |
|
|
|
|
outside of the EU and the activity’s |
EU-27 (2) |
|
|
ISIC Rev.3 code and label |
share in manufacturing in that |
|
|
|
|
country (1) |
|
|
|
|
Country |
Share (%) |
Share (%) |
15 |
Food products and beverages |
Mexico |
24.4 |
11.0 |
16 |
Tobacco products |
Indonesia |
5.1 |
0.5 |
17 |
Textiles |
Turkey |
8.2 |
1.7 |
18 |
Wearing apparel; dressing and dyeing of fur |
United States |
6.3 |
1.3 |
19 |
Leather and leather products |
Indonesia |
1.7 |
0.7 |
20 |
Wood and wood products |
Canada |
4.0 |
2.3 |
21 |
Paper and paper products |
Indonesia |
6.1 |
2.3 |
22 |
Publishing, printing and reproduction of recorded media |
Canada |
3.3 |
5.5 |
23 |
Fuel processing: coke, refined petroleum products and nuclear fuel (3) |
Russia |
17.8 |
1.6 |
24 |
Chemicals and chemical products |
Mexico |
17.4 |
10.7 |
25 |
Rubber and plastics products |
Japan |
5.4 |
4.6 |
26 |
Other non-metallic mineral products |
India |
7.0 |
4.7 |
27 |
Basic metals |
India |
14.4 |
4.9 |
28 |
Fabricated metal products |
United States |
7.7 |
9.8 |
29 |
Machinery and equipment |
Japan |
12.9 |
11.6 |
30 |
Office, accounting and computing machinery |
China |
2.2 |
0.6 |
31 |
Electrical machinery and apparatus |
China |
4.8 |
4.7 |
32 |
Radio, television and communication equipment and apparatus |
South Korea |
20.2 |
2.9 |
33 |
Medical, precision and optical instruments, watches and clocks |
United States |
7.0 |
3.3 |
34 |
Motor vehicles, trailers and semi-trailers |
Japan |
14.3 |
8.6 |
35 |
Other transport equipment |
South Korea |
6.5 |
3.1 |
36 |
Furniture; other manufacturing |
South Africa |
8.1 |
3.2 |
37 |
Recycling |
Russia |
0.6 |
0.5 |
(1) Argentina, Australia or Saudi Arabia, not available; see Table 7.1 for list of latest reference years and exclusions. (2) EU 27 data are for 2007 and based on NACE Rev. 1.1 (directly comparable at the division level with ISIC Rev.3). (3) South Africa’s combined share for Divisions 23 and 24 is 20.0 %.
Source: Eurostat (online data code: ebd_all) and the United Nations (Indstat)
|
The EU in the world 2013 — a statistical portrait |
|
79 |
|
|
|
|
7 |
|
Industry, trade and services, tourism and the information society |
|
|
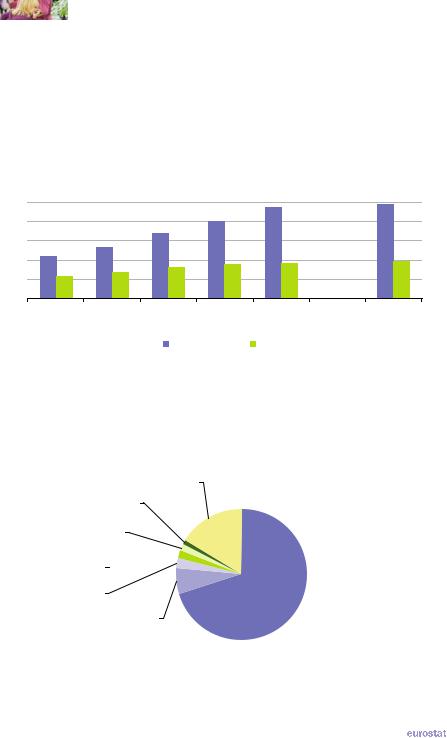
In 2011 there were around 983 million international tourist arrivals worldwide, among which 385 million were in the EU 27. The number of international tourist arrivals in the EU 27 increased by 155 million between 1990 and 2011, but the EU 27’s share of worldwide tourist arrivals dropped from 52.9 % to 39.2 % over the same period. It should be noted that the EU 27 total includes arrivals in EU Member States of international tourists from other EU Member States; approximately 70 % of arrivals in EU 27 Member States in 2010 came from other EU Member States – an extended analysis is provided in Figure 7.5.
Figure 7.4: International tourist arrivals, 1990-2011
(million) |
|
|
|
|
|
1000 |
|
|
|
|
|
800 |
|
|
|
|
|
600 |
|
|
|
|
|
400 |
|
|
|
|
|
200 |
|
|
|
|
|
0 |
|
|
|
|
|
1990 |
1995 |
2000 |
2005 |
2010 |
2011 |
|
|
World |
|
EU-27 (1) |
|
(1) Includes intra-EU arrivals; data relate to international tourist arrivals at frontiers (excluding same-day visitors), other than for Germany, Luxembourg, the Netherlands, Austria, Portugal, Romania, Slovenia, Slovakia and Sweden, where the data relate to international tourist arrivals at collective tourism establishments.
Source: the United Nations World Tourism Organisation (Tourism highlights, 2012)
Figure 7.5: Non-resident arrivals in tourist accommodation establishments within the EU 27 Member States, selected countries, 2010(1)
(% of total)
Others
16.5%
Canada
1.1%
China (including
Hong Kong)
1.2%
Japan 
2.0%
Russia
2.5%
United States
6.5%
(1) The United Kingdom, 2009; excluding Ireland and the Netherlands.
Source: Eurostat (online data code: tour_occ_arnraw)
Other EU-27
Member States
70.1%
80 |
|
The EU in the world 2013 — a statistical portrait |
|
|

|
|
|
Industry, trade and services, tourism and the information society |
|
7 |
|
|
The growth of the tourism sector has been crucial for many countries, offering employment opportunities and a considerable revenue stream; this is particularly true for a number of developing economies which have been transformed by a vibrant tourism industry. Note that tourism statistics cover business travellers and those who travel for leisure. Equally, it is important to bear in mind that international tourists are classified according to their country of residence, not according to their citizenship. As such, citizens residing abroad who return to their country of citizenship on a temporary visit are included as international tourists.
From Table 7.3 it can be seen that international tourists from the United States spent considerably less abroad (EUR 56.8 billion) in 2011 than international tourists spent in the United States (EUR 83.5 billion). A similar surplus of receipts over expenditure was recorded in France, Italy, Australia and India. By contrast, tourists from Germany spent more than twice as much abroad (EUR 60.6 billion) as international tourists spent in Germany (EUR 27.9 billion). In fact, tourists from Germany spent more abroad than international tourists from any other G20 member (for which data are available).
The short time series presented in Table 7.3 shows that expenditure by international tourists from Brazil and China more than doubled between 2008 and 2011 and there were also large increases recorded for tourists from India and Russia. India, Australia and South Korea recorded relatively large increases in international tourism receipts between 2008 and 2011.
Table 7.3: International tourism expenditure and receipts, 2008-2011
(EUR billion)
|
|
Expenditure |
|
|
Receipts |
|
||
|
2008 |
2009 |
2010 |
2011 |
2008 |
2009 |
2010 |
2011 |
EU-27 |
: |
: |
: |
: |
: |
: |
252.7 |
271.2 |
Germany |
61.9 |
58.2 |
58.9 |
60.6 |
27.1 |
24.8 |
26.2 |
27.9 |
France |
27.9 |
27.5 |
29.1 |
29.9 |
38.5 |
35.5 |
35.1 |
43.0 |
Italy |
20.9 |
20.0 |
20.4 |
20.7 |
31.1 |
28.9 |
29.3 |
30.9 |
United Kingdom |
46.6 |
36.0 |
37.7 |
36.3 |
24.5 |
21.6 |
24.4 |
25.8 |
Argentina |
: |
: |
: |
: |
: |
2.8 |
3.7 |
3.8 |
Australia |
12.5 |
12.6 |
16.7 |
19.3 |
16.8 |
18.2 |
22.5 |
22.6 |
Brazil |
7.5 |
7.8 |
12.4 |
15.3 |
: |
3.8 |
4.3 |
4.7 |
Canada |
18.5 |
17.3 |
22.3 |
23.7 |
10.7 |
9.8 |
11.9 |
12.2 |
China |
24.6 |
31.3 |
41.4 |
52.2 |
27.8 |
28.4 |
34.6 |
34.8 |
India |
6.5 |
6.7 |
8.0 |
9.9 |
8.0 |
8.0 |
10.7 |
12.6 |
Indonesia |
: |
: |
: |
: |
: |
4.0 |
5.2 |
5.7 |
Japan |
19.0 |
18.0 |
21.0 |
19.5 |
: |
7.4 |
10.0 |
7.9 |
Mexico |
: |
: |
: |
: |
9.0 |
8.1 |
8.9 |
8.4 |
Russia |
16.2 |
15.0 |
20.1 |
23.3 |
8.1 |
6.7 |
6.7 |
8.2 |
Saudi Arabia |
10.3 |
14.6 |
15.9 |
13.0 |
: |
4.3 |
5.1 |
6.1 |
South Africa |
: |
: |
: |
: |
: |
5.4 |
6.8 |
6.9 |
South Korea |
13.0 |
10.8 |
14.2 |
14.0 |
6.6 |
7.0 |
7.8 |
8.8 |
Turkey |
: |
: |
: |
: |
14.9 |
15.2 |
15.7 |
16.5 |
United States |
54.7 |
53.1 |
57.0 |
56.8 |
75.1 |
67.5 |
78.1 |
83.5 |
World |
: |
: |
: |
: |
: |
: |
699.0 |
740.0 |
Source: the United Nations World Tourism Organisation (World tourism barometer and Tourism highlights, 2012)
|
The EU in the world 2013 — a statistical portrait |
|
81 |
|
|
|
|
|
|
|
|
|
|
|
|
|
|
|
|
|
|
|||||
7 |
|
|
|
|
|
Industry, trade and services, tourism and the information society |
|
||||||||||||||
|
|
|
|
|
|||||||||||||||||
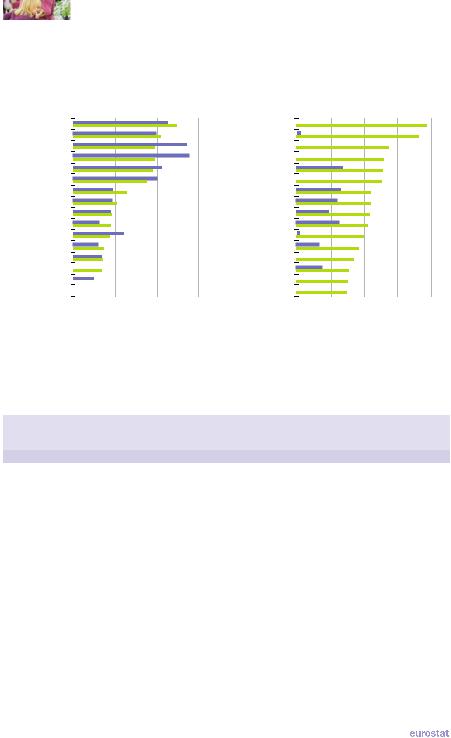
Figure 7.6: Telephone subscriptions, 2001 and 2011 |
|
|
|
|
|
|
|
|
|||||||||||||
(number per 100 inhabitants) |
|
|
|
|
|
|
|
|
|
|
|
|
|||||||||
|
|
|
|
Fixed telephone subscriptions |
|
|
|
|
Mobile cellular subscriptions |
|
|||||||||||
0 |
25 |
|
50 |
75 |
0 |
50 |
100 |
150 |
200 |
||||||||||||
|
|
|
|
|
|
|
|
|
|
|
|
|
|
|
|
|
|
|
|
||
|
South Korea |
|
|
|
|
|
|
|
|
|
Saudi Arabia |
|
|
|
|
|
|
|
|
|
|
|
|
|
|
|
|
|
|
|
|
|
|
|
|
|
|
|
|
|
|||
|
Japan |
|
|
|
|
|
|
|
|
|
Russia |
|
|
|
|
|
|
|
|
|
|
|
United States (1) |
|
|
|
|
|
|
|
|
|
Argentina |
|
|
|
|
|
|
|
|
|
|
|
|
|
|
|
|
|
|
|
|
|
|
|
|
|
|
|
|
|
|||
|
Canada |
|
|
|
|
|
|
|
|
|
South Africa |
|
|
|
|
|
|
|
|
|
|
|
|
|
|
|
|
|
|
|
|
|
|
|
|
|
|
|
|
|
|||
|
Australia (2) |
|
|
|
|
|
|
|
|
|
EU-27 (3) |
|
|
|
|
|
|
|
|
|
|
|
EU-27 (3) |
|
|
|
|
|
|
|
|
|
Brazil |
|
|
|
|
|
|
|
|
|
|
|
|
|
|
|
|
|
|
|
|
|
|
|
|
|
|
|
|
|
|||
|
Russia |
|
|
|
|
|
|
|
|
|
South Korea |
|
|
|
|
|
|
|
|
|
|
|
Argentina (4) |
|
|
|
|
|
|
|
|
|
Australia |
|
|
|
|
|
|
|
|
|
|
|
Brazil |
|
|
|
|
|
|
|
|
|
United States |
|
|
|
|
|
|
|
|
|
|
|
China |
|
|
|
|
|
|
|
|
|
Japan |
|
|
|
|
|
|
|
|
|
|
|
Turkey |
|
|
|
|
|
|
|
|
|
Indonesia |
|
|
|
|
|
|
|
|
|
|
|
Mexico (5) |
|
|
|
|
|
|
|
|
|
Turkey |
|
|
|
|
|
|
|
|
|
|
|
Saudi Arabia |
|
|
|
|
|
|
|
|
|
Mexico (5) |
|
|
|
|
|
|
|
|
|
|
|
|
|
|
|
|
|
|
|
|
|
|
|
|
|
|
|
|
|
|||
|
Indonesia |
|
|
|
|
|
|
|
|
|
Canada |
|
|
|
|
|
|
|
|
|
|
|
|
|
|
|
|
|
|
|
|
|
|
|
|
|
|
|
|
||||
|
South Africa |
|
|
|
|
|
|
|
|
|
China |
|
|
|
|
|
|
|
|
|
|
|
India |
|
|
|
|
|
|
2001 |
|
|
India |
|
|
|
|
|
|
2001 |
|
|
|
|
|
|
|
|
|
|
|
|
|
|
|
|
|
|
|
||||||
|
|
|
|
|
|
|
|
|
|
|
|
|
|
|
|
|
|||||
|
|
|
|
|
|
|
|
|
|
|
|
|
|
|
|
||||||
|
|
|
|
|
|
|
|
|
|
|
|
|
|
|
|
||||||
|
|
|
|
|
|
2011 |
|
|
|
|
|
|
|
|
|
2011 |
|
|
|||
|
|
|
|
|
|
|
|
|
|
|
|
|
|
|
|
||||||
|
|
|
|
|
|
|
|
|
|
|
|
|
|
|
|
||||||
(1) 2001, local loops. (2) 2001, excludes ISDN. (3) Data for 2009 instead of 2011. (4) 2001, only refers to Telefónica de Argentina S.A. and Telecom Argentina S.A. (5) 2011, preliminary.
Source: Eurostat (online data code: isoc_tc_ac2) and the International Telecommunication Union
Table 7.4: ICT access and usage, 2001, 2006 and 2011
(% or per 100 inhabitants)
|
Individuals using the internet |
Fixed broadband subscriptions |
||||||
|
|
(% of total) |
|
|
(per 100 inhabitants) |
|
||
|
2001 |
2006 |
2011 |
2001 |
|
2006 |
|
2011 |
EU-27 (1)(2) |
: |
55.0 |
73.0 |
1.3 |
|
16.5 |
|
27.2 |
Argentina |
9.8 |
20.9 |
47.7 |
0.3 |
|
4.1 |
|
10.5 |
Australia (3) |
52.7 |
66.0 |
79.0 |
0.6 |
|
18.8 |
|
23.9 |
Brazil (4) |
4.5 |
28.2 |
45.0 |
0.2 |
|
2.5 |
|
8.6 |
Canada (5) |
60.2 |
72.4 |
83.0 |
9.2 |
|
24.7 |
|
32.0 |
China (6) |
2.6 |
10.5 |
38.3 |
0.0 |
|
3.9 |
|
11.6 |
India |
0.7 |
2.8 |
10.1 |
0.0 |
|
0.2 |
|
1.0 |
Indonesia |
2.0 |
4.8 |
18.0 |
0.0 |
|
0.1 |
|
1.1 |
Japan (7) |
38.5 |
68.7 |
79.5 |
3.0 |
|
20.9 |
|
27.4 |
Mexico |
7.0 |
19.5 |
36.2 |
0.0 |
|
2.8 |
|
10.6 |
Russia |
2.9 |
18.0 |
49.0 |
0.0 |
|
2.0 |
|
12.2 |
Saudi Arabia |
4.7 |
19.5 |
47.5 |
0.1 |
|
0.9 |
|
5.7 |
South Africa (8) |
6.3 |
7.6 |
21.0 |
0.0 |
|
0.7 |
|
1.8 |
South Korea (9) |
56.6 |
78.1 |
83.8 |
16.9 |
|
29.7 |
|
36.9 |
Turkey (10) |
5.2 |
18.2 |
42.1 |
0.0 |
|
4.0 |
|
10.3 |
United States |
49.1 |
68.9 |
77.9 |
4.5 |
|
20.1 |
|
28.7 |
(1) Use of the internet, persons aged 16 to 74. (2) Broadband subscriptions, based on sum of data for 27 EU Member States. (3) Use of the internet, 2006 and 2011, persons aged 15 or more. (4) Use of the internet, 2006 and 2011, persons aged 10 or more; use of the internet, 2011, use within three months prior to the survey. (5) Use of the internet, 2006, persons aged 16 or more. (6) Use of the internet, 2006, persons aged 6 or more, online at least one hour per week. (7) Use of the internet, 2001, PC based only; use of the internet, 2006, persons aged 6 or more. (8) Broadband subscriptions, data for 2002 instead of 2001. (9) Use of the internet, persons aged 3 or more; use of the internet, 2001, use within the month prior to the survey. (10) Use of the internet, 2001, persons aged 16 to 74.
Source: Eurostat (online data code: isoc_ci_eu_i) and the International Telecommunication Union
82 |
|
The EU in the world 2013 — a statistical portrait |
|
|

|
|
|
Industry, trade and services, tourism and the information society |
|
7 |
|
|
Telecommunication networks and services are the backbone of the information society. Individuals, enterprises and public organisations alike depend increasingly on convenient, reliable and high-speed telecommunication networks and services. During recent years a shift in the importance of various services can be noted, from wired networks to mobile networks and from voice services to data services. While the number of fixed telephone subscriptions relative to the size of the population increased between 2001 and 2011 in some of the G20 members, notably Indonesia, it was mobile subscriptions where the largest increases were generally recorded – see Figure 7.6. By 2011 several G20 members registered more mobile subscriptions than inhabitants (indicating that some users had more than one subscription), with the highest ratio of subscriptions to inhabitants in Saudi Arabia.
Table 7.4 shows that there was also widespread growth between 2001 and 2011 in the use of the internet, even among G20 members with already high usage in 2001. By 2011 Canada and South Korea topped the ranking of internet use, with more than four in every five inhabitants online, with Japan, Australia and the United States just below this level. The number of fixed broadband subscriptions relative to population size was more diverse, with South Korea and Canada exceeding 30 subscriptions per 100 inhabitants, whereas in South Africa, Indonesia and India this ratio was below 2 subscriptions per 100 inhabitants.
Table 7.5 provides a selection of key indicators concerning ICT usage in enterprises – it should be noted that the usage of ICT depends to some extent on enterprise size and the sector of operation, and so differences in coverage can affect the comparability of results.
Table 7.5: ICT access and usage, enterprises, 2009
(% of enterprises)
|
|
Proportion of enterprises: |
|
|
using the internet |
with a web presence |
receiving orders over the internet |
EU-27 (1) |
95.0 |
69.0 |
13.0 |
Argentina |
: |
: |
: |
Australia (2) |
87.0 |
36.0 |
24.0 |
Brazil (3) |
92.7 |
52.8 |
40.8 |
Canada (2) |
94.9 |
69.7 |
13.1 |
China |
: |
: |
: |
Hong Kong |
60.6 |
20.0 |
1.5 |
Macao (2) |
35.8 |
: |
10.0 |
India |
: |
: |
: |
Indonesia |
: |
: |
: |
Japan (4) |
99.6 |
91.6 |
23.3 |
Mexico |
: |
: |
: |
Russia (5) |
76.2 |
25.3 |
11.8 |
Saudi Arabia |
: |
: |
: |
South Africa |
: |
: |
: |
South Korea (5) |
48.7 |
12.3 |
2.0 |
Turkey |
88.8 |
52.2 |
9.1 |
United States |
: |
: |
: |
(1) Data for 2011 instead of 2009; enterprises receiving orders via computer networks (not only over the internet); enterprises with 10 or more persons employed which have their main activity in NACE Rev. 2 Sections C to J and L to N and Group 95.1.
(2) 2007.
(3) Enterprises with more than 9 employees. (4) Sample results.
(5) 2008.
Source: Eurostat (online data codes: isoc_ci_eu_en2 and isoc_ec_eseln2) and the United Nations Conference on Trade and Development (Unctadstat: core indicators on ICT use by business)
|
The EU in the world 2013 — a statistical portrait |
|
83 |
|