
Energy
A competitive, reliable and sustainable energy sector is essential for all advanced economies. The energy sector has been under the spotlight in recent years due to a number of issues that have pushed energy up the political agenda, including the volatility of oil prices, interruptions to energy supplies, and increased attention to anthropogenic (human-induced) effects on climate change, in particular, increased greenhouse gas emissions.
Main findings
Primary production of energy in the EU 27 totalled 830.9 million tonnes of oil equivalent (toe) in 2010. This represented an increase in comparison with the production level for 2009 (813.7 million toe) in contrast to the generally downward trend of EU 27 production; primary production in the EU 27 has generally fallen in recent years as supplies of raw materials become exhausted and/or producers considered the exploitation of limited resources uneconomical. Worldwide primary production of energy reached 12 268 million toe in 2009. The members of the G20 accounted for approximately 72 % of the world’s energy production, with China, the United States (2010 data) and Russia recording higher production than the EU 27.
Between 2000 and 2009 global primary production of energy increased 22.8 %. China’s primary production almost doubled during this period, while output in Brazil and Indonesia increased by approximately one half; India also recorded growth above the world average as did Australia and South Korea between 2000 and 2010. Mexico, Japan and the EU 27 all recorded lower primary production of energy in 2010 than in 2000.
|
The EU in the world 2013 — a statistical portrait |
|
117 |
|
|
|
|
|
|
|
|
|
|
12 |
|
Energy |
|
|
|
|
|
|
|
|
|
|
|
|
|
|
|
Table 12.1: Production of primary energy, 2000 and 2009 |
|
|
|
|||||
|
|
|
|
|
|
|
|
|
|
|
Production |
Analysis by energy type (excluding heat), 2009 (%) |
|||||
|
|
(million toe) |
||||||
|
|
|
|
|
|
|
||
|
|
|
|
Coal and |
Crude |
Natural |
Nuclear |
Renew- |
|
|
2000 |
2009 |
ables & |
||||
|
|
lignite |
oil |
gas |
energy |
|||
|
|
|
|
waste |
||||
|
|
|
|
|
|
|
|
|
|
EU-27 (1) |
940.6 |
830.9 |
19.6 |
11.7 |
18.8 |
28.5 |
21.4 |
|
Argentina |
: |
80.8 |
0.1 |
43.7 |
46.0 |
2.6 |
7.6 |
|
Australia (2) |
233.6 |
324.0 |
76.2 |
8.2 |
13.3 |
0.0 |
2.4 |
|
Brazil |
148.3 |
230.3 |
1.0 |
45.1 |
4.3 |
1.5 |
48.1 |
|
Canada (2) |
372.7 |
395.8 |
8.1 |
40.1 |
34.7 |
6.0 |
11.1 |
|
China |
1 064.0 |
2 084.9 |
73.8 |
9.1 |
3.4 |
0.9 |
12.8 |
|
India |
366.4 |
502.5 |
48.6 |
7.7 |
7.7 |
1.0 |
35.1 |
|
Indonesia |
236.3 |
351.8 |
47.4 |
13.7 |
19.1 |
0.0 |
19.9 |
|
Japan (2) |
105.8 |
95.1 |
0.0 |
0.8 |
3.7 |
77.7 |
17.8 |
|
Mexico (2) |
222.3 |
217.7 |
2.3 |
71.4 |
17.4 |
1.2 |
7.6 |
|
Russia |
978.0 |
1 181.6 |
13.0 |
41.8 |
39.7 |
3.6 |
1.8 |
|
Saudi Arabia |
: |
528.4 |
0.0 |
88.4 |
11.6 |
0.0 |
0.0 |
|
South Africa |
145.6 |
160.6 |
88.2 |
0.1 |
0.5 |
2.1 |
9.1 |
|
South Korea (2) |
34.4 |
44.6 |
2.6 |
1.6 |
1.0 |
86.9 |
7.7 |
|
Turkey (2) |
25.9 |
30.3 |
57.5 |
7.8 |
1.9 |
0.0 |
32.8 |
|
United States (2) |
1 667.3 |
1 740.9 |
31.4 |
20.0 |
28.4 |
12.8 |
7.4 |
|
World |
9 992.9 |
12 268.2 |
28.1 |
32.5 |
20.6 |
5.7 |
13.2 |
(1) Data for 2010 instead of 2009.
(2) Production total for 2010 instead of 2009.
Source: Eurostat (online data codes: ten00076, ten00077, ten00078, ten00079, ten00080 and ten00081), the OECD (Energy and transportation) and the International Energy Agency (Energy balances)
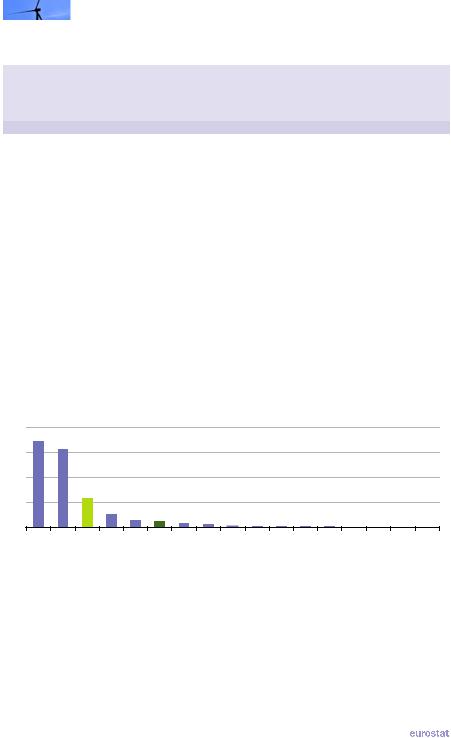
Figure 12.1: Contribution of nuclear energy to primary production, 2009
(%) |
|
|
|
|
|
|
|
|
|
|
|
|
|
|
|
|
|
100 |
|
|
|
|
|
|
|
|
|
|
|
|
|
|
|
|
|
|
75 |
|
|
|
|
|
|
|
|
|
|
|
|
|
|
|
|
|
50 |
|
|
|
|
|
|
|
|
|
|
|
|
|
|
|
|
|
25 |
|
|
|
|
|
|
|
|
|
|
|
|
|
|
|
|
|
0 |
Japan |
|
|
|
|
Russia |
|
|
|
|
India |
|
|
Indonesia |
SaudiArabia |
|
|
KoreaSouth |
EU-(271) |
StatesUnited |
Canada |
World |
Argentina |
AfricaSouth |
Brazil |
Mexico |
China |
Australia |
Turkey |
|||||
(1) |
2010. |
|
|
|
|
|
|
|
|
|
|
|
|
|
|
|
|
Source: Eurostat (online data codes: ten00076 and ten00080) and the International Energy Agency (Energy balances)
118 |
|
The EU in the world 2013 — a statistical portrait |
|
|
Energy  12
12
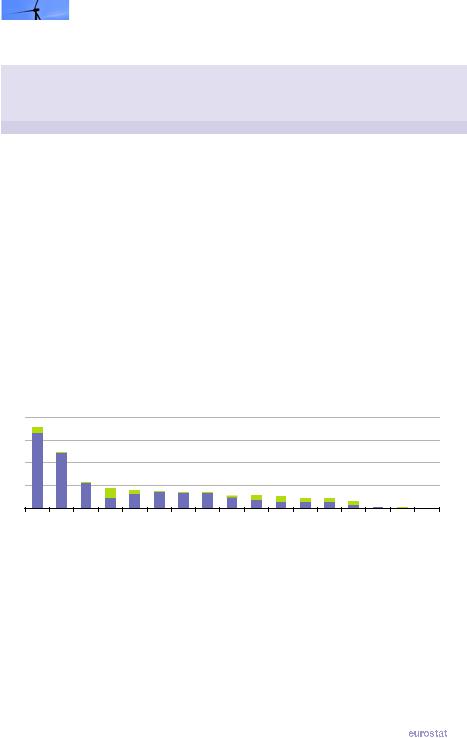
For many of the G20 members the mix of energy sources for primary production was dominated by just one type. In South Africa, Australia and China more than three quarters of primary production came from coal and lignite, in Saudi Arabia and Mexico crude oil was dominant, while in South Korea and Japan nuclear energy contributed by far the largest share. Production in Brazil, India and Turkey was a mixture from renewables and waste as well as one type of fossil fuel, crude oil for Brazil and coal and lignite for India and Turkey. By contrast Argentina, Canada, Indonesia, Russia and the United States had large shares of production spread across two or three types of fossil fuels, with none of them accounting for 50 % or more of total production. Production in the EU 27 was more varied than in any of the other G20 members with all five types of energy sources shown in Table 12.1 attaining a 10 % share of total production, but none exceeding 30 %; this variety reflects the availability of different fossil fuel deposits and the potential for hydro power among EU Member States as well as differing policies towards nuclear fuels and investment in renewables.
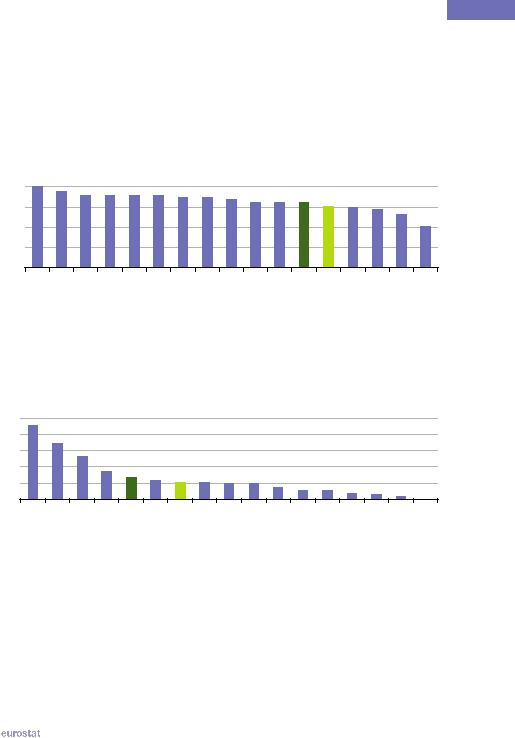
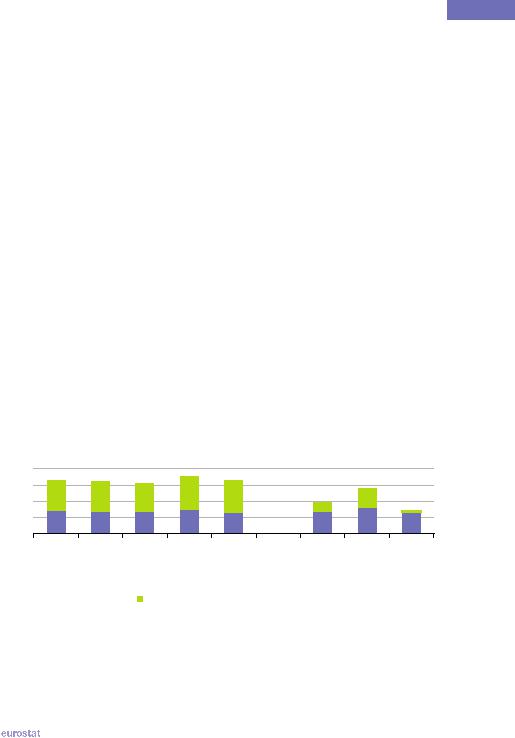
The importance of nuclear power as a source of primary production of energy in Japan and South Korea has already been noted, and this can be clearly seen from Figure 12.1. The EU 27 was the only other G20 member where more than one quarter of primary energy production was from nuclear energy, while the United States recorded the fourth largest nuclear energy share. Worldwide, renewables and waste (which includes non-renewable industrial and municipal waste) contributed 13.2 % of the primary production of energy (see Figure 12.2), a share that was exceeded in Brazil, India and Turkey (all above 30 %), as well as in the EU 27, Indonesia and Japan. The share of renewables and waste in primary production was particularly low in Australia, Russia and Saudi Arabia, all of which are large exporters of fossil fuels.
Figure 12.2: Contribution of renewables and waste to primary production, 2009
(%) |
|
|
|
|
|
|
|
|
|
|
|
|
|
|
|
|
50 |
|
|
|
|
|
|
|
|
|
|
|
|
|
|
|
|
40 |
|
|
|
|
|
|
|
|
|
|
|
|
|
|
|
|
30 |
|
|
|
|
|
|
|
|
|
|
|
|
|
|
|
|
20 |
|
|
|
|
|
|
|
|
|
|
|
|
|
|
|
|
10 |
|
|
|
|
|
|
|
|
|
|
|
|
|
|
|
|
0 |
India |
|
|
Indonesia |
Japan |
World |
|
|
AfricaSouth |
KoreaSouth |
|
|
|
|
Russia |
ArabiaSaudi |
Brazil |
Turkey |
EU-(271) |
China |
Canada |
Argentina |
Mexico |
StatesUnited |
Australia |
||||||||
(1) 2010. |
|
|
|
|
|
|
|
|
|
|
|
|
|
|
|
|
Source: Eurostat (online data codes: ten00076 and ten00081) and the International Energy Agency (Energy balances)
|
The EU in the world 2013 — a statistical portrait |
|
119 |
|

12  Energy
Worldwide gross consumption of energy was 12 140.9 million toe in 2009, of which the G20 members accounted for around four fifths, significantly higher than their collective share of production. After three years of falling consumption that broadly coincided with the global financial and economic crisis, the EU 27’s gross inland consumption rose from 1 703.4 million toe in 2009 to 1 759.0 million toe in 2010. Between 2000 and 2009 global consumption increased by 21.0 % and China’s gross inland consumption more than doubled. The United States and Japan were the only G20 members to record lower gross inland consumption in 2010 than in 2000.
Just over one quarter of worldwide gross consumption of energy in 2009 was coal and lignite, one third was crude oil and oil products, and one fifth was gas; combined these three fuels accounted for four fifths (80.9 %) of global energy consumption. Gross inland consumption was entirely satisfied by such fuels in Saudi Arabia and these three fuels provided more than 90 % of gross inland consumption in Australia and Russia – see Figure 12.3.
Japan and South Korea had the highest shares of nuclear energy in gross inland consumption, just over 15 %, but these shares were considerably lower than for primary production, indicating the high dependency of these two countries on imported fossil fuels, notably crude oil and oil products.
Table 12.2: Gross inland consumption, 2000 and 2009
|
Consumption |
|
|
(million toe) |
|
|
2000 |
2009 |
|
|
|
EU-27 (2) |
1 724.9 |
1 759.0 |
Argentina |
: |
74.3 |
Australia (3) |
108.1 |
125.8 |
Brazil |
189.2 |
240.2 |
Canada (3) |
251.4 |
255.3 |
China |
1 094.9 |
2 257.1 |
India |
457.2 |
675.8 |
Indonesia |
155.7 |
202.0 |
Japan (3) |
518.9 |
494.9 |
Mexico (3) |
145.1 |
169.8 |
Russia |
619.3 |
646.9 |
Saudi Arabia |
: |
157.9 |
South Africa |
114.4 |
144.0 |
South Korea (3) |
188.1 |
246.5 |
Turkey (3) |
76.3 |
104.8 |
United States (3) |
2 273.3 |
2 235.0 |
World |
10 031.8 |
12 140.9 |
Analysis by energy type, 2009 (%)
Coal and lignite |
Crude oil and oil products |
Gas |
Nuclear energy |
Renewables and waste |
Electricity and heat (1) |
|
|
|
|
|
|
15.9 |
35.1 |
25.1 |
13.4 |
10.4 |
0.0 |
1.7 |
35.6 |
52.1 |
2.9 |
7.0 |
0.7 |
42.0 |
30.8 |
21.6 |
0.0 |
5.6 |
0.0 |
4.6 |
39.7 |
7.1 |
1.4 |
45.8 |
1.5 |
9.4 |
34.6 |
31.0 |
9.3 |
17.0 |
-1.1 |
67.2 |
16.8 |
3.3 |
0.8 |
11.9 |
0.0 |
42.2 |
23.6 |
7.2 |
0.7 |
26.1 |
0.1 |
15.1 |
33.1 |
17.4 |
0.0 |
34.4 |
0.0 |
21.5 |
42.5 |
17.1 |
15.4 |
3.5 |
0.0 |
4.4 |
56.7 |
27.8 |
1.6 |
9.6 |
0.0 |
14.7 |
21.3 |
54.1 |
6.6 |
3.4 |
-0.2 |
0.0 |
61.1 |
38.9 |
0.0 |
0.0 |
0.0 |
68.3 |
17.0 |
2.6 |
2.3 |
10.0 |
-0.1 |
28.3 |
39.5 |
13.8 |
16.8 |
1.5 |
0.0 |
30.5 |
29.8 |
29.6 |
0.0 |
10.2 |
-0.1 |
22.4 |
37.0 |
24.7 |
10.0 |
5.7 |
0.1 |
27.2 |
32.8 |
20.9 |
5.8 |
13.3 |
0.0 |
(1) Gross inland consumption of electricity and heat is equal to electricity net imports. (2) Data for 2010 instead of 2009.
(3) Consumption total for 2010 instead of 2009.
Source: Eurostat (online data codes: ten00086, nrg_101a, nrg_102a, nrg_103a, nrg_104a, nrg_105a, nrg_106a and nrg_1071a), the OECD (Energy and transportation) and the International Energy Agency (Energy balances)
120 |
|
The EU in the world 2013 — a statistical portrait |
|
|
Energy  12
12
Worldwide, renewables and waste accounted for 13.3 % of gross consumption (see Figure 12.4). As for primary production, Brazil, Indonesia and India recorded above average shares for renewables and waste in gross inland consumption, as did Canada, reflecting its large net exports of fossil fuels. By contrast, the EU 27, Turkey and Japan recorded below average shares of renewables and waste in gross inland consumption, despite above average primary production, reflecting their net imports of fossil fuels.
Figure 12.3: Share of coal, lignite, oil and gas in gross inland consumption, 2009
(%) |
100 |
75 |
50 |
25 |
0 |
SaudiArabia |
Australia |
Russia |
Turkey |
Argentina |
Mexico |
SouthAfrica |
China |
UnitedStates |
SouthKorea |
Japan |
World |
EU-27(1) |
Canada |
India |
Indonesia |
Brazil |
(1) 2010.
Source: Eurostat (online data codes: ten00086, nrg_101a, nrg_102a and nrg_103a) and the International Energy Agency (Energy balances)
Figure 12.4: Share of renewables and waste in gross inland consumption, 2009
(%) |
|
|
|
|
|
|
|
|
|
|
|
|
|
|
|
|
50 |
|
|
|
|
|
|
|
|
|
|
|
|
|
|
|
|
40 |
|
|
|
|
|
|
|
|
|
|
|
|
|
|
|
|
30 |
|
|
|
|
|
|
|
|
|
|
|
|
|
|
|
|
20 |
|
|
|
|
|
|
|
|
|
|
|
|
|
|
|
|
10 |
|
|
|
|
|
|
|
|
|
|
|
|
|
|
|
|
0 |
|
|
|
|
|
|
|
|
|
|
|
|
|
|
|
|
Brazil |
Indonesia |
India |
Canada |
World |
China |
EU-(271) |
Turkey |
AfricaSouth |
Mexico |
Argentina |
StatesUnited |
Australia |
Japan |
Russia |
KoreaSouth |
ArabiaSaudi |
(1) 2010. |
|
|
|
|
|
|
|
|
|
|
|
|
|
|
|
|
Source: Eurostat (online data codes: ten00086 and nrg_1071a) and the International Energy Agency (Energy balances)
|
The EU in the world 2013 — a statistical portrait |
|
121 |
|
12  Energy
The difference between the levels of production and consumption in Tables 12.1 and 12.2 is accounted for by stock changes, international bunkers and international trade: a shortfall of production is met by positive net imports (the balance of imports minus exports) and a production surplus accompanied by negative net imports (positive net exports).
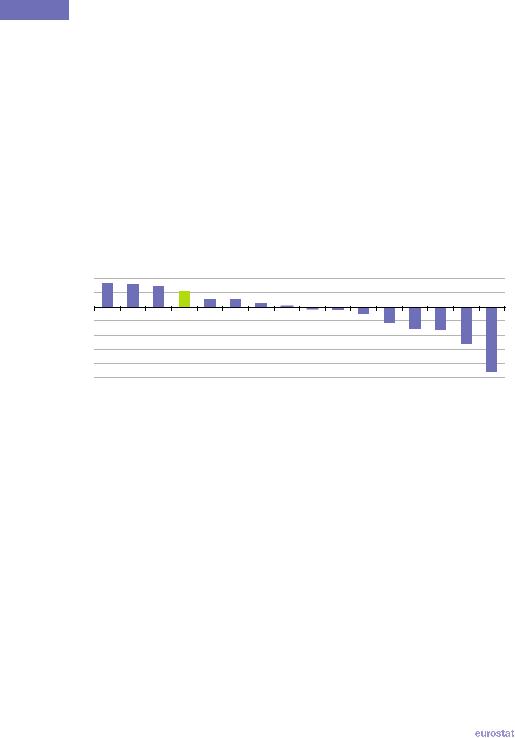
The energy dependency indicator in Figure 12.5 reveals the extent to which gross inland consumption is met by net imports – countries with a negative dependency are net exporters. South Korea, Japan, Turkey and the EU 27 all had energy dependency ratios in excess of 50 % indicating that more than half of their gross inland consumption was met by imports. Smaller, positive dependency ratios were also recorded for India, the United States, China and Brazil. Australia’s net exports exceeded its gross inland consumption resulting in an energy dependency ratio that was below -100 %, while Saudi Arabia’s net exports were more than twice as high as its gross inland consumption.
Figure 12.5: Energy dependency, 2009(1) |
|
|
|
|
|
|
|
|
|
||||||
(%) |
|
|
|
|
|
|
|
|
|
|
|
|
|
|
|
100 |
|
|
|
|
|
|
|
|
|
|
|
|
|
|
|
50 |
|
|
|
|
|
|
|
|
|
|
|
|
|
|
|
0 |
|
|
|
|
|
|
|
|
|
|
|
|
|
|
|
-50 |
|
|
|
|
|
|
|
|
|
|
|
|
|
|
|
-100 |
|
|
|
|
|
|
|
|
|
|
|
|
|
|
|
-150 |
|
|
|
|
|
|
|
|
|
|
|
|
|
|
|
-200 |
|
|
|
|
|
|
|
|
|
|
|
|
|
|
|
-250 |
Japan |
|
|
India |
|
|
|
|
|
|
|
Indonesia |
Russia |
|
ArabiaSaudi |
KoreaSouth |
Turkey |
EU-(272) |
StatesUnited |
China |
Brazil |
Argentina |
AfricaSouth |
Mexico |
Canada |
Australia |
|||||
(1) Net imports divided by the sum of gross inland energy consumption plus bunkers, expressed as a percentage. (2) 2010.
Source: Eurostat (online data code: tsdcc310) and the International Energy Agency (Energy balances)
122 |
|
The EU in the world 2013 — a statistical portrait |
|
|
Energy  12
12
Energy intensity is an indicator of an economy’s energy efficiency and relates the quantity of energy consumed to the level of economic output, the latter represented by gross domestic product (GDP). In order to facilitate a comparison over time, GDP is shown in constant prices to remove the effects of inflation; to facilitate spatial comparisons GDP is calculated in a common currency (United States dollars are used in Figure 12.6) using purchasing power parities rather than market exchange rates. It should be noted that the economic structure of an economy plays an important role in determining energy intensity, as post-industrial economies with large service sectors will, a priori, have considerably lower energy use than economies characterised by heavy, traditional, industrial activities.
Energy intensity fell between 2000 and 2009 (2010 for some countries) for all G20 members for whom data are available – see Figure 12.6 – except for Brazil where the relatively low energy intensity remained stable. Between 2000 and 2009, substantial energy efficiencies were introduced in the Russian economy as its energy intensity fell by about one third; nevertheless, Russia, along with Saudi Arabia, had the highest energy intensity among the G20 members in 2009. After Russia, the largest falls in energy intensity were recorded by India, the United States and Canada. The most recent data (for 2009 or 2010) shows that the economies of Argentina and Turkey had the lowest energy intensities.
Figure 12.6: Energy intensity, 2000 and 2009(1)
(toe per USD 1 000, international PPP)
0.75 |
|
|
|
|
|
|
|
|
|
|
|
|
|
|
|
|
0.50 |
|
|
|
|
|
|
|
|
|
|
|
|
|
|
|
|
0.25 |
|
|
|
|
|
|
|
|
|
|
|
|
|
|
|
|
0.00 |
(ArabiaSaudi2) |
AfricaSouth |
(Canada3) |
Indonesia |
(KoreaSouth3) |
China |
(StatesUnited3) |
World |
(Australia3) |
Brazil |
India |
EU-27 |
(Japan3) |
(Mexico3) |
(Argentina2) |
(Turkey3) |
Russia |
||||||||||||||||
|
|
|
|
|
|
2000 |
|
|
2009 |
|
|
|
|
|
|
|
(1) Ratio between the gross inland consumption of energy and the gross domestic product (GDP); the GDP figures are at 2000 constant prices expressed in United States dollars converted using international purchasing power parities.
(2) 2000, not available.
(3) Data for 2010 instead of 2009.
Source: the OECD (Factbook 2012) and the International Energy Agency (Key world energy statistics, 2011)
|
The EU in the world 2013 — a statistical portrait |
|
123 |
|
|
|
|
|
|
|
|
|
|
|
|
12 |
|
Energy |
|
|
|
|
|
|
|
|
|
|
|
|
|
|
|
|
|
|
|
Table 12.3: Gross electricity generation, 2009 |
|
|
|
|
|
|||||
|
|
|
|
|
|
|
|
|
|
|
|
|
Total |
|
|
|
Analysis by source (%) |
|
|
||
|
|
|
|
|
|
|
|
|
Other |
|
|
|
(GWh) |
Coal and |
Oil |
|
Gas |
Nuclear |
Hydro (1) |
renew- |
Other |
|
|
|
lignite |
|
|
|
|
|
ables & |
|
|
|
|
|
|
|
|
|
|
waste |
|
|
EU-27 (2) |
3 345 618 |
25.7 |
2.6 |
|
22.6 |
27.4 |
11.9 |
9.6 |
0.2 |
|
Argentina |
122 347 |
2.3 |
10.4 |
|
51.1 |
6.7 |
28.0 |
1.4 |
0.0 |
|
Australia |
260 965 |
77.9 |
1.0 |
|
13.7 |
0.0 |
4.7 |
2.6 |
0.0 |
|
Brazil |
466 468 |
2.1 |
3.1 |
|
2.9 |
2.8 |
83.8 |
5.2 |
0.1 |
|
Canada |
603 234 |
15.2 |
1.4 |
|
6.2 |
15.0 |
60.3 |
1.9 |
0.0 |
|
China |
3 695 928 |
78.8 |
0.4 |
|
1.4 |
1.9 |
16.7 |
0.8 |
0.0 |
|
India |
899 389 |
68.6 |
2.9 |
|
12.4 |
2.1 |
11.9 |
2.2 |
0.0 |
|
Indonesia |
155 470 |
41.8 |
22.8 |
|
22.1 |
0.0 |
7.3 |
6.0 |
0.0 |
|
Japan |
1 047 919 |
26.7 |
8.7 |
|
27.2 |
26.7 |
7.8 |
2.9 |
0.0 |
|
Mexico |
261 018 |
11.3 |
17.5 |
|
53.1 |
4.0 |
10.2 |
3.9 |
0.0 |
|
Russia |
991 980 |
16.5 |
1.6 |
|
47.3 |
16.5 |
17.8 |
0.3 |
0.0 |
|
Saudi Arabia |
217 082 |
0.0 |
55.2 |
|
44.8 |
0.0 |
0.0 |
0.0 |
0.0 |
|
South Africa |
249 557 |
93.0 |
0.0 |
|
0.0 |
5.1 |
1.7 |
0.1 |
0.0 |
|
South Korea |
454 504 |
46.0 |
4.4 |
|
15.5 |
32.5 |
1.2 |
0.4 |
0.0 |
|
Turkey |
194 813 |
28.6 |
2.5 |
|
49.3 |
0.0 |
18.5 |
1.2 |
0.0 |
|
United States |
4 188 214 |
45.2 |
1.2 |
|
22.7 |
19.8 |
7.1 |
4.0 |
0.0 |
|
World |
20 132 212 |
40.3 |
5.1 |
|
21.4 |
13.4 |
16.5 |
3.2 |
0.1 |
(1) Includes production from pumped hydro. (2) 2010.
Source: Eurostat (online data codes: ten00087 and nrg_105a) and the International Energy Agency (Electricity)
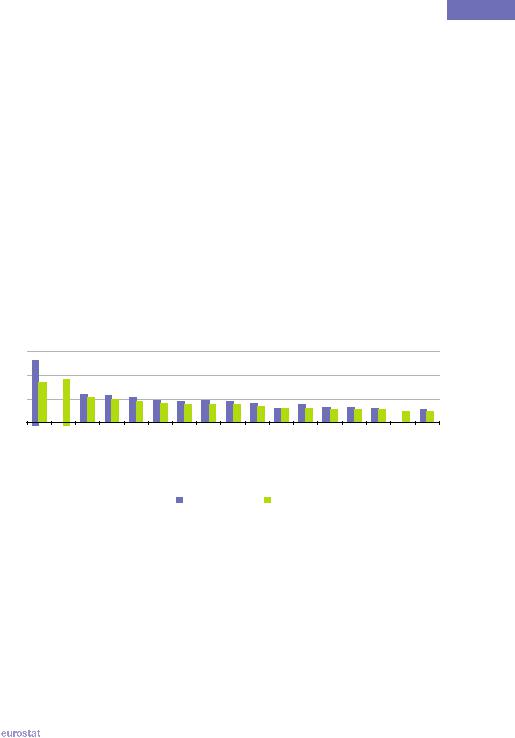
Figure 12.7: Share of renewables and waste in gross electricity generation, 2009
(%) |
100 |
75 |
50 |
25 |
0 |
Brazil |
Canada |
Argentina |
EU-27(1) |
World |
Turkey |
Russia |
China |
India |
Mexico |
Indonesia |
UnitedStates |
Japan |
Australia |
SouthAfrica |
SouthKorea |
SaudiArabia |
 Other renewables and waste
 Hydro (2)
(1) 2010.
(2) Includes production from pumped hydro.
Source: Eurostat (online data codes: ten00087 and nrg_105a) and the International Energy Agency (Electricity)
124 |
|
The EU in the world 2013 — a statistical portrait |
|
|
Energy  12
12
Total gross electricity generation worldwide was 20.1 million gigawatt hours (GWh) in 2009, of which 84.5 % was generated by G20 members. A total of 3.3 million GWh of electricity was generated in the EU 27 in 2010, an increase of 4.3 % over the previous year. In absolute terms the United States and China had the highest levels of electricity generation among G20 members; relative to population size Canada, the United States and Australia had the highest levels of generation, while India and Indonesia had the lowest.
Coal and lignite-fired power stations generated two fifths of electricity worldwide; this share was boosted by a high use of these fuels in South Africa, China, Australia and India. Gas-fired power stations generated more than one fifth of the world’s electricity with this fuel providing more than two fifths of the electricity generated in Mexico, Turkey, Russia and Saudi Arabia. While oil-fired power stations provided just 5.1 % of the world’s electricity, this source was dominant in Saudi Arabia. Nuclear power contributed some 27.4 % of the electricity generated in the EU 27 in 2010, which was more than double the world’s average (in 2009) and the second highest share among G20 members behind South Korea.
Hydro-electric power, other renewables and waste supplied 19.8 % of the world’s electricity in 2009, with a slightly higher share recorded in the EU 27 in 2010 (21.5 %) – see Figure 12.7. Brazil, Canada and Argentina were the G20 members with the highest proportion of gross electricity generation from renewables and waste. Hydro-electricity dominated electricity generation from renewables and waste in all G20 members, with the EU 27 having the highest share of electricity generation from renewable and waste sources other than hydro power.
Figure 12.8 provides information on retail petrol prices for the EU Member States that are G20 members, as well as three other G20 members. The final price paid by consumers in May 2012 was clearly lower in Canada and the United States than in the other countries shown and this was mainly due to much lower taxes and duties.
Figure 12.8: Retail petrol price for selected countries, May 2012(1)
(EUR per litre)
2.0 |
|
|
|
|
|
|
|
1.5 |
|
|
|
|
|
|
|
1.0 |
|
|
|
|
|
|
|
0.5 |
|
|
|
|
|
|
|
0.0 |
|
|
Italy |
|
|
Japan |
|
EU-(272) |
Germany |
France |
KingdomUnited |
Canada |
StatesUnited |
||
|
|
Taxes and duties |
|
|
|
|
|
 Basic price (excluding taxes and duties)
(1) Unleaded premium (95 RON) for EU 27 and EU Member States; regular unleaded for Canada, Japan and the United States. (2) Weighted average of prices for EU Member States; monthly values based on average of four weekly prices.
Source: European Commission (Market Observatory for Energy) and the International Energy Agency (Prices)
|
The EU in the world 2013 — a statistical portrait |
|
125 |
|