
International trade
Globalisation acquires a higher profile when it is measured by actual trade flows. There are two main sources of trade statistics: the first is international trade in goods which provides highly detailed information on the value and quantity of international trade; the second is balance of payments statistics which register all the transactions of an economy with the rest of the world. The current account of the balance of payments provides information on international trade in goods and services, as well as income (from employment and investment) and current transfers. For all these transactions, the balance of payments registers the value of exports (credits) and imports (debits).
Main findings
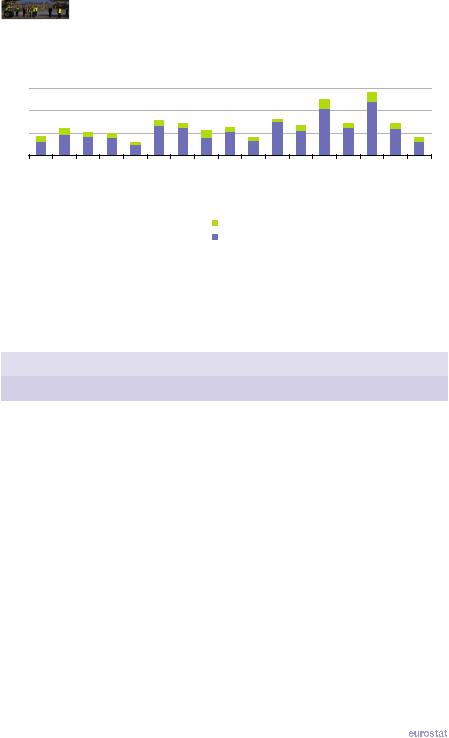
The level of international trade relative to overall economic activity (the ratio of traded goods and services to GDP) may be expected to be considerably higher for relatively small countries that are more integrated in the global economy as a result of not producing a full range of goods and services, as can be seen, for example, with Saudi Arabia and South Korea in Figure 9.1. By contrast, the United States reported the second lowest ratio of international trade (average of exports and imports) of goods and services to GDP (15.9 %) in 2011 among the G20 members, higher only than that in Brazil (12.1 %). While trade in goods dominates international trade, trade in services has grown strongly: trade in services was equivalent to 7.0 % or more of GDP in India and Saudi Arabia and reached 8.7 % of GDP in South Korea.
Relative to GDP, Saudi Arabia recorded by far the largest international trade surplus (goods and services combined) in 2011 among the G20 members, its surplus in goods outweighing its services deficit by an amount equivalent to 30.9 % of GDP; Russia (8.7 %) and China (4.0 %, 2010 data) recorded the next largest surpluses. At the other end of the scale, Turkey’s goods deficit was nearly five times as large as its services surplus, resulting in an overall deficit equivalent to 9.2 % of GDP, larger (in relative terms) than the deficits recorded for India (5.3 %, 2010 data) and the United States (3.7 %). For goods, the EU 27 recorded a trade deficit that was 1.1 % of its GDP, slightly larger than the 0.9 % of GDP trade surplus recorded for services.
|
The EU in the world 2013 — a statistical portrait |
|
93 |
|
|
|
|
9 |
|
International trade |
|
|
Figure 9.1: Trade integration, 2011(1)
(% of GDP)
60 |
|
|
|
|
|
|
|
|
|
|
|
|
|
|
|
|
40 |
|
|
|
|
|
|
|
|
|
|
|
|
|
|
|
|
20 |
|
|
|
|
|
|
|
|
|
|
|
|
|
|
|
|
0 |
|
|
|
|
|
|
|
|
|
|
|
|
|
|
|
|
EU-27 |
EA-17 |
Argentina |
(Australia2) |
Brazil |
Canada |
(China2) |
(India2) |
Indonesia |
Japan |
Mexico |
Russia |
ArabiaSaudi |
AfricaSouth |
KoreaSouth |
Turkey |
StatesUnited |
|
|
|
|
|
|
|
|
Services |
|
|
|
|
|
|
|
|
|
|
|
|
|
|
|
|
Goods |
|
|
|
|
|
|
|
|
(1) EU 27, extra-EU flows; EA-17, extra-euro area flows; other countries, flows with the rest of the world; estimates and provisional data. (2) 2010.
Source: Eurostat (online data code: tec00123), the International Monetary Fund (International Financial Statistics), the OECD (Gross domestic product), the United Nations Statistics Division
(National Accounts Main Aggregates Database) and national statistics offices
Table 9.1: Trade in goods and services, 2011(1)
(% of GDP)
|
|
Goods |
|
|
Services |
|
|
Credits |
Debits |
Balance |
Credits |
Debits |
Balance |
EU-27 |
12.3 |
13.4 |
-1.1 |
4.6 |
3.7 |
0.9 |
EA-17 |
18.8 |
18.8 |
0.0 |
5.8 |
5.2 |
0.6 |
Argentina |
18.9 |
15.8 |
3.0 |
3.2 |
3.7 |
-0.5 |
Australia (2) |
16.7 |
15.3 |
1.4 |
3.8 |
4.0 |
-0.2 |
Brazil |
10.3 |
9.1 |
1.2 |
1.6 |
3.1 |
-1.5 |
Canada |
26.7 |
26.5 |
0.1 |
4.4 |
5.8 |
-1.4 |
China (2) |
27.6 |
23.1 |
4.4 |
3.0 |
3.4 |
-0.4 |
India (2) |
13.1 |
18.8 |
-5.7 |
7.2 |
6.8 |
0.4 |
Indonesia |
23.8 |
19.6 |
4.2 |
2.4 |
3.8 |
-1.4 |
Japan |
13.4 |
13.8 |
-0.4 |
2.5 |
2.9 |
-0.4 |
Mexico |
30.4 |
30.5 |
-0.1 |
1.3 |
2.6 |
-1.2 |
Russia |
28.1 |
17.4 |
10.7 |
2.9 |
4.8 |
-1.9 |
Saudi Arabia |
63.2 |
20.8 |
42.4 |
2.0 |
13.5 |
-11.5 |
South Africa |
25.2 |
24.6 |
0.6 |
3.6 |
4.8 |
-1.2 |
South Korea |
49.5 |
46.7 |
2.8 |
8.5 |
8.9 |
-0.4 |
Turkey |
18.5 |
30.1 |
-11.6 |
5.1 |
2.7 |
2.4 |
United States |
10.0 |
14.9 |
-4.9 |
4.0 |
2.9 |
1.2 |
(1) EU 27, extra-EU flows; EA-17, extra-euro area flows; other countries, flows with the rest of the world. (2) 2010.
Source: Eurostat (online data code: tec00023, tec00044 and tec00045), the International Monetary Fund (International Financial Statistics), the OECD (Gross domestic product), the United Nations Statistics Division (National Accounts Main Aggregates Database) and national statistics offices
94 |
|
The EU in the world 2013 — a statistical portrait |
|
|

|
|
|
International trade |
|
9 |
|
|
In 2007 China overtook the United States to become the second largest exporter of goods among the G20 members, behind the EU 27. Despite the strong growth in Chinese exports, the EU 27’s exports of goods in 2011 remained higher – see Figure 9.2. By contrast, Chinese imports of goods were notably lower than imports into either the EU 27 or the United States. Together, the EU 27, China and the United States accounted for 40.0 % of global exports of goods in 2011 and 42.8 % of global imports.
Figure 9.2: Trade in goods, 2011
(EUR billion)
2 000 |
|
|
|
|
|
|
|
|
|
|
|
|
|
1 500 |
|
|
|
|
|
|
|
|
|
|
|
|
|
1 000 |
|
|
|
|
|
|
|
|
|
|
|
|
|
500 |
|
|
|
|
|
|
|
|
|
|
|
|
|
0 |
|
|
|
|
|
|
|
|
|
|
|
|
|
EU27 (1) |
China |
StatesUnited |
Japan |
KoreaSouth |
Russia |
Canada |
Mexico |
Brazil |
Australia |
Indonesia |
Turkey |
AfricaSouth |
Argentina |
|
|
|
|
|
Exports |
|
Imports |
|
|
|
|
||
(1) Extra-EU flows. |
|
|
|
|
|
|
|
|
|
|
|
|
|
Source: Eurostat (online data code: ext_lt_introle) and the United Nations (Comtrade)
Table 9.2: EU 27 trade in goods by partner, 2011
(EUR million)
|
|
2001 |
|
|
2011 |
|
|
EU-27 |
EU-27 |
|
EU-27 |
EU-27 |
|
|
exports |
imports |
Balance |
exports |
imports |
Balance |
|
to partner |
from partner |
|
to partner |
from partner |
|
Argentina |
5 099 |
5 761 |
-662 |
8 319 |
10 673 |
-2 354 |
Australia |
15 660 |
9 583 |
6 078 |
30 808 |
11 782 |
19 026 |
Brazil |
18 570 |
19 602 |
-1 032 |
35 728 |
37 855 |
-2 127 |
Canada |
22 391 |
18 574 |
3 817 |
29 618 |
22 868 |
6 750 |
China |
30 665 |
82 000 |
-51 335 |
136 230 |
292 235 |
-156 004 |
India |
12 950 |
13 462 |
-513 |
40 425 |
39 394 |
1 032 |
Indonesia |
4 579 |
11 610 |
-7 031 |
7 348 |
16 171 |
-8 824 |
Japan |
45 521 |
81 134 |
-35 613 |
48 961 |
67 479 |
-18 518 |
Mexico |
15 336 |
7 727 |
7 609 |
23 816 |
16 277 |
7 539 |
Russia |
31 602 |
65 874 |
-34 272 |
108 422 |
199 287 |
-90 866 |
Saudi Arabia |
13 507 |
13 165 |
342 |
26 399 |
28 125 |
-1 727 |
South Africa |
12 584 |
16 354 |
-3 771 |
25 636 |
17 773 |
7 863 |
South Korea |
15 840 |
23 265 |
-7 426 |
32 456 |
36 115 |
-3 659 |
Turkey |
21 869 |
22 085 |
-215 |
72 665 |
47 596 |
25 069 |
United States |
245 594 |
203 298 |
42 297 |
260 693 |
184 323 |
76 370 |
World (extra-EU-27) |
884 707 |
979 143 |
-94 436 |
1 531 929 |
1 687 732 |
-155 803 |
Source: Eurostat (online data code: ext_lt_maineu)
|
The EU in the world 2013 — a statistical portrait |
|
95 |
|
|
|
|
9 |
|
International trade |
|
|
The EU 27 ran a trade deficit for goods equal to EUR 155.8 billion in 2011; this was the second largest deficit among the G20 members, behind that recorded for the United States (EUR 563.8 billion). Table 9.2 shows the flows and balance of trade in goods for the EU 27 with the other G20 members. In 2011 the EU 27 had relatively large trade deficits with China and Russia, while its largest surplus was with the United States. Between 2001 and 2011 the EU 27’s goods trade balance with India, South Africa and Turkey developed from a deficit into a surplus, whereas this situation was reversed with Saudi Arabia.
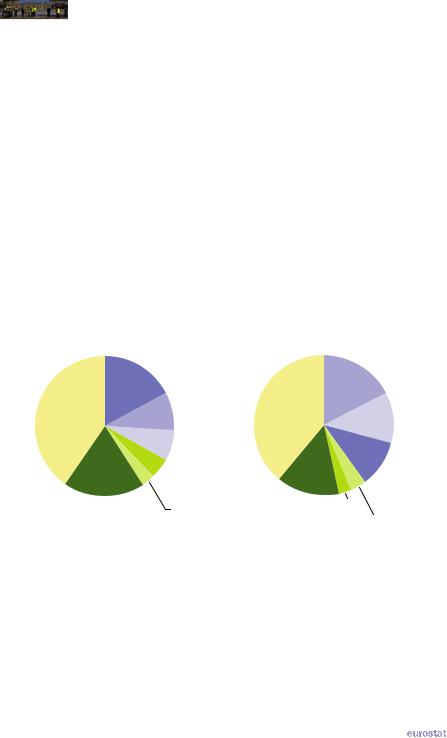
The two parts of Figure 9.3 analyse the importance of the other G20 members for the EU 27’s trade in goods. Close to three fifths of all EU 27 exports of goods in 2011 were destined for G20 members, most notably the United States (17.0 % share), China (8.9 %) and Russia (7.1 %); the EU 27’s main export market outside of the G20 was Switzerland which was the destination for 7.9 % of the EU 27’s exports. Collectively the G20 members provided just over three fifths of the EU 27’s imports of goods, with China (17.3 %), Russia (11.8 %) and the United States (10.9 %) the main countries of origin; Norway (5.5 %) and Switzerland (5.4 %) provided similar shares of the EU 27’s imports.
Figure 9.3: Main G20 trading partners for EU 27 exports and imports of goods, 2011
(% share of extra-EU 27 flows)
Exports
United States 17.0%
Rest of the world
40.2% China (1)
8.9%
Russia
7.1%
Turkey
4.7%
Japan Remaining 3.2%
G20 countries (2)
18.9%
(1) Excluding Hong Kong.
(2) Including Hong Kong.
Source: Eurostat (online data code: ext_lt_maineu)
Imports
|
|
China (1) |
||||
Rest of |
|
|
17.3% |
|||
|
|
|
|
|
||
the world |
|
|
|
|
|
|
38.5% |
|
|
|
|
|
|
|
|
|
|
|
Russia |
|
|
|
|
11.8% |
|||
|
|
|
|
|
United States |
|
|
|
|
10.9% |
|||
Remaining |
|
|
|
|
Japan |
|
|
|
|
|
|||
Turkey |
|
|
||||
G20 countries (2) |
|
|
||||
2.8% |
4.0% |
|||||
14.7% |
||||||
|
|
|
|
|
||
96 |
|
The EU in the world 2013 — a statistical portrait |
|
|
|
|
|
International trade |
|
9 |
|
|
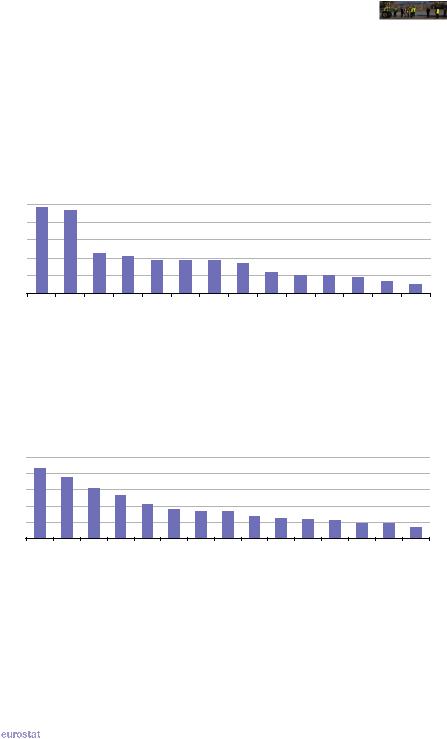
Figures 9.4 and 9.5 show the reverse situation, namely the importance of the EU 27 as a trading partner for the other G20 members in terms of the trade in goods. Nearly half of all goods exported from Russia and Turkey were destined for the EU 27 in 2011, whereas this was the case for less than one tenth of goods exported from Canada, Australia or Mexico. The EU 27 was the source of more than one fifth of all goods imported into Russia, Turkey, South Africa, Saudi Arabia (2010 data) and Brazil, while the EU 27 supplied less than one tenth of all goods imported into Japan, South Korea and Indonesia.
Figure 9.4: Share of EU 27 as destination for all goods exported, 2011(1)
(%) |
|
|
|
|
|
|
|
|
|
|
|
|
|
50 |
|
|
|
|
|
|
|
|
|
|
|
|
|
40 |
|
|
|
|
|
|
|
|
|
|
|
|
|
30 |
|
|
|
|
|
|
|
|
|
|
|
|
|
20 |
|
|
|
|
|
|
|
|
|
|
|
|
|
10 |
|
|
|
|
|
|
|
|
|
|
|
|
|
0 |
|
|
|
|
|
|
|
|
|
|
|
|
|
Russia |
Turkey |
AfricaSouth |
Brazil |
(India2) |
China |
StatesUnited |
Argentina |
Japan |
KoreaSouth |
Indonesia |
Canada |
Australia |
Mexico |
(1) Saudi Arabia, not available. |
|
|
|
|
|
|
|
|
|
|
|
||
(2) 2010. |
|
|
|
|
|
|
|
|
|
|
|
|
|
Source: the United Nations (Comtrade)
Figure 9.5: Share of EU 27 as origin of all goods imported, 2011
(%) |
|
|
|
|
|
|
|
|
|
|
|
|
|
|
50 |
|
|
|
|
|
|
|
|
|
|
|
|
|
|
40 |
|
|
|
|
|
|
|
|
|
|
|
|
|
|
30 |
|
|
|
|
|
|
|
|
|
|
|
|
|
|
20 |
|
|
|
|
|
|
|
|
|
|
|
|
|
|
10 |
|
|
|
|
|
|
|
|
|
|
|
|
|
|
0 |
|
|
|
|
|
|
|
China |
(India1) |
Canada |
Mexico |
|
|
Indonesia |
Russia |
Turkey |
AfricaSouth |
(ArabiaSaudi1) |
Brazil |
Australia |
StatesUnited |
Argentina |
Japan |
KoreaSouth |
|||||
(1) 2010. |
|
|
|
|
|
|
|
|
|
|
|
|
|
|
Source: the United Nations (Comtrade)
|
The EU in the world 2013 — a statistical portrait |
|
97 |
|

|
|
|
9 |
|
International trade |
|
|
The EU 27 is the world’s largest exporter and importer of services with a surplus of EUR 92.4 billion in 2010 and provisional data show that this rose to EUR 109.1 billion in 2011. Although the United States recorded somewhat lower levels of exports and imports of services than the EU 27, its trade surplus for services was higher in 2010, valued at EUR 107.4 billion. Among the other G20 countries, only India and Turkey reported trade surpluses for services, while the largest deficits were registered for Saudi Arabia, Brazil and Russia. Comparing trade flows for 2010 with those for 2000, India, China, Russia and Brazil all reported that exports and imports of services had more than more than doubled (in current price terms).
A relatively high share of the EU 27’s trade in services was with the United States in 2010 and 2011 – although exports and imports were broadly in line with each other – resulting in a relatively small deficit in 2010 and small surplus in 2011. With the other G20 members listed in Table 9.4 (note that data is not available for those G20 members that are not shown) the EU 27 had trade surpluses in services; between 2010 and 2011 the surpluses with Brazil, Canada, China, Japan and Russia increased, while the surplus with India contracted but remained positive.
Table 9.3: Trade in services, 2000, 2005 and 2010
(EUR billion)
|
|
Exports |
|
|
Imports |
|
|
2000 |
2005 |
2010 |
2000 |
2005 |
2010 |
EU-27 (1) |
322.9 |
406.1 |
546.9 |
300.3 |
354.4 |
454.5 |
Argentina |
5.3 |
5.3 |
10.0 |
10.0 |
6.1 |
10.6 |
Australia |
21.5 |
24.9 |
35.9 |
20.5 |
24.5 |
38.7 |
Brazil |
10.3 |
12.9 |
24.0 |
18.0 |
19.6 |
47.2 |
Canada |
43.5 |
44.8 |
52.2 |
47.7 |
52.8 |
68.9 |
China |
32.9 |
59.8 |
129.1 |
39.0 |
67.4 |
145.8 |
India |
17.6 |
32.0 |
93.8 |
15.8 |
26.2 |
62.4 |
Indonesia |
: |
10.4 |
12.6 |
: |
17.7 |
19.7 |
Japan |
74.8 |
88.7 |
106.6 |
126.2 |
107.8 |
118.8 |
Mexico |
14.9 |
13.0 |
11.6 |
18.8 |
17.2 |
19.3 |
Russia |
10.4 |
20.1 |
33.4 |
17.6 |
31.2 |
55.5 |
Saudi Arabia |
5.2 |
9.2 |
8.1 |
27.3 |
26.6 |
57.9 |
South Africa (2) |
5.5 |
9.1 |
8.7 |
6.3 |
9.8 |
11.4 |
South Korea |
34.1 |
40.0 |
62.4 |
36.4 |
48.0 |
70.9 |
Turkey |
22.1 |
21.5 |
26.0 |
9.8 |
9.2 |
14.8 |
United States |
319.5 |
296.0 |
410.5 |
241.4 |
242.2 |
303.1 |
(1) Extra-EU flows.
(2) Data for 2008 instead of 2010.
Source: Eurostat (online data code: bop_its_ybk) and the United Nations (Service Trade)
98 |
|
The EU in the world 2013 — a statistical portrait |
|
|
|
|
|
International trade |
|
9 |
|
|
The analysis of the EU 27’s trading partners shown in Figure 9.6 for services can be compared with a similar analysis for goods (see Figure 9.3). The importance of the United States as a trading partner for the EU 27 for services is notably higher than it was for goods, whereas the reverse was true for China and Russia. Among countries outside of the G20, Switzerland was an important partner for trade in services as it was the destination for 13.0 % of the EU 27’s exports of services and the origin of 11.4 % of the EU 27’s imports of services, in both cases a larger share than Russia, China and Japan combined.
Table 9.4: EU 27 trade in services with selected G20 partner countries, 2010 and 2011
(EUR billion)
|
|
2010 |
|
|
2011 |
|
|
EU-27 |
EU-27 |
|
EU-27 |
EU-27 |
|
|
exports |
imports |
Balance |
exports |
imports |
Balance |
|
to partner |
from partner |
|
to partner |
from partner |
|
Brazil |
10.0 |
5.8 |
4.3 |
11.0 |
6.4 |
4.6 |
Canada |
13.4 |
9.4 |
4.0 |
14.1 |
9.3 |
4.7 |
China |
23.3 |
16.6 |
6.6 |
24.6 |
17.3 |
7.3 |
India |
11.0 |
8.7 |
2.3 |
10.9 |
9.7 |
1.2 |
Japan |
19.7 |
15.1 |
4.6 |
20.4 |
15.3 |
5.1 |
Russia |
23.3 |
13.7 |
9.6 |
25.4 |
13.6 |
11.8 |
United States |
132.3 |
133.2 |
-0.9 |
137.4 |
135.3 |
2.1 |
World (extra-EU-27) |
546.9 |
454.5 |
92.4 |
579.5 |
470.4 |
109.1 |
Source: Eurostat (online data code: bop_its_ybk)
Figure 9.6: Selected G20 trading partners for EU 27 exports and imports of services, 2011
(% share of extra-EU 27 flows)
Exports
|
|
United States |
||
|
|
23.7% |
|
|
|
|
|
|
Russia |
Rest of |
|
|
|
4.4% |
|
|
|
China |
|
the world |
|
|
|
|
|
|
|
4.2% |
|
57.9% |
|
|
|
|
|
|
|
|
|
|
|
Japan |
||
|
|
3.5% |
||
|
|
|
|
Canada |
|
India |
Brazil |
2.4% |
|
|
|
|||
|
1.9% |
|
|
|
|
1.9% |
|
|
|
|
|
|
|
|
Source: Eurostat (online data code: bop_its_ybk)
Imports
Rest of the world 56.0%
United States
28.8%
China
3.7%
Japan
3.3%
Russia
India 2.9%
2.1%
Brazil Canada 1.4% 2.0%
|
The EU in the world 2013 — a statistical portrait |
|
99 |
|