
Living conditions and social protection
The data on living conditions and social protection shown in this publication aims to provide a picture of the social situation covering indicators related to income, expenditure, poverty and social protection. The distribution of income is often used to measure inequalities in society. On the one hand, differences in income may provide an incentive to individuals to improve their situation (for example, through looking for a new job or acquiring new skills). On the other, crime, poverty and social exclusion are often linked to income inequalities.
Main findings
The growth of cities and urban agglomerations results essentially from migration from rural areas and can be related, among other factors, to industrialisation. In developing economies urban areas may be seen as offering stable employment compared with traditional agricultural practices. Urban and rural areas may offer different opportunities for people, for example, in terms of social mobility and ease of access to diverse economic activities (and related job opportunities), educational possibilities, transport and communication networks, accommodation, as well as leisure and recreational activities. Alongside issues of proximity and choice in terms of the consumption of goods and services, urban and rural areas may also be contrasted in relation to a range of other issues, for example, in terms of living costs, congestion, pollution, crime and poverty.
In recent years Eurostat, with other services of the European Commission, has worked on the development of various territorial typologies based on population size and density. Traditionally, territorial typologies have been based on the classification of administrative units (such as municipalities) according to their population density; this could lead to villages in units with a very small area being classified as urban, whereas large towns in very large administrative units could potentially be considered as rural. A new typology has been introduced that is based on a grid of 1 km² cells which are individually classified according to population size and population density; these standard grids are grouped into clusters which in turn are used to classify administrative units or regions into their degree of urbanisation or into an urban-rural typology. Based on this approach, data for 2006 indicate that 40 % of the EU 27 population lived in predominantly urban regions, 36 % in intermediate regions, and 24 % in predominantly rural regions.
|
The EU in the world 2013 — a statistical portrait |
|
67 |
|
|
|
|
6 |
|
Living conditions and social protection |
|
|
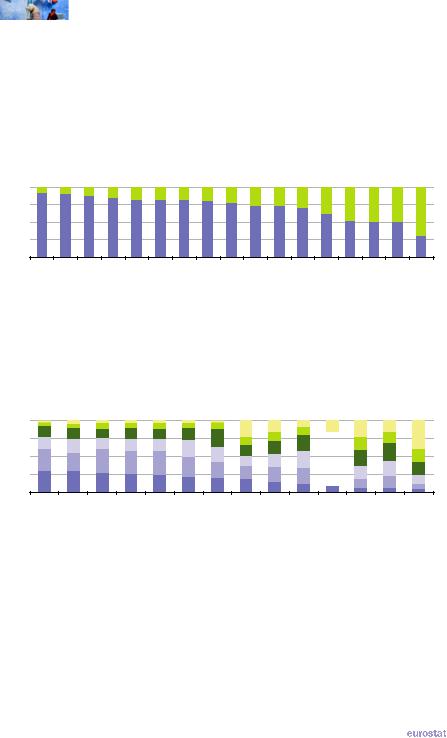
According to the World Urbanisation Prospects report of the United Nations, globally just over half (52.1 %) of the world’s population lived in urban areas in 2011 and the remainder in rural areas – see Figure 6.1. More than two thirds of the Indian population lived in rural areas in 2011, while in China and Indonesia the urban and rural populations were almost equal in size. In all other G20 members more than half or the population lived in urban areas, ranging from 62.0 % in South Africa, through 73.9 % in the EU 27 to 92.5 % in Argentina.
Figure 6.1: Share of the population living in rural and urban areas, 2011
(% of total)
100% |
75% |
50% |
25% |
0% |
Argentina |
Japan |
Australia |
Brazil |
SouthKorea |
UnitedStates |
SaudiArabia |
Canada |
Mexico |
EU-27 |
Russia |
Turkey |
SouthAfrica |
World |
Indonesia |
China |
India |
||
|
|
|
|
|
|
|
|
|
|
Rural |
|
|
|
|
|
|
|
|
|
|
|
|
|
|
|
|
|
|
|
|
|
|
|
|
|
|
|
|
|
|
|
|
|
|
|
|
|
|
|
|
|
|
|
|
|
|
 Urban
Urban
Source: United Nations Department of Economic and Social Affairs (World Urbanisation Prospects: the 2011 Revision)
Figure 6.2: Analysis of the total number of households by the number of household members, 2010 (1)
(% of total)
100% |
|
|
|
|
|
|
|
|
|
|
|
|
|
75% |
|
|
|
|
|
|
|
|
|
|
|
|
|
50% |
|
|
|
|
|
|
|
|
|
|
|
|
|
25% |
|
|
|
|
|
|
|
|
|
|
|
|
|
0% |
Japan (2) |
(StatesUnited3) |
Canada (4) |
Australia (5) |
Russia (6) |
KoreaSouth (2) |
AfricaSouth (4) |
Argentina (4) |
|
Indonesia (7) |
Mexico (8) |
Turkey (5) |
India (4) |
EU-27 |
Brazil |
|
1 person |
|
2 persons |
|
3 persons |
|
|
|
|||
|
|
|
|||
|
4 persons |
|
5 persons |
|
6 persons or more |
|
|
|
|||
|
|
|
(1) China and Saudi Arabia, not available. (2) 2005.
(3) 2009. (4) 2001. (5) 2006. (6) 2002.
(7) Two persons includes three persons; four persons includes five persons. (8) 2000.
Source: Eurostat (online data code: ilc_lvph03), the United Nations Department of Economic and Social Affairs (Demographic statistics) and national surveys
68 |
|
The EU in the world 2013 — a statistical portrait |
|
|
|
|
|
Living conditions and social protection |
|
6 |
|
|
Many statistical analyses of social and living conditions focus on households, in other words a person or group of persons living together (but separate from others), regardless of whether they are family members or not. Many factors influence household formation, for example, marriage, divorce, fertility and life expectancy, as well as geographical mobility, and economic and cultural factors. Figure 6.2 shows that more than half of all households in the EU 27, Japan, the United States, Canada and Australia were one and two person households, whereas the majority of households in India, Turkey, Mexico and Indonesia had four or more persons.
Table 6.1: Household consumption expenditure, 2009
(% of total household consumption expenditure)
|
Food & non-alcoholic beverages |
Alcoholic beverages, tobacco |
Clothing & footwear |
Housing, water, elec., gas & other fuels |
Furnishings, household equipment etc. |
Health |
Transport |
|
Communications |
Recreation & culture |
Education |
Restaurants & hotels |
Miscellaneous goods & services |
|
|
|
|
|
|
|
|
|
|
|
|
|
|
EU-27 (1) |
16.8 |
2.4 |
5.7 |
27.7 |
5.5 |
3.4 |
11.9 |
|
3.3 |
8.4 |
1.0 |
5.3 |
8.7 |
Argentina (2) |
33.4 |
8.3 |
10.8 |
7.2 |
7.6 |
15.2 |
|
8.2 |
3.1 |
: |
6.1 |
||
Australia (3) |
10.7 |
3.6 |
3.2 |
20.5 |
5.2 |
5.4 |
10.9 |
|
2.7 |
11.1 |
3.4 |
6.9 |
16.3 |
Brazil |
20.3 |
5.5 |
35.9 |
7.2 |
19.6 |
|
: |
2.0 |
3.0 |
: |
6.4 |
||
Canada (4) |
9.8 |
4.2 |
5.1 |
23.6 |
6.8 |
4.3 |
14.5 |
|
2.3 |
10.6 |
1.4 |
7.3 |
10.1 |
China (5) |
36.5 |
10.5 |
10.0 |
6.4 |
7.0 |
13.7 |
|
|
12.0 |
|
3.9 |
||
India |
30.6 |
3.1 |
6.5 |
14.8 |
4.1 |
4.1 |
15.0 |
|
2.0 |
1.4 |
1.6 |
2.5 |
14.4 |
Indonesia |
50.6 |
3.3 |
19.9 |
5.9 |
|
|
|
|
20.3 |
|
|
|
|
Japan (6) |
14.4 |
3.1 |
4.7 |
26.9 |
4.0 |
4.0 |
10.6 |
|
2.7 |
9.6 |
2.3 |
7.4 |
10.4 |
Mexico (4) |
27.1 |
2.8 |
3.4 |
14.9 |
8.8 |
5.2 |
19.0 |
|
2.0 |
3.2 |
4.3 |
8.0 |
12.4 |
Russia |
30.5 |
8.4 |
9.6 |
10.0 |
5.1 |
3.7 |
11.8 |
|
5.3 |
5.0 |
1.3 |
3.6 |
5.6 |
Saudi Arabia (7) |
17.4 |
0.4 |
6.7 |
17.0 |
7.3 |
2.1 |
8.3 |
|
6.5 |
2.9 |
2.4 |
4.7 |
24.5 |
South Africa (7) |
19.3 |
1.1 |
4.7 |
22.2 |
6.5 |
1.6 |
18.8 |
|
3.3 |
4.3 |
2.3 |
2.1 |
13.6 |
South Korea (8) |
14.0 |
2.2 |
4.1 |
17.2 |
4.3 |
7.7 |
11.8 |
|
4.8 |
8.5 |
4.8 |
7.1 |
13.6 |
Turkey |
23.0 |
4.1 |
5.1 |
28.2 |
6.2 |
1.9 |
13.6 |
|
4.2 |
2.6 |
1.9 |
5.2 |
4.1 |
United States |
6.8 |
2.1 |
3.5 |
19.5 |
4.3 |
20.2 |
9.1 |
|
2.4 |
9.3 |
2.3 |
6.2 |
14.3 |
(1) 2005. (2) 2004/2005; restaurants are included within food and beverages; hotels are included within recreation and culture.
(3) Restaurants are included within food and beverages; hotels are included within recreation and culture; communications are included within miscellaneous goods and services. (3) 2008. (4) 2004. (5) Urban households only. (6) 2003. (7) 2006. (8) 2002.
Source: Eurostat (online data code: hbs_str_t211), the United Nations Statistics Division (Economic Statistics Branch) and national household surveys
Table 6.1 provides an analysis of the distribution of household consumption expenditure for various purposes. Factors such as culture, income, weather, household composition, economic structure and degree of urbanisation can all influence expenditure patterns. In most G20 members the highest proportion of expenditure was normally devoted to food and nonalcoholic beverages or housing (including also expenditure for water and fuels). A notable exception to this general pattern was the United States where household expenditure on health had the highest share. The share of expenditure on food and non-alcoholic beverages was particularly low in the United States, as it was in Canada and Australia.
|
The EU in the world 2013 — a statistical portrait |
|
69 |
|
|
|
|
6 |
|
Living conditions and social protection |
|
|
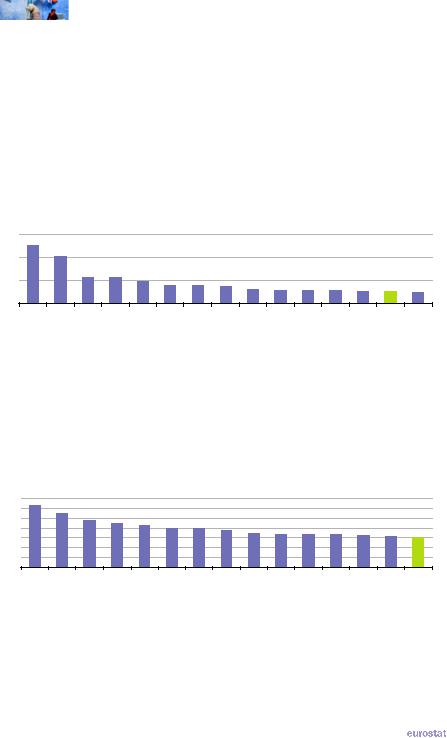
Income generally has a major impact on an individual’s living conditions. Figures 6.3 and 6.4 present two commonly used measures for studying income distribution: the income quintile share ratio is calculated as the ratio of the proportion of income received by the 20 % of the population with the highest income (the top quintile) compared with the proportion received by the 20 % of the population with the lowest income; the Gini coefficient measures dispersion (on a range from zero for perfect equality to 1 for maximal inequality) and for income gives a summary measure of income dispersion across all income levels, not just the extremes of the highest and lowest incomes. South Africa, Brazil, Mexico, Argentina and China had the highest income inequality among G20 members according to both of these measures, whereas the EU-27 was among the members with the lowest income inequality.
Figure 6.3: Income quintile share ratio, 2010(1)
(ratio) |
|
|
|
|
|
|
|
|
|
|
|
|
|
|
30 |
|
|
|
|
|
|
|
|
|
|
|
|
|
|
20 |
|
|
|
|
|
|
|
|
|
|
|
|
|
|
10 |
|
|
|
|
|
|
|
|
|
|
|
|
|
|
0 |
|
|
|
|
|
|
|
|
|
|
|
|
|
|
(AfricaSouth2) |
Brazil (2) |
Mexico (3) |
Argentina |
China (4) |
Turkey (3) |
(StatesUnited3) |
Russia (2) |
Japan (5) |
Australia (3) |
(KoreaSouth3) |
Canada (3) |
Indonesia (4) |
EU-27 |
India (4) |
(1) The indicator shows the ratio of the proportion of total national income that is earned by the top 20 % of income earners compared with the proportion of total national income that is earned by the bottom 20 % of income earners; Saudi Arabia, not available.
(2) 2009. (3) 2008. (4) 2005. (5) 2007.
Source: Eurostat (online data code: ilc_di11), the World Bank (Poverty and Inequality Database) and the OECD (Income Distribution and Poverty)
Figure 6.4: Gini coefficient for income distribution, 2010 (1)
(ratio) |
|
|
|
|
|
|
|
|
|
|
|
|
|
|
0.7 |
|
|
|
|
|
|
|
|
|
|
|
|
|
|
0.6 |
|
|
|
|
|
|
|
|
|
|
|
|
|
|
0.5 |
|
|
|
|
|
|
|
|
|
|
|
|
|
|
0.4 |
|
|
|
|
|
|
|
|
|
|
|
|
|
|
0.3 |
|
|
|
|
|
|
|
|
|
|
|
|
|
|
0.2 |
|
|
|
|
|
|
|
|
|
|
|
|
|
|
0.1 |
|
|
|
|
|
|
|
|
|
|
|
|
|
|
0.0 |
|
|
|
|
|
|
|
|
|
|
|
|
|
|
South Africa (2) |
Brazil (2) |
Mexico (3) |
Argentina |
China (4) |
Russia (2) |
Turkey (3) |
(StatesUnited3) |
Indonesia (4) |
Australia (3) |
India (4) |
Japan (5) |
Canada (3) |
KoreaSouth (3) |
EU-27 |
(1) This indicator measures inequality; a Gini coefficient of zero (perfect equality) would mean that everyone has the same income; a Gini coefficient of one (maximum inequality) would mean that only one person has all the income; Saudi Arabia, not available.
(2) 2009. (3) 2008. (4) 2005. (5) 2007.
Source: Eurostat (online data code: ilc_di11), the World Bank (Poverty and Inequality Database) and the OECD (Income Distribution and Poverty)
70 |
|
The EU in the world 2013 — a statistical portrait |
|
|
|
|
|
Living conditions and social protection |
|
6 |
|
|
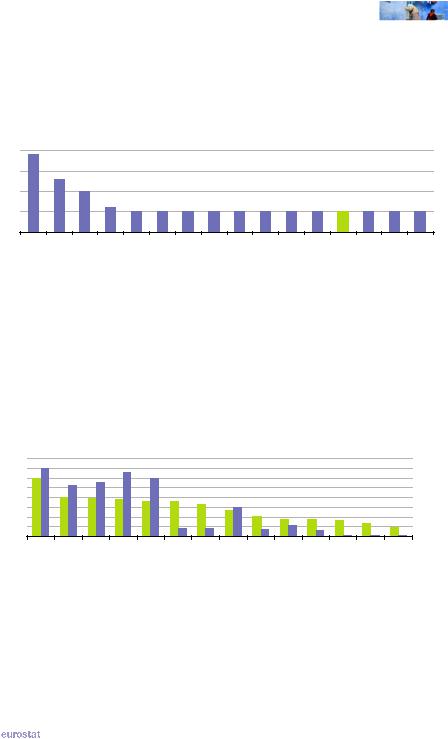
Figure 6.5 presents a non-monetary indicator for an analysis of the effects of poverty, in this case under-nourishment. For most G20 members the proportion of the population suffering from under-nourishment was around 5 %, with substantially higher proportions in India, Indonesia and China.
Figure 6.5: Prevalence of undernourishment, 2008(1)
(% of the population)
20 |
15 |
10 |
5 |
0 |
India |
Indonesia |
China |
Brazil |
UnitedStates |
Turkey |
SouthKorea |
South Africa |
Saudi Arabia |
Russia |
Mexico |
Japan |
EU-27 |
Canada |
Australia |
Argentina |
(1) The indicator shows the proportion of the population whose food intake is insufficient to meet dietary energy requirements (undernourishment).
Source: the World Bank (Millennium Development Goals)
Social protection encompasses all interventions from public or private bodies intended to relieve households and individuals from the burden of a defined set of risks or needs. Figure 6.6 shows the level of social protection expenditure in the G20 members relative to GDP and relative to the size of the population; the per capita measure is presented in euro converted at market exchange rates and so does not reflect price level differences in the G20 members.
Figure 6.6: Expenditure on social protection, 2009(1)
40 |
|
|
|
|
|
|
|
|
|
|
|
|
8 000 |
35 |
|
|
|
|
|
|
|
|
|
|
|
|
7 000 |
30 |
|
|
|
|
|
|
|
|
|
|
|
|
6 000 |
25 |
|
|
|
|
|
|
|
|
|
|
|
|
5 000 |
20 |
|
|
|
|
|
|
|
|
|
|
|
|
4 000 |
15 |
|
|
|
|
|
|
|
|
|
|
|
|
3 000 |
10 |
|
|
|
|
|
|
|
|
|
|
|
|
2 000 |
5 |
|
|
|
|
|
|
|
|
|
|
|
|
1 000 |
0 |
|
|
|
|
|
|
|
|
|
|
|
|
0 |
EU-27 |
Japan (2) |
Canada |
(StatesUnited3) |
Australia |
Argentina (3) |
Brazil (3) |
Russia (2) |
Turkey |
KoreaSouth |
Mexico (3) |
AfricaSouth |
China (3) |
India |
|
(% of GDP) |
|
(EUR per capita) |
|
|
||
|
|
(1) Percentage of GDP: left-hand axis; EUR per capita: right-hand axis; Indonesia and Saudi Arabia, not available. (2) 2008.
(3) 2007.
Source: Eurostat (online data code: spr_exp_sum), the OECD (Social Expenditure Database) and the International Labour Organisation (Social Security Department)
|
The EU in the world 2013 — a statistical portrait |
|
71 |
|