Environment
Dramatic events around the world frequently propel environmental issues into the mainstream news, from wide scale floods or forest fires to other extreme weather patterns. The world is confronted by many environmental challenges, for example tackling climate change, preserving nature and biodiversity, or promoting the sustainable use of natural resources. The inter-relationship between an economy and the environment is a factor for many of these challenges and underlies the interest in sustainable growth and development, with positive social and environmental outcomes.
Main findings
Data relating to greenhouse gas emissions are collected under the UN’s Framework Convention on Climate Change (UNFCCC). The Kyoto Protocol is an international agreement linked to the UNFCCC: it was adopted in 1997 and entered into force in 2005. A total of 191 signatories subsequently ratified the Protocol; the United States did not ratify it and Canada subsequently announced its withdrawal. Under the Protocol a list of industrialised and transition economies
– referred to as Annex I parties – committed to targets for the reduction of six greenhouse gases or groups of gases; these gases are listed in Table 11.2. The G20 members that are Annex I parties are listed separately in Figure 11.1 and Tables 11.1 and 11.2. The EU is an Annex I party and was composed of 15 Member States at the time of adoption of the Protocol under which the EU agreed to reduce greenhouse gas emissions by 8 % during the period 2008-2012 when compared with their 1990 levels. The EU 27 has subsequently committed to a 20 % reduction in greenhouse gas emissions by 2020.
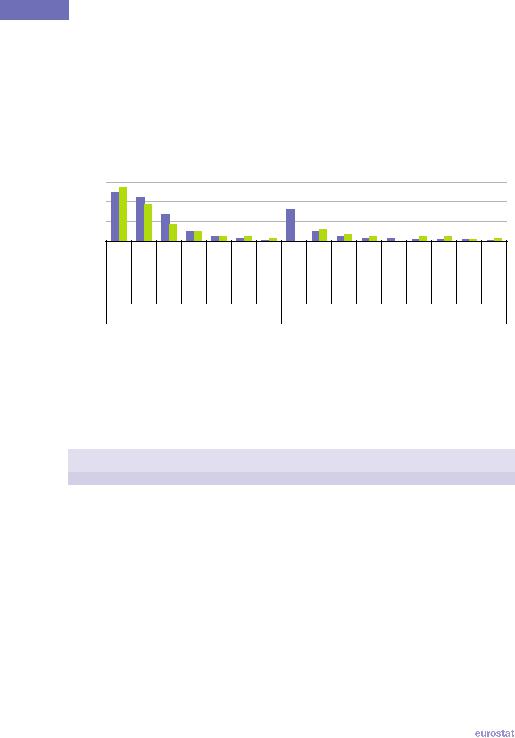
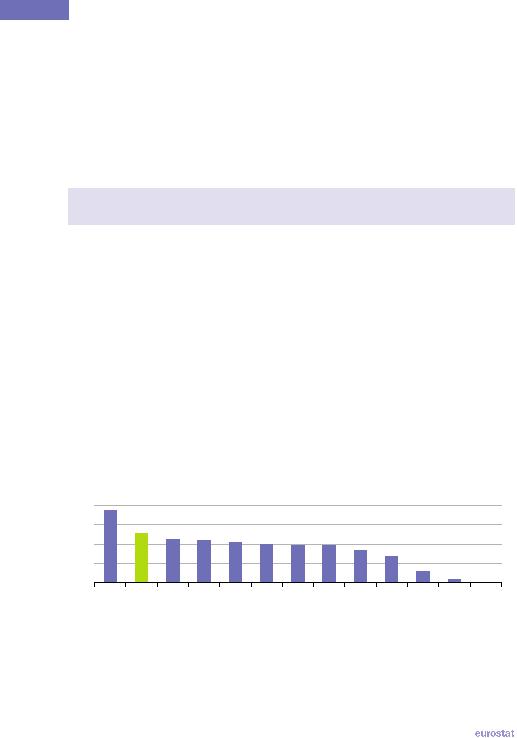
Total greenhouse gas emissions by Annex I parties in 2010 were 17 305 million tonnes of carbon dioxide equivalents, 8.9 % lower than the level in the base year (1990 for most parties). Between 1990 and 2010 Russia’s emissions fell more than 30 %, while the emissions of the EU 27 fell by 15 %. Turkey’s emissions more than doubled, while increased emissions were also recorded for Australia (30 %), Canada (17 %) and the United States (10 %). Among the other G20 members (that are not Annex I parties), China had the most substantial level of greenhouse gas emissions – note the latest data for China is from 1994 and it is likely that Chinese greenhouse gas emissions have grown substantially since then.
|
The EU in the world 2013 — a statistical portrait |
|
109 |
|
11  Environment
Tables 11.1 and 11.2 provide an analysis of the source of greenhouse gas emissions and an analysis by type of gas – note that the data for the G20 members that are not Annex I parties relates to relatively distant reference years. While energy accounted for at least 70 % of all greenhouse gas emissions in the G20 members that are Annex I parties this is not the case for some other G20 members where agriculture and waste often made large contributions to the level of greenhouse gas emissions.
Figure 11.1: Greenhouse gas emissions, 1990 and 2010(1)
(million tonnes of CO2-equivalents)
7 500 |
|
|
|
|
|
|
|
|
|
|
|
|
|
|
|
5 000 |
|
|
|
|
|
|
|
|
|
|
|
|
|
|
|
2 500 |
|
|
|
|
|
|
|
|
|
|
|
|
|
|
|
0 |
EU-27 |
|
|
|
|
|
|
|
|
|
|
|
|
|
|
StatesUnited |
Russia |
Japan |
Canada |
Australia |
Turkey |
China (2) |
India (3) |
Brazil (4) |
Mexico (5) |
(AfricaSouth6) |
(KoreaSouth7) |
Indonesia (8) |
Argentina (8) |
(ArabiaSaudi8) |
Annex I parties |
|
Other G20 members |
||
|
|
1990 |
|
2010 |
|
|
|||
|
|
|||
(1) Without land use, land use change and forestry. (2) Data for 1994 instead of 1990; 2010, not available. (3) Data for 1994 instead of 1990; data for 2000 instead of 2010. (4) Data for 2005 instead of 2010. (5) Data for 2006 instead of 2010. (6) 2010, not available. (7) Data for 2001 instead of 2010. (8) Data for 2000 instead of 2010.
Source: Eurostat (online data code: env_air_gge) and the United Nations Framework Convention on Climate Change (UNFCCC)
Table 11.1: Greenhouse gas emissions, analysis by sector, 2010 (1)
(million tonnes of CO2-equivalents)
|
Total (2) |
Energy |
Agriculture |
Industrial |
Waste |
Solvents |
|
processes |
|||||
|
|
|
|
|
|
|
EU-27 |
4 720.9 |
3 763.0 |
461.6 |
343.1 |
141.5 |
11.6 |
G20 members that are Annex I parties to the Kyoto Protocol |
|
|
|
|||
Australia |
542.7 |
417.4 |
79.5 |
31.7 |
14.1 |
: |
Canada |
691.7 |
561.7 |
55.5 |
51.8 |
22.5 |
0.2 |
Japan |
1 258.0 |
1 145.6 |
25.5 |
65.9 |
20.9 |
0.1 |
Russia |
2 201.9 |
1 819.0 |
136.8 |
172.8 |
72.7 |
0.6 |
Turkey |
401.9 |
285.1 |
27.1 |
53.9 |
35.8 |
: |
United States |
6 802.2 |
5 933.5 |
428.4 |
303.4 |
132.5 |
4.4 |
Other G20 members |
|
|
|
|
|
|
Argentina (3) |
282.0 |
132.0 |
124.9 |
11.1 |
14.0 |
: |
Brazil (4) |
862.8 |
328.8 |
415.8 |
77.2 |
41.1 |
: |
China (5) |
4 057.6 |
3 007.8 |
605.1 |
282.6 |
162.1 |
: |
India (3) |
1 523.8 |
1 027.0 |
355.6 |
88.6 |
52.6 |
: |
Indonesia (3) |
554.3 |
280.9 |
73.4 |
42.7 |
157.3 |
: |
Mexico (6) |
641.4 |
430.1 |
45.6 |
63.5 |
102.3 |
: |
Saudi Arabia (3) |
296.1 |
245.3 |
12.3 |
19.4 |
19.1 |
: |
South Africa (5) |
379.8 |
297.6 |
35.5 |
30.4 |
16.4 |
: |
South Korea (7) |
542.9 |
453.2 |
16.1 |
57.8 |
15.8 |
: |
(1) Without land use, land use change and forestry. (2) Sum of available sectors. (3) 2000. (4) 2005. (5) 1994. (6) 2006. (7) 2001.
Source: the United Nations Framework Convention on Climate Change (UNFCCC)
110 |
|
The EU in the world 2013 — a statistical portrait |
|
|
Environment  11
11
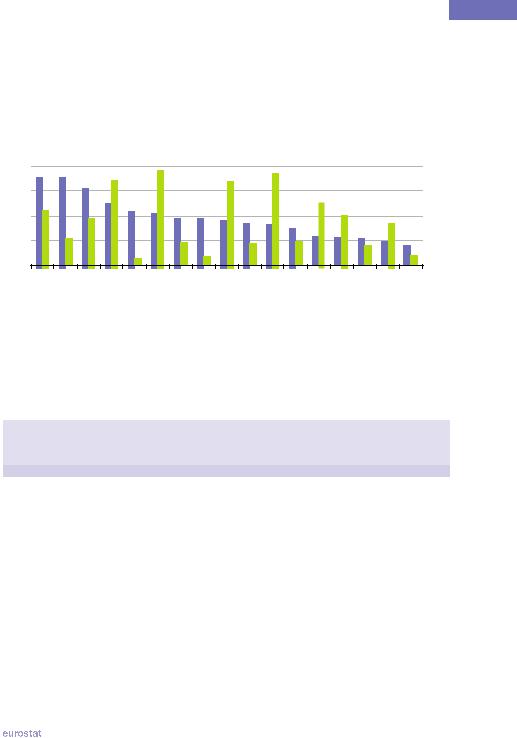
The analysis by type of gas reflects, to some extent, the analysis by sector, for example – high shares of methane emissions can be seen in G20 members where a large proportion of emissions were from agriculture and/or waste. As well as resulting from human activities, nitrous oxide emissions can be produced naturally, for example in wet tropical forests, which may in part explain the high share of this gas in total greenhouse gas emissions in Brazil and Indonesia.
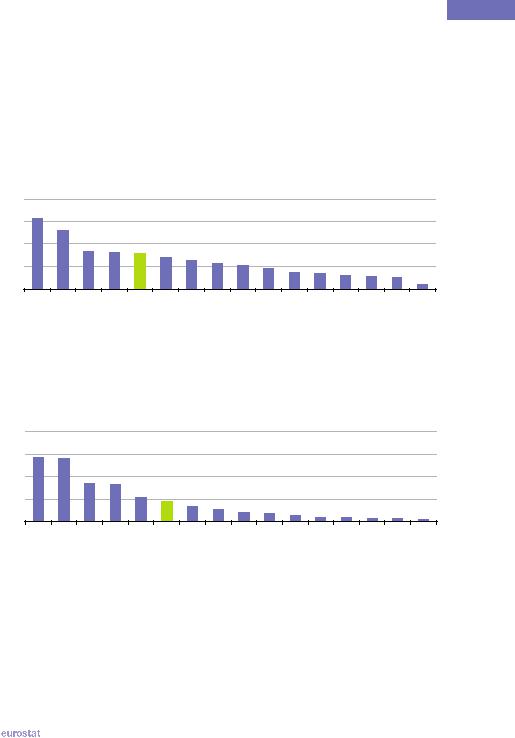
Figure 11.2: Quantity of carbon dioxide emissions, 2008(1)
1.00 |
|
|
|
|
|
|
|
|
|
|
|
|
|
|
|
20 |
0.75 |
|
|
|
|
|
|
|
|
|
|
|
|
|
|
|
15 |
0.50 |
|
|
|
|
|
|
|
|
|
|
|
|
|
|
|
10 |
0.25 |
|
|
|
|
|
|
|
|
|
|
|
|
|
|
|
5 |
0.00 |
|
|
|
India |
|
|
|
|
|
|
|
|
|
|
|
0 |
KoreaSouth |
China |
AfricaSouth |
ArabiaSaudi |
Australia |
World |
Indonesia |
Canada |
Mexico |
StatesUnited |
Argentina |
Russia |
Japan |
Turkey |
EU-27 |
Brazil |
|
Relative to GDP (kg per USD, international PPP) |
|
Per inhabitant (tonnes) |
|
|
||
|
|
(1) Quantity relative to GDP: left-hand axis; quantity per inhabitant: right-hand axis.
Source: the World Bank (World Development Indicators and Global Development Finance) based on the United Nations Framework Convention on Climate Change (UNFCCC)
Table 11.2: Greenhouse gas emissions, analysis by gas, 2010 (1)
(million tonnes of CO2-equivalents)
|
|
Carbon |
|
Nitrous |
Hydro- |
Per-fluoro- |
Sulphur |
|
|
Methane |
fluoro- |
hexa- |
|||
|
Total |
dioxide |
oxide |
carbons |
|||
|
(CH4) |
carbons |
fluoride |
||||
|
|
(CO2) |
(N2O) |
(PFCs) |
|||
|
|
|
(HFCs) |
(SF6) |
|||
|
|
|
|
|
|
||
EU-27 |
4 720.9 |
3 891.3 |
400.7 |
334.5 |
84.5 |
3.4 |
6.5 |
G20 members that are Annex I parties to the Kyoto Protocol |
|
|
|
|
|||
Australia |
542.7 |
401.8 |
110.6 |
23.3 |
6.7 |
0.2 |
0.1 |
Canada |
691.7 |
544.9 |
90.6 |
47.1 |
7.1 |
1.6 |
0.5 |
Japan |
1 258.0 |
1 191.9 |
20.4 |
22.1 |
18.3 |
3.4 |
1.9 |
Russia |
2 201.9 |
1 593.2 |
485.4 |
109.0 |
10.9 |
2.7 |
0.7 |
Turkey |
401.9 |
326.5 |
57.5 |
13.0 |
4.0 |
0.0 |
0.9 |
United States |
6 802.2 |
5 697.3 |
661.7 |
300.5 |
123.0 |
5.7 |
14.0 |
Other G20 members (2) |
|
|
|
|
|
|
|
Argentina |
: |
192.4 |
101.8 |
49.8 |
0.3 |
0.1 |
0.3 |
Brazil |
: |
393.2 |
492.2 |
236.0 |
5.0 |
5.6 |
1.2 |
China |
: |
7 031.9 |
1 333.1 |
467.2 |
100.3 |
10.6 |
30.5 |
India |
: |
1 742.7 |
584.0 |
212.9 |
2.8 |
1.1 |
4.6 |
Indonesia |
: |
406.0 |
208.9 |
123.3 |
0.0 |
0.1 |
0.9 |
Mexico |
: |
475.8 |
128.2 |
42.5 |
4.1 |
0.0 |
0.4 |
Saudi Arabia |
: |
433.6 |
48.2 |
6.5 |
0.2 |
0.0 |
2.0 |
South Africa |
: |
435.9 |
63.8 |
24.0 |
0.5 |
0.5 |
1.5 |
South Korea |
: |
509.2 |
32.1 |
13.5 |
3.2 |
2.5 |
4.6 |
(1) Without land use, land use change and forestry. (2) 2005, except for carbon dioxide (2008).
Source: the United Nations Framework Convention on Climate Change (UNFCCC)
|
The EU in the world 2013 — a statistical portrait |
|
111 |
|

11  Environment
Figure 11.2 provides an analysis of emission intensities of this gas for 2008. Carbon dioxide emission intensities varied considerably between G20 members reflecting, among others, the structure of each economy (for example, the relative importance of heavy, traditional industries), the national energy mix (the share of low or zero-carbon technologies compared with the share of fossil fuels), heating and cooling needs and practices, and the propensity for motor vehicle use.
The Gothenburg Protocol is one of several concluded under the United Nations Economic Commission for Europe Convention on Long Range Transboundary Air Pollution (CLRTAP); it aims to control transboundary air pollution and associated health and environmental impacts, notably acidification, eutrophication and ozone pollution. In the G20 members there was a massive reduction in the consumption of ozone depleting substances between 2000 and 2010 and also a large reduction in particulate matter (PM10: particles defined as having aerodynamic diameter of 10 µm or less) between 2000 and 2009 (see Table 11.3).
Table 11.3: Air pollution
|
Consumption of |
|
|
|
Nitrogen |
Sulphur |
||||
|
ozone depleting |
|
PM10 |
|||||||
|
|
oxides |
dioxide |
|||||||
|
substances |
(micrograms per m³) |
||||||||
|
(NOx) (2) |
|
(SO2) |
|||||||
|
(ODS tonnes) (1) |
|
|
|
|
|||||
|
2000 |
2010 |
2000 |
|
2009 |
Latest |
(1 000 |
Latest |
|
(1 000 |
|
|
year |
tonnes) |
year |
|
tonnes) |
||||
|
|
|
|
|
|
|
||||
EU-27 (3) |
10 899 |
-1 760 |
26.6 |
|
18.9 |
2010 |
9 162 |
2010 |
|
4 574 |
Argentina |
3 383 |
781 |
68.1 |
|
60.0 |
2000 |
676 |
2000 |
|
88 |
Australia |
485 |
-6 |
17.8 |
|
13.9 |
2007 |
2 651 |
2008 |
|
2 642 |
Brazil |
11 379 |
1 204 |
31.6 |
|
19.5 |
1994 |
2 301 |
|
|
: |
Canada |
953 |
65 |
21.4 |
|
15.6 |
2002 |
43 |
|
|
: |
China |
90 878 |
21 388 |
87.9 |
|
60.2 |
|
: |
|
|
: |
India |
18 696 |
1 934 |
91.6 |
|
57.1 |
|
: |
|
|
: |
Indonesia |
5 451 |
433 |
119.8 |
|
68.1 |
1994 |
928 |
|
|
: |
Japan |
5 989 |
622 |
32.9 |
|
24.9 |
2007 |
1 874 |
2008 |
|
783 |
Mexico |
6 056 |
1 599 |
43.5 |
|
32.6 |
2002 |
1 444 |
2002 |
|
2 613 |
Russia |
25 744 |
1 042 |
27.4 |
|
15.6 |
2007 |
5 069 |
2008 |
|
625 |
Saudi Arabia |
1 943 |
1 611 |
148.2 |
|
102.8 |
|
: |
|
|
: |
South Africa |
815 |
393 |
30.3 |
|
26.4 |
|
: |
|
|
: |
South Korea |
13 746 |
2 114 |
45.3 |
|
32.5 |
1990 |
851 |
1990 |
|
4 170 |
Turkey |
1 592 |
606 |
53.0 |
|
36.7 |
2007 |
1 289 |
2008 |
|
1 072 |
United States |
3 972 |
2 330 |
23.8 |
|
18.0 |
2007 |
13 941 |
2008 |
|
10 368 |
(1) Negative values indicate exports plus destruction exceeded actual production plus imports. (2) Nitric oxide / nitrogen monoxide (NO) and nitrogen dioxide (NO2).
(3) For ozone depleting substances: the European Union reports aggregated consumption data for the region and on behalf of the Member States; for sulphur dioxide: data relate to all sulphur oxides instead.
Source: Eurostat (online data codes: env_air_emis and tsdpc270), the United Nations Framework Convention on Climate Change (UNFCCC), the United Nations Environment Programme (Ozone Secretariat), the United Nations Statistics Division (Millennium Development Goals Database) and the World Bank (World Development Indicators and Global Development Finance)
G20 members accounted for approximately two thirds of all freshwater withdrawals worldwide; India, China, the United States and the EU 27 together accounted for more than half. Relative to population size the United States and Canada had the highest annual water withdrawals (see Figure 11.3), at more than double the world average of 573 m³ per inhabitant which, in turn, was above the EU 27 average. Freshwater was principally used for industrial purposes
112 |
|
The EU in the world 2013 — a statistical portrait |
|
|
Environment  11
11
in Canada, Russia, the EU 27 and the United States and for agricultural purposes in the other G20 members. The share of domestic use in total freshwater withdrawals ranged from 7.4 % in India to 28.0 % in Brazil.
Table 11.4: Water
|
|
Annual freshwater |
|
|
Population connected |
|
||||
|
|
withdrawals, 2009 |
|
|
to wastewater system |
|
||||
|
(1 000 |
Agri- |
|
Indus- |
|
Domes- |
Collection |
Treatment |
||
|
culture |
|
try |
|
tic |
|||||
|
million |
|
|
|
|
|
|
|||
|
m³) |
Share of annual freshwater |
Latest year |
(%) |
Latest year |
(%) |
||||
|
|
withdrawals (%) |
|
|||||||
|
|
|
|
|
|
|
|
|||
EU-27 (1) |
236.9 |
27.1 |
|
52.8 |
|
20.1 |
2007 |
77.7 |
2007 |
73.1 |
Argentina |
32.6 |
66.1 |
|
12.2 |
|
21.7 |
2001 |
42.5 |
2001 |
42.5 |
Australia |
22.6 |
73.8 |
|
10.6 |
|
15.6 |
2004 |
87.0 |
|
: |
Brazil |
58.1 |
54.6 |
|
17.5 |
|
28.0 |
2008 |
50.2 |
2006 |
26.0 |
Canada |
46.0 |
11.8 |
|
68.7 |
|
19.6 |
1999 |
74.3 |
1999 |
71.7 |
China |
554.1 |
64.6 |
|
23.2 |
|
12.2 |
2004 |
45.7 |
2004 |
32.5 |
India |
761.0 |
90.4 |
|
2.2 |
|
7.4 |
|
: |
|
: |
Indonesia |
113.3 |
81.9 |
|
6.5 |
|
11.6 |
|
: |
|
: |
Japan |
90.0 |
63.1 |
|
17.6 |
|
19.3 |
2003 |
67.0 |
2003 |
67.0 |
Mexico |
79.8 |
76.7 |
|
9.3 |
|
14.0 |
2005 |
67.6 |
2005 |
35.0 |
Russia |
66.2 |
19.9 |
|
59.8 |
|
20.2 |
|
: |
|
: |
Saudi Arabia |
23.7 |
88.0 |
|
3.0 |
|
9.0 |
|
: |
|
: |
South Africa |
12.5 |
62.7 |
|
6.0 |
|
31.2 |
2007 |
60.0 |
2007 |
57.0 |
South Korea |
25.5 |
62.0 |
|
12.0 |
|
26.0 |
2003 |
78.8 |
2003 |
78.8 |
Turkey |
40.1 |
73.8 |
|
10.7 |
|
15.5 |
2008 |
73.0 |
2008 |
46.0 |
United States |
478.4 |
40.2 |
|
46.1 |
|
13.7 |
1996 |
71.4 |
|
: |
World |
3 908.3 |
70.2 |
|
18.1 |
|
11.7 |
|
: |
|
: |
(1) Population connected to urban wastewater system; estimates made for the purpose of this publication based on latest available data (excluding Denmark and the United Kingdom for both collection and treatment, excluding Italy for collection and excluding Spain for treatment).
Source: Eurostat (online data code: env_watq4), the United Nations Environment Programme (Water Section) and the World Bank (World Development Indicators and Global Development Finance)
Figure 11.3: Freshwater withdrawals, 2009
(m³ per inhabitant)
1 600 |
1 200 |
800 |
400 |
0 |
UnitedStates |
Canada |
Australia |
Saudi Arabia |
Argentina |
Mexico |
Japan |
India |
World |
Turkey |
South Korea |
Indonesia |
Russia |
EU-27 (1) |
China |
Brazil |
South Africa |
(1) Estimate made for the purpose of this publication based on latest available data (excluding Italy, Luxembourg, Austria, Finland, Scotland and Northern Ireland).
Source: Eurostat (online data codes: env_watqsum, demo_gind and demo_r_d3avg), the United Nations Environment Programme (Water Section), the World Bank (World Development Indicators and Global Development Finance) and the United Nations Department of Economic and Social Affairs (World Population Prospects: the 2010 Revision)
|
The EU in the world 2013 — a statistical portrait |
|
113 |
|
11  Environment
The management and disposal of waste can have serious environmental impacts, taking up space and potentially releasing pollution into the air, water or soil. Among the G20 members with data available (see Table 11.5) Japan reported the most frequent use of incineration and Mexico the greatest use of landfill. In South Korea nearly half of the collected municipal waste was recycled, whereas in Turkey there was practically no recycling. The amount of municipal waste collected ranged from 271 kg per inhabitant in Brazil to 502 kg per inhabitant in the EU 27, with the United States above this range and China, Indonesia and India below it (see Figure 11.4).
Table 11.5: Municipal waste, 2010
|
Collected |
|
Treated |
|
|
|
|
Landfilled |
Incinerated |
|
Recycled |
Composted |
|
|
(million tonnes) |
|
||||
|
|
(% of total treatment) |
|
|||
|
|
|
|
|||
EU-27 (1) |
252.1 |
38.2 |
22.1 |
|
24.9 |
14.7 |
Argentina |
: |
: |
: |
|
: |
: |
Australia (2) |
8.9 |
69.7 |
: |
|
30.3 |
: |
Brazil (3) |
51.4 |
: |
: |
|
|
: |
Canada (4) |
13.4 |
: |
: |
|
26.8 |
12.5 |
China (5) |
157.3 |
56.6 |
12.9 |
|
: |
1.1 |
India (6) |
17.6 |
: |
: |
|
: |
: |
Indonesia (7) |
9.6 |
: |
: |
|
: |
: |
Japan (2) |
54.4 |
3.4 |
74.0 |
|
16.8 |
: |
Mexico (8) |
36.1 |
96.7 |
0.0 |
|
3.3 |
0.0 |
Russia (5) |
56.2 |
: |
: |
|
: |
: |
Saudi Arabia |
: |
: |
: |
|
: |
: |
South Africa |
: |
: |
: |
|
: |
: |
South Korea (4) |
18.3 |
36.4 |
14.4 |
|
49.2 |
0.0 |
Turkey (5) |
28.0 |
84.8 |
0.0 |
|
0.0 |
1.1 |
United States (9) |
222.9 |
54.3 |
13.6 |
|
23.8 |
8.4 |
(1) Municipal waste generated instead of collected. (2) 2003. (3) 2007. (4) 2004. (5) 2009. (6) 2001. (7) 2008. (8) 2006. (9) 2005.
Source: Eurostat (online data code: env_wasmun) and the United Nations Statistics Division (Environment statistics, Waste section)
Figure 11.4: Municipal waste collection, 2010(1)
(kg per inhabitant)
800 |
|
|
|
|
|
|
|
|
|
|
|
|
600 |
|
|
|
|
|
|
|
|
|
|
|
|
400 |
|
|
|
|
|
|
|
|
|
|
|
|
200 |
|
|
|
|
|
|
|
|
|
|
|
|
0 |
|
|
|
|
|
|
|
|
|
|
|
|
(StatesUnited2) |
EU-27 (3) |
Australia (4) |
Japan (4) |
Canada (5) |
Russia (6) |
Turkey (6) |
(KoreaSouth5) |
Mexico (7) |
Brazil (8) |
China (6) |
Indonesia (9) |
India (10) |
(1) Argentina, Saudi Arabia and South Africa, not available. (2) 2005. (3) Municipal waste generated instead of collected. (4) 2003. (5) 2004. |
||||||||||||
(6) 2009. (7) 2006. (8) 2007. (9) 2008. (10) 2001. |
|
|
|
|
|
|
|
|
|
|||
Source: Eurostat (online data code: env_wasmun) and the United Nations Statistics Division (Environment statistics, Waste section)
114 |
|
The EU in the world 2013 — a statistical portrait |
|
|
Environment  11
11
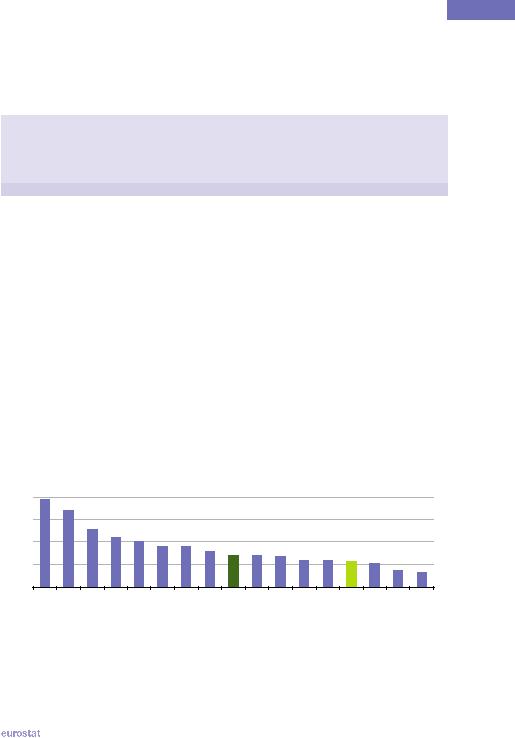
Terrestrial and marine areas may be protected because of their ecological or cultural importance and they provide a habitat for plant and animal life. In the EU 27 around 16 % of the surface area is designated as a protected area as is 9 % of the marine area. Among the other G20 members the largest shares of surface area that were protected were in Saudi Arabia and Brazil, with Brazil having the largest protected area in absolute terms (2.2 million km² in 2010). A large proportion of marine areas around the United States and Australia had protected status and these were also the largest protected marine areas in absolute size, each over 200 000 km².
Figure 11.5: Terrestrial protected areas, 2010(1)
(% of surface area)
40 |
|
|
|
|
|
|
|
|
|
|
|
|
|
|
|
30 |
|
|
|
|
|
|
|
|
|
|
|
|
|
|
|
20 |
|
|
|
|
|
|
|
|
|
|
|
|
|
|
|
10 |
|
|
|
|
|
|
|
|
|
|
|
|
|
|
|
0 |
|
China |
|
EU-27 |
Indonesia |
|
Mexico |
|
|
Canada |
|
|
|
|
|
Saudi Arabia |
Brazil |
Japan |
StatesUnited |
Australia |
Russia |
South Korea |
South Africa |
Argentina |
India |
Turkey |
(1) Surface area includes land and inland waters.
Source: the International Union for Conservation of Nature and the United Nations Environment Programme World Conservation Monitoring Centre in the World Database on Protected Areas
Figure 11.6: Marine protected areas, 2010
(% of territorial waters)
40 |
|
|
|
|
|
|
|
|
|
|
|
|
|
|
|
30 |
|
|
|
|
|
|
|
|
|
|
|
|
|
|
|
20 |
|
|
|
|
|
|
|
|
|
|
|
|
|
|
|
10 |
|
|
|
|
|
|
|
|
|
|
|
|
|
|
|
0 |
|
Mexico |
|
Russia |
EU-27 |
South Africa |
Japan |
South Korea |
Saudi Arabia |
|
Indonesia |
India |
China |
Canada |
Argentina |
StatesUnited |
Australia |
Brazil |
Turkey |
Source: the International Union for Conservation of Nature and the United Nations Environment Programme World Conservation Monitoring Centre in the World Database on Protected Areas
|
The EU in the world 2013 — a statistical portrait |
|
115 |
|