
Health
Health issues cut across a range of topics – including the provision of healthcare and protection from illness and accidents, such as consumer protection (food safety issues), workplace safety, environmental or social policies. The health statistics presented in this publication address public health issues such as healthcare expenditure, provision and resources as well as health status and causes of death.
In many developed countries life expectancy at birth has risen rapidly during the last century due to a number of factors, including reductions in infant mortality, rising living standards, improved lifestyles and better education, as well as advances in healthcare and medicine. Life expectancy at birth is one of the most commonly used indicators for analysing mortality. Indicators of health expectancies, such as healthy life years (also called disability-free life expectancy) have been developed to study whether extra years of life gained through increased longevity are spent in good or bad health; these focus on the quality of life spent in a healthy state, rather than total life spans.
Main findings
Healthcare systems are organised and financed in different ways. Monetary and non-monetary statistics may be used to evaluate how a healthcare system aims to meet basic needs for healthcare, through measuring financial, human and technical resources within the healthcare sector.
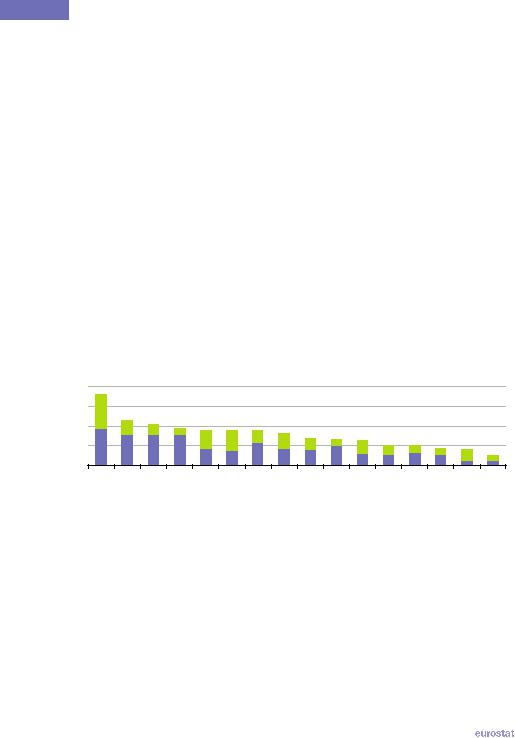
Public expenditure on healthcare is often funded through government financing (general taxation) or social security funds. Private expenditure on healthcare mainly comes from direct household payments (also known as out-of-pocket expenditure) and private health insurance. The mixture of public and private expenditure on health reflects arrangements in healthcare systems. Public expenditure exceeded private expenditure in most G20 members, most notably in Japan, the EU 27 and Turkey. Private expenditure on health was higher than public expenditure in India, South Africa and Brazil, while the two sources of expenditure were more or less balanced in Mexico and Indonesia.
|
The EU in the world 2013 — a statistical portrait |
|
41 |
|
3  Health
The United States had by far the highest expenditure on health relative to GDP, 17.9 % in 2010. Six of the G20 members committed between 9 % and 11 % of their GDP to health: Canada, the EU 27, Japan, Brazil, South Africa and Australia. Argentina was just below this grouping, with health expenditure equivalent to 8.1 % of GDP, followed by a smaller grouping of South Korea, Turkey and Mexico (6 % to 7 % of GDP). The remaining G20 members spent around 5 % or less of GDP on health, with the lowest relative expenditure recorded for Indonesia (2.6 %).
In broad terms, expenditure on health relative to GDP was higher in G20 members with a higher average level of income per capita, although there were a number of exceptions: Brazil and South Africa ranked higher in terms of their expenditure on health than they did in terms of GNI per capita, while Saudi Arabia, Russia, and to a lesser extent Australia and South Korea, ranked lower.
Table 3.1 shows the absolute level of health expenditure per person – note that this is shown at current exchange rates and so does not reflect differences in price levels of healthcare among the G20 members; the other indicators in this table are non-monetary indicators and are therefore not affected by price level differences. An alternative measure to the relative expenditure on health as a percentage of GDP is provided by a ranking based on the absolute level of expenditure per inhabitant. This shows relatively high levels of expenditure per inhabitant in Saudi Arabia, Australia and South Korea, whereas South Africa recorded a relatively low ratio (when contrasted with expenditure as a percentage of GDP).
Figure 3.1: Analysis of expenditure on health, 2010
(% of GDP)
20 |
|
|
|
|
|
|
|
|
|
|
|
|
|
|
|
15 |
|
|
|
|
|
|
|
|
|
|
|
|
|
|
|
10 |
|
|
|
|
|
|
|
|
|
|
|
|
|
|
|
5 |
|
|
|
|
|
|
|
|
|
|
|
|
|
|
|
0 |
Canada |
EU-27 (1) |
Japan |
Brazil |
AfricaSouth |
Australia |
|
KoreaSouth |
|
Mexico |
China |
|
ArabiaSaudi |
India |
Indonesia |
StatesUnited |
Argentina |
Turkey |
Russia |
 Private expenditure
 Public expenditure
(1) Estimate based on partial data for 2008 and 2009 (excluding Ireland, Greece, Italy, Malta and the United Kingdom).
Source: Eurostat (online data codes: hlth_sha_hf and nama_gdp_c) and the World Health Organisation (World Health Statistics)
The need for hospital beds may be influenced by the relative importance of inpatient and outpatient care and the use of technical resources. The number of hospital beds per 100 000 inhabitants averaged 551 in the EU 27 in 2009 which was the fourth highest ratio among G20 members behind Japan, South Korea and Russia. The lowest availability of hospital beds relative to the size of the population was in India and Indonesia, both with less than 100 beds per 100 000 inhabitants (see Table 3.1).
42 |
|
The EU in the world 2013 — a statistical portrait |
|
|

Health  3
3
One of the key indicators for measuring healthcare personnel is the total number of physicians, expressed per 100 000 inhabitants. The variation between the G20 members in the number of physicians was relatively low in comparison with the other personnel indicators in Table 3.1. In 2009 the highest number of physicians per 100 000 inhabitants among the G20 members was recorded in Russia (431), followed by the EU 27 (336); the lowest numbers were recorded in Indonesia (29), India (65) and South Africa (77). Argentina, China and Turkey were the only G20 members to record more physicians than nurses and midwives and these three countries, together with Turkey, had the lowest number of nurses and midwives per 100 000 inhabitants.
Among the three indicators concerning healthcare personnel the number of dentists per 100 000 inhabitants showed the greatest variation (when accounting for their relatively low number) among the G20 members. China, Indonesia and India recorded less than 10 dentists per 100 000 inhabitants while in South Africa the ratio was just above this level. In the United States, Mexico, Canada and Brazil there were more than 100 dentists per 100 000 inhabitants.
Table 3.1: Main indicators for health resources, 2009
|
Expenditure on |
Number of |
Number of |
Number of |
Number |
|
nurses and |
of |
|||
|
|
2 |
3 |
||
|
health (EUR per |
hospital beds ( ) |
physicians ( ) |
midwives (4) |
dentists (5) |
|
inhabitant) (1) |
|
|
|
|
|
|
(per 100 000 inhabitants) |
|
||
EU-27 |
2 378 |
551 |
336 |
689 |
62 |
Argentina |
560 |
450 |
316 |
48 |
92 |
Australia |
3 601 |
380 |
299 |
959 |
69 |
Brazil |
747 |
240 |
176 |
642 |
117 |
Canada |
3 939 |
320 |
198 |
1 043 |
126 |
China |
167 |
420 |
142 |
138 |
4 |
India |
41 |
90 |
65 |
100 |
8 |
Indonesia |
58 |
60 |
29 |
204 |
6 |
Japan |
3 066 |
1 370 |
214 |
414 |
74 |
Mexico |
456 |
160 |
196 |
398 |
142 |
Russia |
396 |
970 |
431 |
852 |
32 |
Saudi Arabia |
513 |
220 |
94 |
210 |
23 |
South Africa |
490 |
280 |
77 |
408 |
13 |
South Korea |
1 085 |
1 030 |
202 |
529 |
50 |
Turkey |
511 |
250 |
154 |
64 |
27 |
United States |
6 308 |
300 |
242 |
982 |
163 |
(1) EU 27: estimate based on data for 2009 other than Bulgaria, Cyprus, Latvia, Luxembourg, Austria and Portugal (all 2008) and Ireland, Greece, Italy, Malta and the United Kingdom (no data available); other countries: data relate to 2010.
(2) Argentina, Brazil and Indonesia, 2010; Russia, 2006; India and South Africa, 2005.
(3) EU 27: estimate based on data for 2009 other than Ireland, Spain, France, Malta, Austria, Portugal and the United Kingdom (all 2010) and Denmark, Cyprus, the Netherlands, Finland and Sweden (all 2008); South Korea, 2010; Brazil, Canada, Japan and Saudi Arabia, 2008; Indonesia, 2007; Russia, 2006; Argentina and South Africa, 2004.
(4) EU 27: estimate based on data for 2009 other than Spain, France, Malta, Portugal and the United Kingdom (all 2010), Denmark, the Netherlands, Finland and Sweden (all 2008), Luxembourg (2006), and Belgium, the Czech Republic, Italy, Cyprus and Slovakia (no data available); Brazil, India, Saudi Arabia and South Korea, 2008; Indonesia, 2007; Japan and Russia, 2006; the United States, 2005; Argentina, Mexico and South Africa, 2004.
(5) EU 27: estimate based on data for 2009 other than Ireland, France, Malta, Austria and the United Kingdom (all 2010) and Denmark, Cyprus, the Netherlands, Finland and Sweden (all 2008); Brazil, Canada, India and South Korea, 2008; Indonesia and Saudi Arabia, 2007; Japan and Russia, 2006; China, 2005; Argentina, Mexico and South Africa, 2004; the United States, 2000.
Source: Eurostat (online data codes: hlth_sha_hf and demo_gind) and the World Health Organisation (World Health Statistics)
|
The EU in the world 2013 — a statistical portrait |
|
43 |
|
3  Health
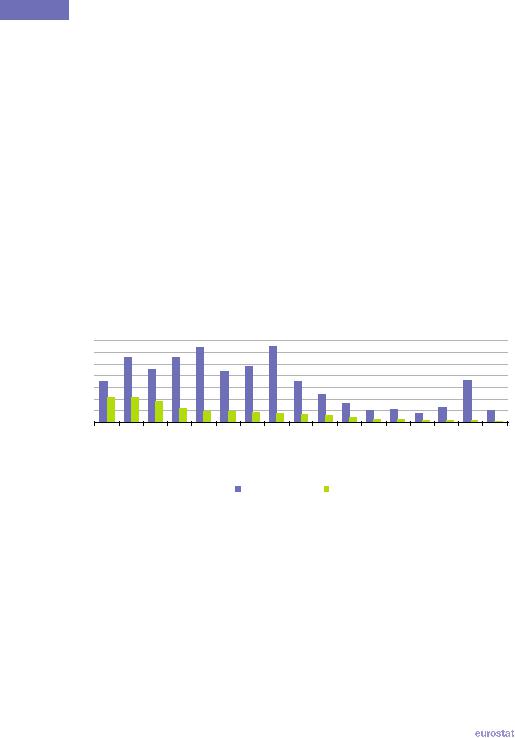
The infant mortality rate presents the ratio between the number of deaths of children aged less than one year and the number of live births in the same reference period; the resulting value is generally expressed per 1 000 live births. The progress made in medical healthcare services is reflected in the rapid decrease of infant mortality rates, with the world average falling from 114.2 deaths per 1 000 live births in the period 1960 to 1965 to 45.6 deaths per 1 000 live births in the period 2005 to 2010.
All of the G20 members recorded falls in infant mortality rates between the two periods shown in Figure 3.2. The largest relative falls were recorded by South Korea, Japan, Saudi Arabia, the EU 27 and Turkey, while South Africa was the only G20 member where the infant mortality rate did not fall by at least 50 %.
The latest data available, covering the period from 2005 to 2010, shows that the lowest infant mortality rates among G20 members were recorded in Japan, South Korea, the EU 27 and Australia, all under 5 deaths per 1 000 live births. By contrast, infant mortality rates in South Africa and India were more than ten times as high as in the four G20 members with the lowest rates and nearly twice as high as the rate in Indonesia which had the next highest rate.
Figure 3.2: Infant mortality rate, average for July 1960 to June 1965 and average for July 2005 to June 2010
(infant deaths per 1 000 live births)
175 |
|
|
|
|
|
|
|
|
|
|
|
|
|
|
|
|
150 |
|
|
|
|
|
|
|
|
|
|
|
|
|
|
|
|
125 |
|
|
|
|
|
|
|
|
|
|
|
|
|
|
|
|
100 |
|
|
|
|
|
|
|
|
|
|
|
|
|
|
|
|
75 |
|
|
|
|
|
|
|
|
|
|
|
|
|
|
|
|
50 |
|
|
|
|
|
|
|
|
|
|
|
|
|
|
|
|
25 |
|
|
|
|
|
|
|
|
|
|
|
|
|
|
|
|
0 |
India |
|
Indonesia |
|
Brazil |
|
ArabiaSaudi |
Mexico |
|
|
|
Canada |
Australia |
EU-27 (1) |
|
Japan |
AfricaSouth |
World |
Turkey |
China |
Argentina |
Russia |
StatesUnited |
KoreaSouth |
|||||||||
|
|
|
|
|
|
1960-1965 |
|
|
2005-2010 |
|
|
|
|
|
||
(1) Average for years 1961 to 1965 and 2005 to 2009. |
|
|
|
|
|
|
|
|
|
|
|
|||||
Source: Eurostat (online data code: demo_minfind) and the United Nations Department of Economic and Social Affairs (World Population Prospects: the 2010 Revision)
44 |
|
The EU in the world 2013 — a statistical portrait |
|
|
Health  3
3
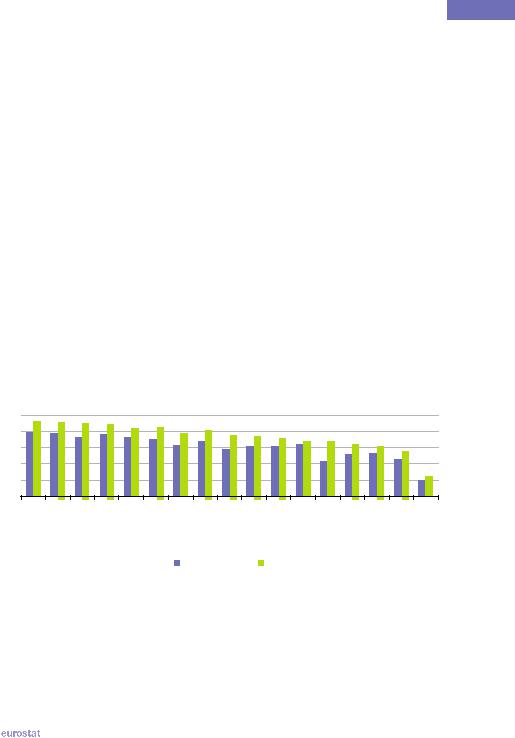
The average life expectancy of a new-born baby in the world was 67.9 years during the period from 2005 to 2010, which was 16.7 years higher than the corresponding figure for the period from 1960 to 1965. All G20 members, except for Russia, recorded an increase in life expectancy at birth between the period from 1960 to 1965 and the period from 2005 to 2010. The largest overall increases in life expectancy between these two periods were in China (an increase of 28.7 years), Saudi Arabia (26.7 years), South Korea (25.2 years) and Turkey (24.4 years); the lowest increase in life expectancy at birth was in South Africa (1.3 years). In Russia, life expectancy at birth fell from 69.1 years as recently as the period from 1985 to 1990 to a low of 64.9 years between 2000 and 2005, before recovering to 67.8 years between 2005 and 2010.
The highest life expectancy at birth in the most recent period (2005 to 2010) was in Japan (82.7 years), while in Australia, Canada and South Korea life expectancy also reached or passed 80 years, with the EU 27 (79.2 years, 2005 to 2009) just below this level. In four G20 members life expectancy at birth remained below 70 years, ranging from 67.9 years in Indonesia, through 67.7 years in Russia and 64.2 years in India, down to 51.2 years in South Africa. The relatively low life expectancy for South Africa may be largely attributed to the impact of an HIV/AIDS epidemic.
In all G20 members life expectancy at birth for girls was higher than for boys (see Figure 3.3). By far the largest gender difference was in Russia where the life expectancy for new-born boys was 12.5 years lower than for new-born girls. The global difference between life expectancy of girls and boys was 4.4 years, which was approximately double the difference in South Africa (2.0 years) and Saudi Arabia (2.2 years).
Figure 3.3: Life expectancy at birth, average for July 2005 to June 2010 (1)
(years) |
|
|
|
|
|
|
|
|
|
|
|
|
|
|
|
|
90 |
|
|
|
|
|
|
|
|
|
|
|
|
|
|
|
|
80 |
|
|
|
|
|
|
|
|
|
|
|
|
|
|
|
|
70 |
|
|
|
|
|
|
|
|
|
|
|
|
|
|
|
|
60 |
|
|
|
|
|
|
|
|
|
|
|
|
|
|
|
|
50 |
|
|
|
|
|
|
|
|
|
|
|
|
|
|
|
|
40 |
Australia |
|
Canada |
|
|
|
Mexico |
Brazil |
|
|
|
|
|
Indonesia |
India |
|
Japan |
KoreaSouth |
EU-27 (2) |
StatesUnited |
Argentina |
Turkey |
China |
ArabiaSaudi |
Russia |
World |
AfricaSouth |
||||||
|
|
|
|
|
|
|
Male |
|
|
Female |
|
|
|
|
|
|
(1) Note: y-axis does not start at 0; ranked on a simple average of male and female. (2) Average for 2005 to 2009.
Source: Eurostat (online data code: demo_mlexpec) and the United Nations Department of Economic and Social Affairs (World Population Prospects: the 2010 Revision)
|
The EU in the world 2013 — a statistical portrait |
|
45 |
|
3  Health
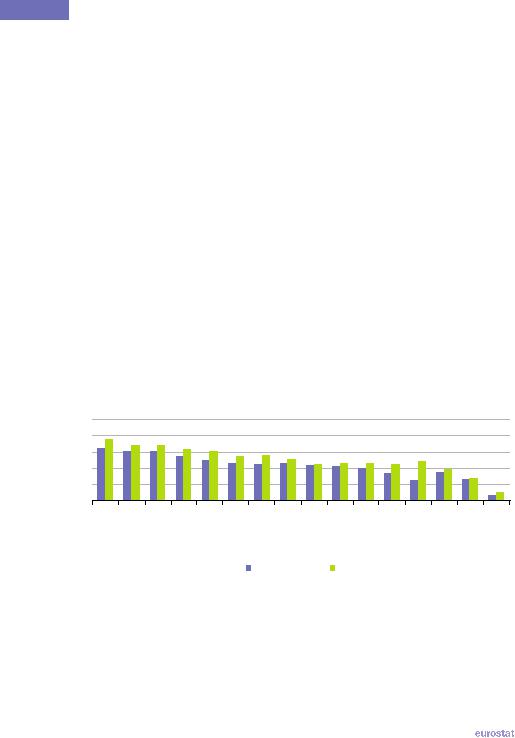
Unlike life expectancy, indicators on healthy life years introduce the concept of the quality of life, by focusing on those years that may be enjoyed by individuals free from the limitations of illness or disability; note that comparisons across countries may suffer from divergences in the way that limitations due to ill-health are measured in different countries. Chronic disease, frailty, mental disorders and physical disability tend to become more prevalent in older age, and may result in a lower quality of life for those who suffer from such conditions, while the burden of these conditions may also impact on healthcare and pension provisions. As for life expectancy at birth, there was also a gender difference for the number of expected healthy life years at birth, ranging from just 0.2 years of additional healthy life years for girls in India to 11.3 years for girls in Russia. For both males and females, Japan had the highest number of expected healthy life years at birth and South Africa the lowest.
Statistics on causes of death may be used to evaluate the state of health and healthcare as well as to indentify potential areas for preventive and medical-curative measures and research. As most causes of death vary with people’s age and sex, the use of standardised death rates improves comparability, as death rates can be measured independently of the population structure. In most G20 members the most common causes of death were diseases of the circulatory system followed by cancer (malignant neoplasms); the order was reversed in Japan, Canada, Russia and Australia, while in India death rates from diseases of the respiratory system were higher than those from diseases of the circulatory system. Among the causes of death shown in Table 3.2 the death rates from cancer were the most similar among the G20 members, while the greatest variation was recorded in relation to death rates for tuberculosis and assault.
Figure 3.4: Healthy life years at birth, 2002(1)
(years) |
|
|
|
|
|
|
|
|
|
|
|
|
|
|
|
90 |
|
|
|
|
|
|
|
|
|
|
|
|
|
|
|
80 |
|
|
|
|
|
|
|
|
|
|
|
|
|
|
|
70 |
|
|
|
|
|
|
|
|
|
|
|
|
|
|
|
60 |
|
|
|
|
|
|
|
|
|
|
|
|
|
|
|
50 |
|
|
|
|
|
|
|
|
|
|
|
|
|
|
|
40 |
Australia |
Canada |
|
|
Mexico |
|
|
|
|
|
Brazil |
|
Indonesia |
India |
|
Japan |
StatesUnited |
KoreaSouth |
Argentina |
China |
EU-27 (2) |
Turkey |
ArabiaSaudi |
Russia |
AfricaSouth |
||||||
|
|
|
|
|
|
Male |
|
|
Female |
|
|
|
|
|
|
(1) Estimates, other than for the EU-27; note the y-axis does not start at 0; ranked on a simple average of male and female; note that any comparison of absolute values should take into account the differences and limitations relating to how ill-health is measured across different countries.
(2) 2010; provisional.
Source: Eurostat (online data code: hlth_hlye) and the World Health Organisation (World Health Report 2004)
46 |
|
The EU in the world 2013 — a statistical portrait |
|
|

Health  3
3
Table 3.2: Selected causes of death - standardised death rates, 2008
(per 100 000 inhabitants)
|
All causes of |
Circulatory |
Malignant |
Respiratory |
Digestive |
|
death |
system |
neoplasms |
system |
system |
EU-27 (1) |
600.6 |
217.3 |
169.0 |
43.6 |
30.6 |
Argentina |
636.7 |
200.0 |
135.3 |
58.9 |
30.7 |
Australia |
378.0 |
117.2 |
118.8 |
21.6 |
13.0 |
Brazil |
707.3 |
237.2 |
114.7 |
44.3 |
40.0 |
Canada |
401.2 |
118.6 |
125.8 |
22.4 |
15.5 |
China |
731.4 |
287.3 |
145.1 |
109.3 |
20.1 |
India |
1 146.6 |
316.5 |
75.0 |
153.6 |
55.3 |
Indonesia |
961.1 |
323.6 |
120.9 |
75.8 |
35.4 |
Japan |
349.3 |
97.4 |
115.1 |
15.8 |
14.5 |
Mexico |
616.8 |
164.8 |
81.5 |
37.4 |
63.4 |
Russia |
435.8 |
124.2 |
125.9 |
22.4 |
20.4 |
Saudi Arabia |
1 027.0 |
568.4 |
129.8 |
20.5 |
45.4 |
South Africa |
797.3 |
398.3 |
71.0 |
25.9 |
28.7 |
South Korea |
1 691.1 |
261.8 |
155.4 |
61.9 |
29.7 |
Turkey |
673.4 |
350.3 |
114.9 |
64.4 |
18.1 |
United States |
504.9 |
155.7 |
123.8 |
34.3 |
19.8 |
World |
844.4 |
257.2 |
112.6 |
62.8 |
32.7 |
|
Accidents |
Tuberculosis |
Diabetes |
Self-harm |
Assault |
|
mellitus |
||||
|
|
|
|
|
|
EU-27 (1) |
22.6 |
0.9 |
12.4 |
10.3 |
0.9 |
Argentina |
33.1 |
1.5 |
17.7 |
9.1 |
6.2 |
Australia |
21.0 |
0.2 |
9.9 |
7.8 |
1.3 |
Brazil |
41.6 |
3.2 |
37.7 |
5.8 |
28.5 |
Canada |
20.6 |
0.2 |
13.4 |
9.9 |
1.6 |
China |
55.6 |
11.4 |
13.4 |
12.1 |
1.5 |
India |
74.5 |
28.8 |
23.8 |
19.1 |
4.8 |
Indonesia |
51.3 |
31.9 |
29.5 |
9.7 |
8.8 |
Japan |
16.1 |
1.0 |
4.5 |
19.8 |
0.4 |
Mexico |
33.9 |
2.9 |
83.8 |
4.5 |
18.2 |
Russia |
29.7 |
6.1 |
23.0 |
20.1 |
2.0 |
Saudi Arabia |
116.3 |
15.8 |
4.8 |
23.4 |
16.2 |
South Africa |
58.4 |
2.2 |
59.0 |
5.9 |
2.8 |
South Korea |
35.7 |
44.4 |
66.7 |
7.4 |
29.1 |
Turkey |
24.5 |
3.8 |
14.9 |
2.2 |
2.8 |
United States |
35.5 |
0.1 |
15.2 |
10.3 |
6.5 |
World |
53.7 |
19.9 |
18.6 |
11.6 |
7.9 |
(1) 2009.
Source: Eurostat (online data code: hlth_cd_asdr) and the World Health Organisation (Department of Measurement and Health Information)
|
The EU in the world 2013 — a statistical portrait |
|
47 |
|