
Economy and finance
Indicators from various areas, such as national accounts, government finance, exchange rates and interest rates, consumer prices, and the balance of payments support an analysis of the economic situation. These indicators are also used in the design, implementation and monitoring of economic policies and have been particularly under the spotlight with respect to the financial and economic crisis.
GDP is the most commonly used economic indicator; it provides a measure of the size of an economy, corresponding to the monetary value of all production activities. GDP includes goods and services, as well as products from general government and non-profit institutions within the country (‘domestic’ production). Gross national income (GNI) is the sum of gross primary incomes receivable by resident institutional units/sectors, that is, GDP less primary income payable to non-residents plus primary income receivable from non-residents (‘national’ concept).
GDP per capita is often used as a broad measure of living standards, although there are a number of international statistical initiatives to provide alternative and more inclusive measures. GDP at constant prices is intended to allow comparisons of economic developments over time, as the impact of price developments (inflation) has been removed. Equally, comparisons between countries can be facilitated when indicators are converted from national currencies into a common currency using purchasing power parities (PPP) which reflect price level differences between countries.
Main findings
In 2010 world GDP was valued at EUR 47 570 billion, of which the G20 members accounted for 86.7 %, 3.0 percentage points less than in 2000 – see Figure 1.1. The EU 27 accounted for a 25.8 % share of the world’s GDP in 2010, while the United States accounted for a 22.9 % share; note these relative shares are based on current price series in euro terms, reflecting movements in bilateral exchange rates. The Chinese share of world GDP was 9.1 % in 2010, ahead of the share for Japan (8.7 %). To put the rapid pace of Chinese growth into context, in current price terms
|
The EU in the world 2013 — a statistical portrait |
|
17 |
|
|
|
|
1 |
|
Economy and finance |
|
|
China’s GDP in 2010 was EUR 3 038 billion higher than it was in 2000, an increase equivalent to the combined GDP in 2010 of the six smallest G20 economies (South Korea, Turkey, Indonesia, Saudi Arabia, Argentina and South Africa).
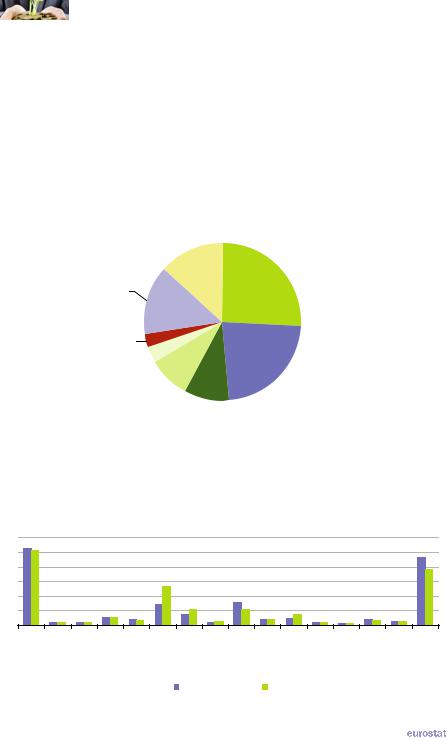
Figure 1.2 shows the breakdown of GDP between the G20 members for 2000 and 2010 – note that these figures are in PPP terms (in other words, they are adjusted for price level differences). On this basis, the relative importance of China within the global economy was considerably higher, equivalent to some 13.3 % of the world total in 2010, which was just over half the share recorded for the EU 27 (25.8 %).
Figure 1.1: Share of world GDP, 2010
(%)
Rest of the world
13.3% EU-27
25.8%
Remaining G20 countries (1) 14.2%
India 2.7%
Brazil 3.3%
Japan |
|
United |
|
|
States |
||
8.7% |
|
||
China |
22.9% |
||
|
|||
|
9.1% |
|
(1) Canada, Russia, Australia, Mexico, South Korea, Turkey, Indonesia, Saudi Arabia, Argentina and South Africa.
Source: Eurostat (online data code: nama_gdp_c) and the United Nations Statistics Division (National Accounts Main Aggregates Database)
Figure 1.2: Share of world GDP, 2000 and 2010
(%, based on current international PPP)
30 |
|
|
|
|
|
|
|
|
|
|
|
|
|
|
|
25 |
|
|
|
|
|
|
|
|
|
|
|
|
|
|
|
20 |
|
|
|
|
|
|
|
|
|
|
|
|
|
|
|
15 |
|
|
|
|
|
|
|
|
|
|
|
|
|
|
|
10 |
|
|
|
|
|
|
|
|
|
|
|
|
|
|
|
5 |
|
|
|
|
|
|
|
|
|
|
|
|
|
|
|
0 |
|
Australia |
Brazil |
Canada |
China |
India |
Indonesia |
Japan |
Mexico |
Russia |
ArabiaSaudi |
South Africa |
South Korea |
|
|
EU-27 |
Argentina |
Turkey |
StatesUnited |
||||||||||||
|
|
|
|
|
|
2000 |
|
|
|
2010 |
|
|
|
|
|
Source: the World Bank (World Development Indicators and Global Development Finance)
18 |
|
The EU in the world 2013 — a statistical portrait |
|
|
|
|
|
Economy and finance |
|
1 |
|
|
Figure 1.3 shows the real growth rate (based on constant price data) of the EU 27 compared with the other G20 members – note the different scale used for the first part of the figure. The lowest rates of change were generally recorded by the developed economies such as Japan, Canada, the United States and the EU 27, while the highest rates were recorded in the two Asian economies of China and India.
Figure 1.3: GDP, 2000-2010(1)
(2000 = 100)
Highest growth among G20 countries
300
250
200 150
100 50
2000 |
2001 |
2002 |
2003 |
2004 |
2005 |
2006 |
2007 |
2008 |
2009 |
2010 |
|||
|
|
|
EU-27 |
|
|
|
China |
|
|
|
India |
|
|
|
|
|
|
|
|
|
|
|
|
|
|||
|
|
|
Indonesia |
|
|
Russia |
|
|
|
Argentina |
|
|
|
|
|
|
|
|
|
|
|
|
|
||||
Intermediate growth among G20 countries
200
150
100
50
2000 |
2001 |
2002 |
2003 |
2004 |
2005 |
2006 |
2007 |
2008 |
2009 |
2010 |
|||
|
|
|
EU-27 |
|
|
|
South Korea |
|
|
Turkey |
|
|
|
|
|
|
|
|
|
|
|
|
|
||||
|
|
|
Brazil |
|
|
|
South Africa |
|
|
Saudi Arabia |
|
||
|
|
|
|
|
|
|
|
|
|||||
Lowest growth among G20 countries
200
150
100
50
2000 |
2001 |
2002 |
2003 |
2004 |
2005 |
2006 |
2007 |
2008 |
2009 |
2010 |
|||
|
|
|
EU-27 |
|
|
|
Australia |
|
|
|
Canada |
|
|
|
|
|
|
|
|
|
|
|
|
|
|||
|
|
|
Mexico |
|
|
|
United States |
|
|
Japan |
|
|
|
|
|
|
|
|
|
|
|
|
|
||||
(1) Note the differences in the range of the y-axes between the three separate parts of the figure; the EU-27 series is shown in all three figures for the purpose of comparison.
Source: Eurostat (online data code: nama_gdp_k) and the United Nations Statistics Division (National Accounts Main Aggregates Database)
|
The EU in the world 2013 — a statistical portrait |
|
19 |
|
|
|
|
1 |
|
Economy and finance |
|
|
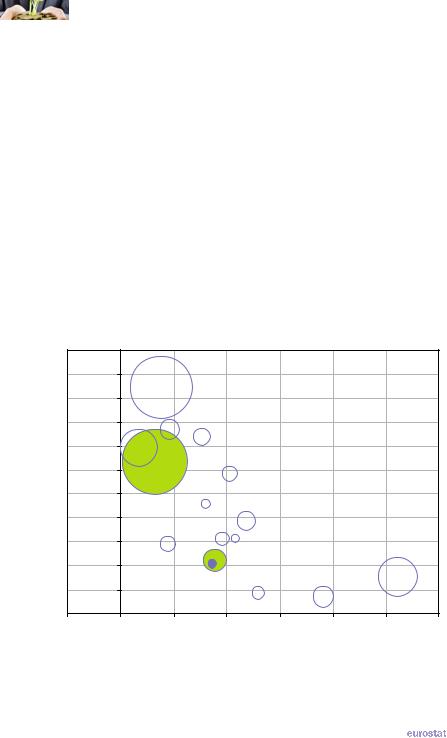
Among the G20 members, the highest gross national income (GNI) per person in 2010 was recorded in the United States; note that the conversion to United States dollars used for this indicator in Figure 1.4 is based on purchasing power parities rather than market exchange rates and so reflects differences in price levels between countries. In comparison with the average GNI per person for the world (USD 11 068 per capita), the level in the United Sates was 4.3 times as high; Canada (3.5 times as high), Australia (3.3) and Japan (3.1) also recorded average GNI per capita that was more than three times the world average, followed by the EU 27 (2.9), South Korea (2.6) and Saudi Arabia (2.1). By contrast, five G20 members recorded GNI per capita levels around or below the world average, namely Brazil (1.0), South Africa (0.9), China (0.7), Indonesia (0.4) and India (0.3).
In broad terms, countries with relatively low GNI per capita recorded relatively high economic growth over the ten years from 2000 to 2010 and this was most notably the case in China and India. By contrast, countries with high GNI per capita recorded relatively low economic growth over the same period, and this was most notably the case in Japan; nevertheless, South Korea, Saudi Arabia and Australia combined a level of GNI per capita that was more than double the world average with an average annual growth in GDP that was above the world average (2.5 %) for the period 2000 to 2010.
Figure 1.4: Growth rate of constant price GDP and GNI per capita, 2000-2010 and 2010(1)
GNI per capita, 2010 (USD, international PPP)
55 000 |
|
|
|
|
|
|
|
|
50 000 |
|
|
|
|
|
|
|
|
45 000 |
|
|
United States |
|
|
|
|
|
|
|
|
|
|
|
|
|
|
40 000 |
Japan |
|
Canada |
|
|
|
|
|
|
|
|
Australia |
|
|
|
|
|
35 000 |
|
|
|
|
|
|
|
|
|
|
|
|
|
|
|
|
|
30 000 |
|
|
EU-27 |
|
|
|
|
|
|
|
|
South Korea |
|
|
|
||
|
|
|
|
|
|
|
||
25 000 |
|
Saudi Arabia (2) |
|
|
|
|
|
|
|
|
|
|
|
|
|
||
20 000 |
|
|
|
|
Russia |
|
|
|
|
|
|
|
|
|
|
|
|
15 000 |
|
Mexico |
Turkey |
Argentina |
|
|
|
|
|
|
|
|
|
||||
10 000 |
|
|
|
Brazil |
|
|
|
|
|
South Africa |
|
|
|
|
|
||
|
|
|
|
|
|
|
||
5 000 |
|
|
Indonesia |
|
|
India |
|
|
|
|
|
|
|
China |
|||
|
|
|
|
|
|
|
||
|
|
|
|
|
|
|
|
|
0 |
|
|
|
|
|
|
|
|
-2 |
0 |
2 |
|
4 |
6 |
8 |
10 |
12 |
Average growth rate of GDP, 2000-2010 (% per annum)
(1) GNI per capita is presented in United States dollars using purchasing power parity (PPP) rates for 2010; the relative size of each bubble reflects the value of GDP in current prices for 2010.
(2) GNI per capita, 2009.
Source: Eurostat (online data codes: nama_gdp_k and nama_gdp_c),
the United Nations Statistics Division (National Accounts Main Aggregates Database) and the World Bank (World Development Indicators and Global Development Finance)
20 |
|
The EU in the world 2013 — a statistical portrait |
|
|
|
|
|
Economy and finance |
|
1 |
|
|
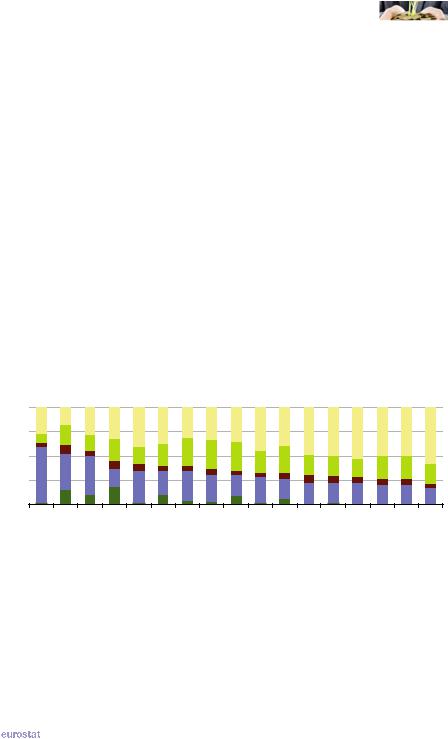
The economic structure of the G20 members varies most greatly in relation to the relative importance of agriculture, forestry and fishing and to a lesser extent in the relative share of industry – see Figure 1.5; note that the data for EU 27 and EA-17 is based on the NACE Rev. 2 activity classification (compatible with ISIC Rev.4 – see the glossary for more information) whereas the data for the other G20 members are based on ISIC Rev.3.
In 2010, agriculture, forestry and fishing contributed 10 % or more of GDP in India, Indonesia and Argentina, whereas its contribution was less than 1.5 % in Japan and the United States. Industry (including mining and quarrying; manufacturing; electricity, gas and water supply) contributed more than half of Saudi Arabian GDP (57.4 %) and more than one third of GDP in China and Indonesia, while in the EU 27 (2011 data), India and the United States the contribution was less than one fifth. The contribution of construction to GDP was less than 10 % in all of the G20 members shown in Figure 1.5, other than in Indonesia where it just reached double figures (10.3 %).
The contribution of distributive trades, hotels and restaurants, transport, information and communication services varied least between the G20 members, ranging from 30.1 % in Turkey to 15.8 % in China, with Saudi Arabia outside this range (9.1 %). In the United States and Japan other services contributed more than half of GDP, while Australia, the EU 27 and Canada recorded contributions from other services just below this level. By contrast, other services contributed between one third and one quarter of GDP in Saudi Arabia, China, Russia and India, and even less in Indonesia (17.4 %).
Figure 1.5: Analysis of GDP, 2010 (1)
(% of total)
100
75
50
25
0 |
SaudiArabia |
Indonesia |
China |
India |
SouthKorea |
Argentina |
Russia |
Mexico |
Turkey |
SouthAfrica |
Brazil |
Canada |
Australia |
Japan |
EU-27 (2) |
EA-17 (2) |
UnitedStates |
 Other services
 Distributive trades, hotels & restaurants, transport, information & communication
 Construction
 Industry
 Agriculture, forestry and shing
(1) Ranked on the combined share of agriculture, forestry, fishing, industry and construction. (2) 2011.
Source: Eurostat (online data code: nama_gdp_c) and the United Nations Statistics Division (National Accounts Main Aggregates Database)
|
The EU in the world 2013 — a statistical portrait |
|
21 |
|

|
|
|
1 |
|
Economy and finance |
|
|
The financial and economic crisis of 2008-2009 resulted in considerable media exposure for government finance indicators. The government surplus/deficit (public balance) measures government borrowing/lending for a particular year, in other words borrowing to finance a deficit or lending made possible by a surplus. General government debt refers to the consolidated stock of debt at the end of the year. Typically these indicators are expressed in relation to GDP; in Figure 1.6 the size of each bubble reflects the absolute size of general government debt, which ranged in 2011 from EUR 31.1 billion in Saudi Arabia to EUR 11 157 billion in the United States.
From Figure 1.6 it can be seen that most G20 members had a government deficit in 2011. Only three G20 members – Russia, South Korea and Saudi Arabia – recorded a surplus. Generally G20 members with the highest government deficits had the highest levels of government debt and this was notably the case for Japan and to a lesser extent the United States. Equally, the two members with the lowest levels of government debt, namely Saudi Arabia and Russia, were among the few countries with a government surplus.
Figure 1.6: Government deficit/surplus and government debt, 2011 (1)
(% of GDP)
General government gross debt
300
Japan
250
200
150 |
|
|
|
|
|
|
|
|
|
United States |
|
|
EU-27 (2) |
|
|
|
|
100 |
|
|
|
Canada |
|
|
|
|
|
|
India |
|
Brazil |
|
|
|
|
50 |
|
|
Argentina |
Mexico Turkey |
|
|
|
|
|
|
South Africa |
Indonesia South Korea |
|
|
|
||
|
|
|
Australia |
|
Saudi Arabia |
|
||
|
|
|
China |
Russia |
|
|
||
|
|
|
|
|
|
|||
0 |
|
|
|
|
|
|
||
|
|
|
|
|
|
|
|
|
-20 |
-15 |
-10 |
-5 |
0 |
5 |
10 |
15 |
20 |
Government de cit/surplus
(1) The size of each bubble reflects the overall debt of each country. (2) Maastricht debt criteria.
Source: Eurostat (online data code: gov_dd_edpt1) and the International Monetary Fund (World Economic Outlook)
22 |
|
The EU in the world 2013 — a statistical portrait |
|
|

|
|
|
Economy and finance |
|
1 |
|
|
The importance of the general government sector in the economy may be measured in terms of the average of general government revenue and expenditure in relation to GDP (no recent data available for Argentina, China, Mexico or Saudi Arabia). The highest such ratios for G20 members in 2010 were 50.5 % in Japan, followed closely by the EU 27 (46.9 % in 2011), while the lowest ratios were in India (13.2 %) and Indonesia (14.8 %); note the data for some countries relates only to central government expenditure and revenue (as opposed to general government).
The subtraction of expenditure from revenue results in the government surplus/deficit. Comparing data for 2001 with 2011 (see Table 1.1), Saudi Arabia’s government surplus increased, Russia and South Korea’s surpluses contracted, while Canada and Australia moved from a government surplus to a government deficit. At the same time, Argentina, India, China and Indonesia’s government deficits contracted, Brazil’s government deficit remained unchanged, and the government deficits of the United States, Japan, South Africa, the EU 27 and Mexico expanded.
Two of the G20 members recording government surpluses in 2011 saw their levels of debt fall between 2001 and 2011, namely Saudi Arabia and Russia. Other G20 countries with a lower ratio of general government gross debt to GDP in 2011 than in 2001 included Indonesia, Turkey, India, Argentina, South Africa and Brazil, despite all recording government deficits in 2011. All other G20 members shown in Table 1.1 recorded higher general government gross debt relative to GDP in 2011 than in 2001, most notably in Japan and the United States whose ratios of gross debt to GDP passed 200 % and 100 % of GDP respectively.
Table 1.1: General government finances, 2000, 2001, 2010 and 2011
(% of GDP)
|
Expenditure |
Revenue |
Deficit/ surplus |
Gross debt |
||||
|
2000 |
2010 |
2000 |
2010 |
2001 |
2011 |
2001 |
2011 |
EU-27 (1) |
44.8 |
49.1 |
45.3 |
44.6 |
-1.5 |
-4.5 |
61.9 |
82.5 |
EA-17 (1) |
46.2 |
49.4 |
46.0 |
45.3 |
-1.9 |
-4.1 |
69.2 |
87.2 |
Argentina (2)(3) |
19.7 |
: |
14.1 |
: |
-6.0 |
-3.3 |
53.7 |
44.2 |
Australia |
: |
37.8 |
: |
31.8 |
0.9 |
-4.3 |
17.1 |
22.9 |
Brazil (2)(4) |
21.7 |
25.6 |
19.9 |
23.1 |
-2.6 |
-2.6 |
70.2 |
66.2 |
Canada |
41.5 |
44.0 |
42.2 |
38.5 |
0.7 |
-4.5 |
82.7 |
85.0 |
China (2)(5) |
10.7 |
: |
7.1 |
11.9 |
-2.8 |
-1.2 |
17.7 |
25.8 |
India (2) |
15.7 |
15.0 |
11.9 |
11.4 |
-10.4 |
-8.7 |
77.8 |
68.1 |
Indonesia (2)(6) |
15.4 |
14.4 |
18.3 |
15.1 |
-2.7 |
-1.6 |
80.2 |
25.0 |
Japan |
38.7 |
54.8 |
31.9 |
46.3 |
-6.0 |
-10.1 |
153.6 |
229.8 |
Mexico (2) |
15.4 |
: |
14.7 |
: |
-3.2 |
-3.4 |
42.0 |
43.8 |
Russia (3) |
43.0 |
42.4 |
49.9 |
40.9 |
3.2 |
1.6 |
47.6 |
9.6 |
Saudi Arabia |
: |
: |
: |
: |
3.2 |
15.2 |
93.7 |
7.5 |
South Africa |
33.9 |
39.1 |
32.9 |
34.4 |
-1.2 |
-4.6 |
43.5 |
38.8 |
South Korea (2) |
16.6 |
19.9 |
22.3 |
22.7 |
2.7 |
2.3 |
18.7 |
34.1 |
Turkey (2) |
: |
25.4 |
: |
24.4 |
: |
-0.3 |
77.9 |
39.4 |
United States |
: |
38.1 |
: |
27.4 |
-0.3 |
-9.6 |
54.7 |
102.9 |
(1) Data for 2011 instead of 2010 for general government expenditure and revenue. (2) Central government instead of general government for expenditure and revenue. (3) Data for 2002 instead of 2000.
(4) Data for 2009 instead of 2010.
(5) Data for 2002 instead of 2000 for expenditure.
(6) Data for 2002 instead of 2000 for expenditure; data for 2001 instead of 2000 for revenue.
Source: Eurostat (online data code: gov_a_main and gov_dd_edpt1), International Monetary Fund (International Financial Statistics and World Economic Outlook) and the World Bank (World Development Indicators and Global Development Finance)
|
The EU in the world 2013 — a statistical portrait |
|
23 |
|
|
|
|
1 |
|
Economy and finance |
|
|
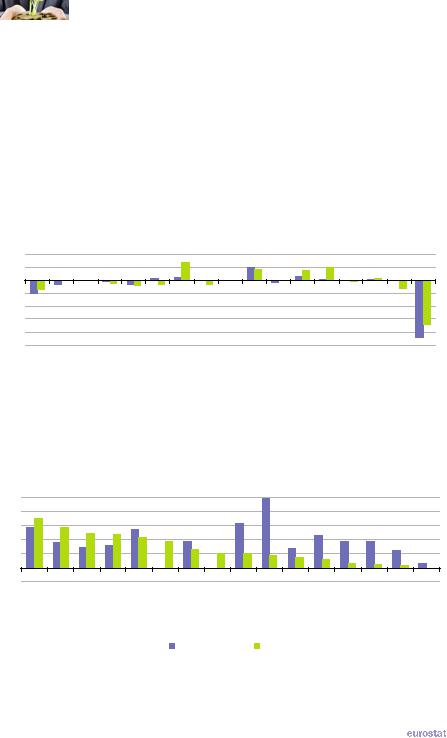
The current account of the balance of payments provides information on international trade in goods and services (see Chapter 9 for more details), as well as income from employment and investment and current transfers with the rest of the world. Apart from India, many of the Asian members of the G20 recorded current account surpluses in 2011, as did Russia. The largest surplus in 2011 in absolute terms was EUR 144.4 billion for China, while in relative terms Saudi Arabia’s surplus reached 24.4 % of GDP. The largest current account deficit was EUR 340.1 billion for the United States while Turkey’s deficit represented 9.9 % of GDP. Canada, India, South Africa and Turkey’s current account balance moved from a surplus to a deficit between 2001 and 2011, while the other G20 members shown in Figure 1.7 saw their deficits contract or their surpluses expand.
Figure 1.7: Current account balance, 2001 and 2011
(EUR billion)
200 |
100 |
0 |
-100 |
-200 |
-300 |
-400 |
-500 |
EU-27 |
EA-17 |
Argentina (1) |
Australia |
Brazil |
Canada |
China |
India |
Indonesia |
Japan |
|
Mexico (1) |
Russia |
SaudiArabia |
SouthAfrica |
SouthKorea |
Turkey |
UnitedStates |
||
|
|
|
|
|
|
|
|
|
2001 |
|
|
|
2011 |
|
|
|
|
|
|
|
|
|
|
|
|
|
|
|
|
|
|
|
|
|
|
|
|
||
|
|
|
|
|
|
|
|
|
|
|
|
|
|
|
|
|
|
||
(1) 2011, estimates.
Source: Eurostat (online data codes: bop_q_eu, bop_q_euro and nama_gdp_c) and the International Monetary Fund (World Economic Outlook)
Figure 1.8: Flows of foreign direct investment, 2011(1)
(% of GDP)
5 |
|
|
|
|
|
|
|
|
|
|
|
|
|
|
|
4 |
|
|
|
|
|
|
|
|
|
|
|
|
|
|
|
3 |
|
|
|
|
|
|
|
|
|
|
|
|
|
|
|
2 |
|
|
|
|
|
|
|
|
|
|
|
|
|
|
|
1 |
|
|
|
|
|
|
|
|
|
|
|
|
|
|
|
0 |
|
|
|
|
|
|
|
|
|
|
|
|
|
|
|
-1 |
EU-27 |
Canada |
StatesUnited |
Australia |
KoreaSouth |
Mexico |
Japan |
China |
ArabiaSaudi |
India |
Brazil |
Indonesia |
|
|
AfricaSouth |
Russia |
Argentina |
Turkey |
|||||||||||||
|
|
|
|
|
|
In ows |
|
|
Out ows |
|
|
|
|
|
|
(1) Ranked on net outflows.
Source: Eurostat (online data code: bop_fdi_main) and the World Bank (World Development Indicators and Global Development Finance)
24 |
|
The EU in the world 2013 — a statistical portrait |
|
|

|
|
|
Economy and finance |
|
1 |
|
|
Foreign direct investment (FDI) is characterised by investment in new foreign plant/offices, or by the purchase of existing assets that belong to a foreign enterprise. FDI differs from portfolio investment as it is made with the purpose of having control or an effective voice in the management of the direct investment enterprise.
The global financial and economic crisis had a major impact on FDI flows: for example, the EU 27’s FDI inflows and outflows dropped from a peak in 2007 to a low point in 2010; provisional figures for 2011 indicate an upturn in both directions. Among the G20 members FDI outflows exceeded inflows in 2011 in Russia, the EU 27, Canada and the United States, as well as in South Korea and Japan where inflows were negative (indicating disinvestment). Relative to GDP, the highest inflows of FDI were recorded in Saudi Arabia, China (note the data excludes Hong Kong and Macau), Russia, Australia and Brazil, a mixture of emerging markets and resource rich countries.
EU 27 FDI flows are dominated by the United States which accounted for one third of the EU 27’s inward FDI in the period 2008 to 2010 and more than one quarter of its FDI outflows; Canada also accounted for a significant share of EU 27 FDI inflows during these three years. As a whole, G20 countries (excluding Saudi Arabia) accounted for 54.2 % of FDI outflows from the EU 27 between 2008 and 2010 and 57.5 % of its inflows. A large part of the remainder was FDI flows with offshore financial centres (an aggregate composed of 38 financial centres across the world), as well as with developed countries outside of the G20, notably Switzerland.
Figure 1.9: Average flows of foreign direct investment by partner, EU 27, 2008-2010(1)
(% of total)
Out ows of FDI from the EU-27 |
|
Rest |
United |
of the |
|
world |
States |
27.5% |
27.1% |
|
|
|
Russia |
|
|
|
5.2% |
||
O shore |
|
|
Brazil |
|
nancial |
|
|
||
|
4.9% |
|||
centres |
|
|||
|
|
Australia |
||
18.3% |
|
|
||
Other G20 countries |
|
|
3.7% |
|
China |
|
Mexico |
||
8.3% |
|
|
|
|
2.4% |
2.6% |
|||
|
||||
(1) Saudi Arabia, not available.
Source: Eurostat (online data code: bop_fdi_main)
In ows of FDI into the EU-27
Rest |
|
|
|
of the |
|
|
United |
world |
|
|
States |
31.5% |
|
|
33.4% |
O shore |
|
|
|
nancial |
|
|
|
centres |
|
|
|
10.9% |
|
|
Canada |
Other G20 |
|
|
|
|
|
10.9% |
|
countries |
|
|
|
|
|
Russia |
|
3.3% |
|
|
|
|
|
4.2% |
|
|
|
|
|
India |
|
Mexico |
Brazil |
0.9% |
|
1.1% |
3.6% |
|
The EU in the world 2013 — a statistical portrait |
|
25 |
|
1 |
Economy and finance |
|
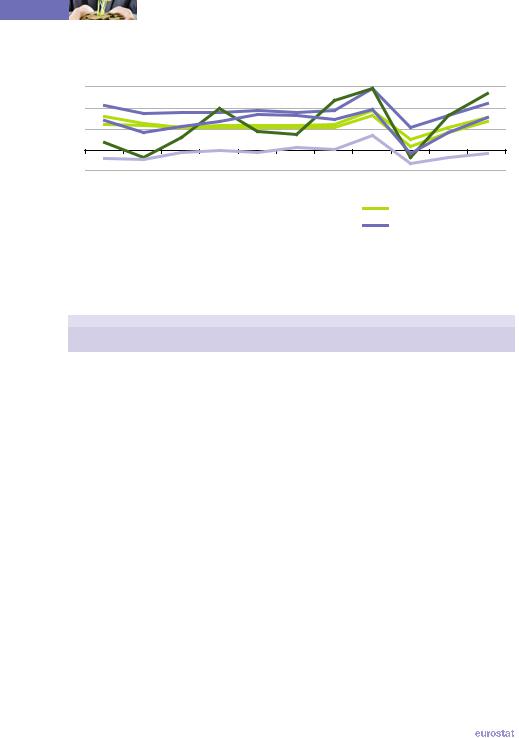
Figure 1.10: Consumer price indices, 2001-2011 |
|
(annual change, %) |
|
6 |
|
4 |
|
2 |
|
0 |
|
-2 |
2001 |
2002 |
2003 |
2004 |
2005 |
2006 |
2007 |
2008 |
2009 |
2010 |
2011 |
||
|
|
|
World |
|
|
|
EU-27 |
|
|
EA-17 |
|
|
|
|
|
|
|
|
|
|
|
|
|||
|
|
|
China |
|
|
|
Japan |
|
|
United States |
|
|
|
|
|
|
|
|
|
|
|
||||
Source: Eurostat (online data code: prc_hicp_aind) and the International Monetary Fund (International Financial Statistics)
Table 1.2: Consumer price indices, 2001-2011
(annual change, %)
|
2001 |
2002 |
2003 |
2004 |
2005 |
2006 |
2007 |
2008 |
2009 |
2010 |
2011 |
EU-27 |
3.2 |
2.5 |
2.1 |
2.3 |
2.3 |
2.3 |
2.4 |
3.7 |
1.0 |
2.1 |
3.1 |
EA-17 |
2.4 |
2.3 |
2.1 |
2.2 |
2.2 |
2.2 |
2.1 |
3.3 |
0.3 |
1.6 |
2.7 |
Argentina |
-1.1 |
25.9 |
13.4 |
4.4 |
9.6 |
10.9 |
8.8 |
8.6 |
6.3 |
10.8 |
9.5 |
Australia |
4.4 |
3.0 |
2.8 |
2.3 |
2.7 |
3.5 |
2.3 |
4.4 |
1.8 |
2.8 |
3.4 |
Brazil |
6.8 |
8.5 |
14.7 |
6.6 |
6.9 |
4.2 |
3.6 |
5.7 |
4.9 |
5.0 |
6.6 |
Canada |
2.5 |
2.3 |
2.8 |
1.9 |
2.2 |
2.0 |
2.1 |
2.4 |
0.3 |
1.8 |
2.9 |
China |
0.7 |
-0.8 |
1.2 |
3.9 |
1.8 |
1.5 |
4.8 |
5.9 |
-0.7 |
3.3 |
5.4 |
India |
3.7 |
4.4 |
3.8 |
3.8 |
4.2 |
6.1 |
6.4 |
8.4 |
10.9 |
12.0 |
8.9 |
Indonesia |
11.5 |
11.9 |
6.6 |
6.2 |
10.5 |
13.1 |
6.4 |
9.8 |
4.8 |
5.1 |
5.4 |
Japan |
-0.8 |
-0.9 |
-0.2 |
0.0 |
-0.3 |
0.2 |
0.1 |
1.4 |
-1.3 |
-0.7 |
-0.3 |
Mexico |
6.4 |
5.0 |
4.5 |
4.7 |
4.0 |
3.6 |
4.0 |
5.1 |
5.3 |
4.2 |
3.4 |
Russia |
21.5 |
15.8 |
13.7 |
10.9 |
12.7 |
9.7 |
9.0 |
14.1 |
11.7 |
6.9 |
8.4 |
Saudi Arabia |
-1.1 |
0.2 |
0.6 |
0.3 |
0.7 |
2.2 |
4.2 |
9.9 |
5.1 |
5.3 |
5.0 |
South Africa |
5.7 |
9.2 |
5.9 |
1.4 |
3.4 |
4.6 |
7.1 |
11.5 |
7.1 |
4.3 |
5.0 |
South Korea |
4.1 |
2.8 |
3.5 |
3.6 |
2.8 |
2.2 |
2.5 |
4.7 |
2.8 |
3.0 |
4.0 |
Turkey |
54.4 |
45.0 |
25.3 |
10.6 |
10.1 |
10.5 |
8.8 |
10.4 |
6.3 |
8.6 |
6.5 |
United States |
2.8 |
1.6 |
2.3 |
2.7 |
3.4 |
3.2 |
2.9 |
3.8 |
-0.4 |
1.6 |
3.2 |
World |
4.2 |
3.5 |
3.6 |
3.6 |
3.7 |
3.6 |
3.8 |
5.8 |
2.2 |
3.3 |
4.4 |
Source: Eurostat (online data code: prc_hicp_aind) and the International Monetary Fund (International Financial Statistics)
26 |
|
The EU in the world 2013 — a statistical portrait |
|
|

|
|
|
Economy and finance |
|
1 |
|
|
Figure 1.10 shows the annual rate of change in consumer price indices for a selection of G20 members and the world between 2001 and 2011. For most of this period Japan recorded negative annual inflation rates, indicating falling consumer prices, a situation that was mirrored in China and the United States in 2009 during the financial and economic crisis. Table 1.2 provides a complete set of annual rates of change in consumer prices for the G20 members over the period 2001 to 2011. Particularly high annual rates of change were recorded in Turkey and Russia, although both countries recorded much lower inflation in the most recent years.
Short-term lending rates varied greatly between the G20 members in 2011, but to a somewhat lesser extent than they had done ten years earlier. Rates were close to zero in the United States and Japan in 2011 but exceeded 10 % in Brazil and Turkey. In nearly all G20 members interest rates were lower in 2011 than they had been in 2001, with the exceptions of Japan where the interest rate rose (but remained close to zero) and China where the interest rate was roughly the same in both years presented.
Among the countries shown in Table 1.3, the currencies of Turkey and Mexico devalued the most between 2001 and 2011 relative to the euro. By contrast, the Australian dollar appreciated relative to the euro between these two years while exchange rates for the Canadian dollar and Japanese yen (relative to the euro) were relatively unchanged.
Table 1.3: Interest rates and exchange rates, 2001 and 2011
|
Central bank: |
Exchange rates |
Exchange rates |
|||
|
short-term official |
|||||
|
(1 EUR=… national currency) |
(1 USD=...) |
||||
|
lending rates (%) |
|||||
|
|
|
|
|
||
|
2001 |
2011 |
2001 |
2011 |
2001 |
2011 |
EA-17 |
4.25 |
1.75 |
- |
- |
1.1175 |
0.7194 |
United Kingdom |
4.00 |
0.50 |
0.6219 |
0.8679 |
0.6947 |
0.6241 |
Argentina |
24.90 |
9.98 |
: |
: |
0.9995 |
4.1101 |
Australia |
5.06 |
4.69 |
1.7319 |
1.3484 |
1.9334 |
0.9695 |
Brazil |
19.00 |
11.00 |
2.1069 |
2.3265 |
2.3496 |
1.6728 |
Canada |
2.50 |
1.25 |
1.3864 |
1.3761 |
1.5488 |
0.9895 |
China |
3.24 |
3.25 |
7.4131 |
8.9960 |
8.2771 |
6.4615 |
India |
6.50 |
6.00 |
42.2471 |
64.8859 |
47.1864 |
46.6705 |
Indonesia |
17.62 |
6.00 |
9 167.71 |
12 206.51 |
10 260.9 |
8 770.4 |
Japan |
0.10 |
0.30 |
108.68 |
110.96 |
121.53 |
79.81 |
Mexico |
12.89 |
4.82 |
8.3710 |
17.2877 |
9.3423 |
12.4233 |
Russia |
25.00 |
8.00 |
26.1510 |
40.8846 |
29.1685 |
29.3823 |
Saudi Arabia |
2.25 |
0.25 |
: |
: |
3.7500 |
3.7500 |
South Africa |
9.50 |
5.50 |
7.6873 |
10.0970 |
8.6092 |
7.2611 |
South Korea |
2.50 |
1.50 |
1 154.83 |
1 541.23 |
1 290.99 |
1 108.29 |
Turkey |
60.00 |
17.00 |
1.1024 |
2.3378 |
1.2256 |
1.6750 |
United States |
1.75 |
0.13 |
0.8956 |
1.3920 |
- |
- |
Source: Eurostat (online data codes: irt_cb_a and ert_bil_eur_a), the International Monetary Fund (International Financial Statistics) and the World Bank (World Development Indicators and Global Development Finance)
|
The EU in the world 2013 — a statistical portrait |
|
27 |
|