


Science and technology
Practical applications of science are integrated in almost every moment of our lives, for example in household appliances, transport and communications equipment, medicine and health equipment. Research and development (R & D) and innovation underlie such applications and are often considered as some of the primary driving forces behind economic growth and job creation.
Main findings
R & D includes creative work carried out on a systematic basis in order to increase the stock of knowledge of man, culture and society, and the use of this knowledge to devise new applications. Gross domestic expenditure on research and development (GERD) is a key measure of the level of R & D activity and encompasses expenditures in the following sectors: business, higher education institutions, government and non-profit organisations; it includes R & D that is funded from abroad, but excludes payments made abroad.
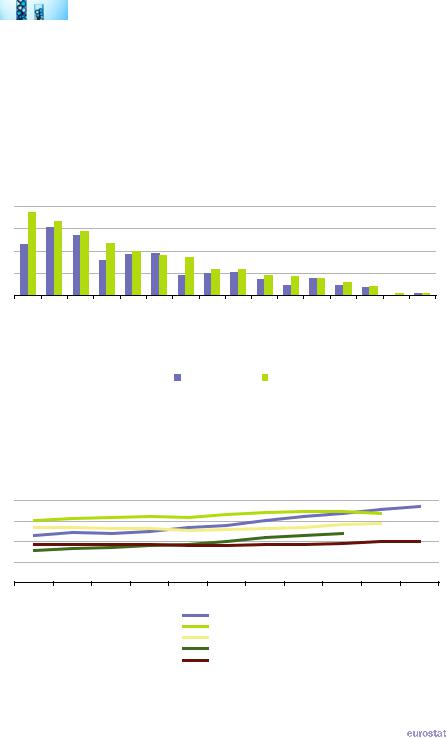
GERD in the EU 27 was provisionally estimated at around EUR 245.7 billion in 2010. The relation between the level of GERD and gross domestic product (GDP) is known as R & D intensity, and in 2010 this ratio stood at 2.00 % in the EU 27. According to the United Nations Educational, Scientific and Cultural Organisation (UNESCO), by far the highest R & D intensity among the G20 members was in South Korea, where GERD was equivalent to 3.74 % of GDP in 2010. The latest data (2008 or 2009) for Japan, the United States and Australia shows that they also recorded relatively high R & D intensities. By contrast, Saudi Arabia and Indonesia recorded by far the lowest R & D intensities among the G20 members, with GERD of less than 0.1 % of GDP.
R & D intensity was higher in 2010 than in 2000 in nearly all G20 members (see Figure 13.1)
– with only a small decline in Canada. The largest increase (in percentage point terms) in R & D intensity between 2000 and 2010 was in South Korea, with relatively large increases also recorded in Australia and China.
|
The EU in the world 2013 — a statistical portrait |
|
127 |
|
|
|
|
13 |
|
Science and technology |
|
|
The increase in R & D intensity in the EU 27 came mainly in recent years, as this indicator remained relatively unchanged between 2000 and 2007. Despite the financial and economic crisis there was an increase in 2008 and 2009 in the EU 27’s R & D intensity: in 2008 this was due to a 4.5 % increase in GERD outstripping GDP growth (0.6 % in current prices), while the fall in GERD (-1.2 %) in 2009 was less than the sizeable contraction of GDP (-5.8 %) in that year. Figure 13.2 shows the upward development of R & D intensity over the last ten years in the five G20 members with the highest R & D intensities.
Figure 13.1: Gross domestic expenditure on research and development relative to GDP, 2000 and 2010
(% of GDP)
4 |
|
|
|
|
|
|
|
|
|
|
|
|
|
|
|
3 |
|
|
|
|
|
|
|
|
|
|
|
|
|
|
|
2 |
|
|
|
|
|
|
|
|
|
|
|
|
|
|
|
1 |
|
|
|
|
|
|
|
|
|
|
|
|
|
|
|
0 |
|
|
|
|
|
|
|
|
|
|
|
|
|
|
|
(KoreaSouth1)(2) |
(Japan1)(3) |
(StatesUnited3)(4) |
(Australia5) |
EU-(276) |
(Canada7) |
(China8) |
Brazil |
Russia |
(AfricaSouth5)(8) |
Turkey |
(India9) |
(Argentina3) |
(Mexico1)(3) |
(ArabiaSaudi3)(10)(11) |
(Indonesia1)(3)(11) |
|
|
|
|
|
|
2000 |
|
|
|
2010 |
|
|
|
|
|
(1) Break in series. (2) 2000, incomplete (3) Data for 2009 instead of 2010. (4) Excluding most or all capital expenditure. (5) Data for 2008 |
|||||||||||||||
instead of 2010. (6) Estimates. (7) 2010, provisional. (8) Data for 2001 instead of 2000, underestimate. (9) Data for 2007 instead of 2010, |
|||||||||||||||
estimate. (10) Data for 2003 instead of 2000. (11) Partial data. |
|
|
|
|
|
|
|
|
|
||||||
Source: Eurostat (online data code: rd_e_gerdtot) and the United Nations Educational, Scientific and Cultural Organisation (UIS: Science & Technology)
Figure 13.2: Gross domestic expenditure on research and development relative to GDP, 2000-2010
(% of GDP)
4
3
2
1
0
2000 |
2001 |
2002 |
2003 |
2004 |
2005 |
2006 |
2007 |
2008 |
2009 |
2010 |
South Korea (1)
Japan (2)
United States (3)
Australia (4)
EU-27 (5)
(1) 2000-2006, excluding social sciences and humanities. (2) 2008, break in series. (3) Excluding most or all capital expenditure. (4) Data available for even years only. (5) Estimates.
Source: Eurostat (online data code: rd_e_gerdtot) and the United Nations Educational, Scientific and Cultural Organisation (UIS: Science & Technology)
128 |
|
The EU in the world 2013 — a statistical portrait |
|
|
|
|
|
Science and technology |
|
13 |
|
|
An alternative analysis of R & D expenditure can be seen in Figure 13.3, namely the level of GERD relative to population size. This indicator provides a very clear distinction between G20 members; note that the data for non-member countries are also sourced from UNESCO. Japan and the United States stand out with GERD per inhabitant close to EUR 1 000 in 2009. Australia, Canada, South Korea and the EU 27 completed the group of countries with relatively high GERD per inhabitant. None of the other G20 members recorded GERD in excess of EUR 100 per inhabitant and this indicator dropped below EUR 10 per inhabitant in Saudi Arabia, India and Indonesia.
Figure 13.3: Gross domestic expenditure on research and development per inhabitant, 2010
(EUR per inhabitant)
1 000 |
|
|
|
|
|
|
|
|
|
|
|
|
|
|
|
750 |
|
|
|
|
|
|
|
|
|
|
|
|
|
|
|
500 |
|
|
|
|
|
|
|
|
|
|
|
|
|
|
|
250 |
|
|
|
|
|
|
|
|
|
|
|
|
|
|
|
0 |
|
|
|
|
|
|
|
|
|
|
|
|
|
|
|
(Japan1) |
(StatesUnited1)(2) |
(Australia3) |
(Canada4) |
KoreaSouth |
EU-(275) |
Brazil |
Russia |
Turkey |
(China1) |
(AfricaSouth3) |
(Argentina1) |
(Mexico1) |
(ArabiaSaudi1)(6) |
(India7) |
(Indonesia1)(6) |
(1) 2009. (2) Excluding most or all capital expenditure. (3) 2008. (4) Provisional. (5) Estimate. (6) Partial data. (7) 2007, estimate. |
|
|
|||||||||||||
Source: Eurostat (online data code: rd_e_gerdtot) and the United Nations Educational, Scientific and Cultural Organisation (UIS: Science & Technology and Demographic & Socio-economic)
Table 13.1: Gross domestic expenditure on research and development (GERD), analysis by sector of performance, 2010
|
Total GERD |
|
Analysis by sector of performance (% of GERD) |
|
|||
|
(% of GDP) |
Business |
|
Government |
Higher |
|
Private |
|
enterprise |
|
education |
|
non-profit |
||
|
|
|
|
|
|||
EU-27 |
2.00 |
61.5 |
|
13.3 |
24.2 |
|
1.0 |
Argentina (1) |
0.60 |
22.3 |
|
44.7 |
31.3 |
|
1.7 |
Australia (2) |
2.37 |
61.3 |
|
12.2 |
23.9 |
|
2.6 |
Brazil |
1.19 |
: |
|
: |
: |
|
: |
Canada |
1.80 |
50.7 |
|
10.5 |
38.2 |
|
0.6 |
China (1) |
1.70 |
73.2 |
|
18.7 |
8.1 |
|
: |
India (3) |
0.76 |
33.9 |
|
61.7 |
4.4 |
|
: |
Indonesia (1)(4) |
0.08 |
: |
|
: |
37.9 |
|
: |
Japan (1) |
3.36 |
75.8 |
|
9.2 |
13.4 |
|
1.6 |
Mexico (1) |
0.40 |
44.2 |
|
24.6 |
28.4 |
|
2.8 |
Russia |
1.16 |
60.5 |
|
31.0 |
8.4 |
|
0.2 |
Saudi Arabia (1)(4) |
0.08 |
: |
|
: |
: |
|
: |
South Africa (2) |
0.93 |
58.6 |
|
20.3 |
19.9 |
|
1.1 |
South Korea |
3.74 |
74.8 |
|
12.7 |
10.8 |
|
1.7 |
Turkey |
0.84 |
42.5 |
|
11.4 |
46.0 |
|
: |
United States (1)(5) |
2.86 |
70.3 |
|
11.7 |
13.5 |
|
4.4 |
(1) 2009. (2) 2008. (3) 2007; data for the business enterprise sector includes the data for the private non-profit sector. (4) Partial data. (5) Excluding most or all capital expenditure; government includes central or federal government only.
Source: Eurostat (online data code: rd_e_gerdtot) and the United Nations Educational, Scientific and Cultural Organisation (UIS: Science & Technology)
|
The EU in the world 2013 — a statistical portrait |
|
129 |
|

|
|
|
13 |
|
Science and technology |
|
|
More than three fifths (61.5 %) of all R & D in the EU 27 was performed in the business enterprise sector; more than half of total R & D was performed in the business enterprise sector in most G20 members (see Table 13.1) although the share was lower in Mexico, Turkey, India and Argentina. The government sector was the dominant performing sector in India (61.7 % of total R & D) and Argentina (44.7 %), otherwise this sector performed less than one third of R & D. The higher education sector was the largest R & D performing sector in Turkey (46.0 % of the total) and exceeded one third of the total in Canada and Indonesia. Private non-profit organisations performed the smallest share of R & D in all G20 members (with data available), reaching its highest share (4.4 %) in the United States.
The relative shares of R & D performance were quite different from the mix in terms of the sources of funds (see Table 13.2). The major difference concerned the relatively small share of funds provided by higher education institutions and the high share provided by the government sector; in other words, the R & D performed in higher education institutions was often financed by funds from other sectors, while the government sector financed far more R & D than it performed. For the business enterprise sector the shares of R & D performance and funding were relatively close in most G20 members, with the main exceptions being Russia and South Africa. Foreign financing for R & D was relatively important in South Africa where it exceeded one tenth of all financing, and to a lesser extent in the EU 27 (including intra-EU cross-border funds) and Canada.
Table 13.2: Analysis of gross domestic expenditure on research and development by source of funds, 2010
(%)
|
Business |
Government |
Higher |
Private |
Abroad |
|
enterprise |
education |
non-profit |
||
|
|
|
|||
EU-27 (1)(2) |
54.1 |
34.9 |
1.0 |
1.6 |
8.4 |
Argentina (1) |
21.4 |
73.2 |
3.8 |
0.8 |
0.7 |
Australia (3) |
62.0 |
34.5 |
0.1 |
1.8 |
1.6 |
Brazil |
45.4 |
52.7 |
1.9 |
: |
: |
Canada (4) |
46.8 |
34.1 |
7.1 |
3.5 |
6.8 |
China (1) |
71.7 |
23.4 |
: |
: |
1.3 |
India (5) |
33.9 |
66.1 |
0.0 |
: |
: |
Indonesia |
: |
: |
: |
: |
: |
Japan (1) |
75.3 |
17.7 |
5.9 |
0.7 |
0.4 |
Mexico (1) |
43.2 |
46.9 |
6.4 |
1.6 |
1.9 |
Russia |
25.5 |
70.3 |
0.5 |
0.1 |
3.5 |
Saudi Arabia |
: |
: |
: |
: |
: |
South Africa (3) |
42.6 |
45.1 |
0.1 |
0.7 |
11.4 |
South Korea |
71.8 |
26.7 |
0.9 |
0.4 |
0.2 |
Turkey |
45.1 |
30.8 |
19.6 |
3.7 |
0.8 |
United States (1)(6) |
61.6 |
31.3 |
3.8 |
3.4 |
: |
(1) 2009.
(2) Abroad includes cross-border funding between Member States within the EU 27. (3) 2008.
(4) Government and higher education, 2008.
(5) 2007; data for the business enterprise sector includes the data for the private non-profit sector; overestimated.
(6) Excluding most or all capital expenditure; government includes central or federal government only; abroad is included in other headings.
Source: Eurostat (online data code: rd_e_fundgerd) and the United Nations Educational, Scientific and Cultural Organisation (UIS: Science & Technology)
130 |
|
The EU in the world 2013 — a statistical portrait |
|
|

|
|
|
Science and technology |
|
13 |
|
|
R & D personnel include all individuals employed directly in the field of R & D, covering not only researchers, but also technicians and equivalent staff as well as supporting staff. The number of people working in R & D in 2009 in the EU 27 was around 3.6 million; when converted into full-time equivalents the number of R & D personnel in 2010 was 2.5 million, of whom approximately one third were women. Among the other G20 members with data available (see Table 13.3) China had the next largest R & D workforce (3.2 million), followed by Japan and Russia – note that the Russian head count data is an underestimate and the data in full-time equivalents shows that the R & D personnel input in Russia was close to that in Japan.
The sectoral division of R & D personnel was broadly similar to that for the analysis of the sectoral performance of R & D expenditure; the main difference was that the share of personnel in higher education institutions was generally larger than the equivalent share of R & D expenditure with the reverse situation in the business enterprise sector. Canada was a notable exception to this rule, with nearly two thirds of its R & D personnel in the business enterprise sector that was responsible for about half of its R & D expenditure.
Table 13.3: Research and development personnel, 2010
|
|
Total |
Sectoral share in total based on full-time equivalents |
|||||
|
(number) |
|
|
(%) |
|
|||
|
Head count |
Full-time |
Business |
Government |
|
Higher |
Private |
|
|
equivalents |
enterprise |
|
education |
non-profit |
|||
|
|
|
|
|
||||
EU-27 (1) |
3 643 115 |
|
2 486 743 |
51.5 |
14.1 |
|
33.3 |
1.2 |
Argentina (2) |
83 211 |
|
59 683 |
14.0 |
48.7 |
|
35.0 |
2.3 |
Australia (3) |
: |
|
137 138 |
39.4 |
12.4 |
|
44.7 |
3.5 |
Brazil |
466 451 |
|
265 246 |
20.9 |
5.3 |
|
73.2 |
0.6 |
Canada (3) |
: |
|
242 686 |
65.5 |
8.0 |
|
25.7 |
0.8 |
China (2) |
3 183 687 |
|
2 291 252 |
71.9 |
16.1 |
|
12.0 |
: |
India |
: |
|
: |
: |
: |
|
: |
: |
Indonesia |
: |
|
: |
: |
: |
|
: |
: |
Japan (2) |
1 152 787 |
|
878 418 |
70.2 |
7.2 |
|
21.1 |
1.5 |
Mexico (4) |
: |
|
83 642 |
48.9 |
20.3 |
|
28.3 |
2.5 |
Russia (5) |
736 540 |
|
839 992 |
52.9 |
33.4 |
|
13.5 |
0.2 |
Saudi Arabia |
: |
|
: |
: |
: |
|
: |
: |
South Africa (3) |
58 895 |
|
30 802 |
40.6 |
22.0 |
|
36.3 |
1.2 |
South Korea |
500 124 |
|
335 228 |
68.7 |
8.0 |
|
21.9 |
1.4 |
Turkey (6) |
147 417 |
|
81 792 |
45.9 |
13.9 |
|
40.2 |
: |
United States |
: |
|
: |
: |
: |
|
: |
: |
(1) Head count, 2009; other data, 2010. (2) 2009.
(3) 2008.
(4) Full-time eqivalents total, 2009; other data, 2007. (5) Head count, underestimated.
(6) Data in full-time equivalents, underestimated.
Source: Eurostat (online data code: rd_p_persocc) and the United Nations Educational, Scientific and Cultural Organisation (UIS: Science & Technology)
|
The EU in the world 2013 — a statistical portrait |
|
131 |
|

|
|
|
13 |
|
Science and technology |
|
|
Table 13.4 provides a similar analysis to that in Table 13.3, but focuses on the core occupation of researchers, in other words professionals engaged in the conception or creation of new knowledge, products, processes, methods and systems; persons involved in project management are also included. The number of researchers in 2009 in the EU 27 was around 2.3 million or 1.6 million (2010 data) in terms of full-time equivalents. The number of researchers in the United States (also in full-time equivalents) was about 10 % below that in the EU 27, while in China the number was around 25 % lower.
Combining the information in Tables 13.3 and 13.4 it can be seen that about half the R & D personnel in China were researchers, a share that reached three quarters in Japan and four fifths in South Korea and Turkey; in the EU 27 the share was 63 %. Generally the share of researchers that were in higher education institutions was higher than the equivalent share for all R & D personnel – notable examples include South Africa, Australia and Mexico – while South Korea, Brazil and Japan were the only exceptions.
Table 13.4: Researchers, 2010
|
|
Total |
Sectoral share in total based on full-time equivalents |
|||||
|
(number) |
|
|
(%) |
|
|||
|
Head count |
Full-time |
Business |
Government |
|
Higher |
Private |
|
|
equivalents |
enterprise |
|
education |
non-profit |
|||
|
|
|
|
|
||||
EU-27 (1) |
2 318 518 |
|
1 564 770 |
45.3 |
12.7 |
|
40.9 |
1.1 |
Argentina (2) |
67 245 |
|
43 717 |
9.6 |
45.9 |
|
42.8 |
1.6 |
Australia (3) |
: |
|
92 379 |
30.0 |
9.0 |
|
57.7 |
3.3 |
Brazil |
231 910 |
|
137 187 |
26.2 |
5.6 |
|
67.5 |
0.7 |
Canada (3) |
: |
|
148 983 |
60.6 |
6.0 |
|
33.1 |
0.3 |
China (2) |
: |
|
1 152 311 |
61.4 |
19.0 |
|
19.5 |
: |
India |
: |
|
: |
: |
: |
|
: |
: |
Indonesia (4) |
41 143 |
|
21 275 |
: |
: |
|
35.1 |
: |
Japan (2) |
889 341 |
|
655 530 |
74.8 |
5.0 |
|
19.0 |
1.2 |
Mexico (2) |
: |
|
42 973 |
37.7 |
19.3 |
|
40.4 |
2.6 |
Russia (5) |
368 915 |
|
442 071 |
47.8 |
32.8 |
|
19.1 |
0.3 |
Saudi Arabia (6) |
1 271 |
|
: |
: |
: |
|
: |
: |
South Africa (3) |
39 955 |
|
19 384 |
31.8 |
15.7 |
|
51.3 |
1.1 |
South Korea |
345 912 |
|
264 118 |
76.5 |
7.5 |
|
14.9 |
1.1 |
Turkey (7) |
124 796 |
|
64 341 |
39.4 |
9.5 |
|
51.2 |
: |
United States (8) |
: |
|
1 412 639 |
80.0 |
: |
|
: |
: |
(1) Head count, 2009. (2) 2009. (3) 2008. (4) 2009; partial data. (5) Head count, underestimated. (6) Government only, partial data, 2009. (7) Data for higher education shows the number of graduates. (8) 2007.
Source: Eurostat (online data code: rd_p_persocc) and the United Nations Educational, Scientific and Cultural Organisation (UIS: Science & Technology)
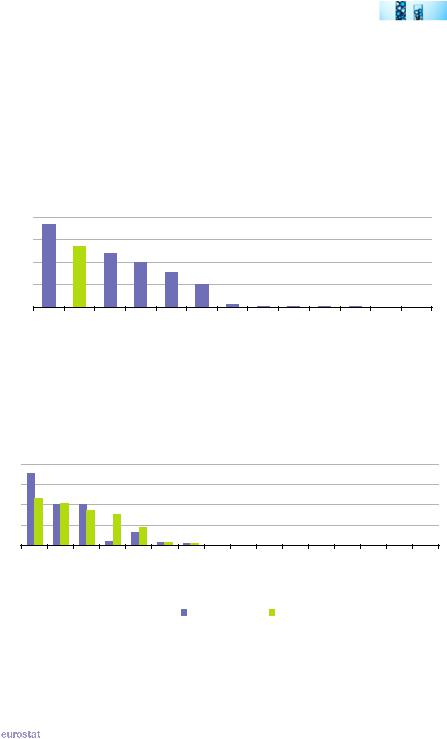
As well as offering protection, patents result in inventions becoming public and can be seen as an important source for providing technical information. The statistics for patent applications to the European Patent Office (EPO) (see Figure 13.4) refer to applications filed in a particular year, regardless of whether the patent was granted or not. Patent applications are assigned to a country based on the inventor’s place of residence. There is a high propensity to make use of patents in Japan, the United States and South Korea within their national economies and further afield. Indeed, there were more patent applications per inhabitant to the EPO made from Japan than there were from within the EU 27.
132 |
|
The EU in the world 2013 — a statistical portrait |
|
|
|
|
|
Science and technology |
|
13 |
|
|
The UN’s World Intellectual Property Organisation provides estimates for global patent applications and estimates that around 2 million patent applications were made in 2010, of which 62 % were filed by residents. Japan’s share of patent applications fell between 2000 and 2010 by 12.3 percentage points but Japan remained at the top of the ranking by country of origin with 23.3 % of all patent applications worldwide. Over the same period China’s share of patent applications increased by 13.6 percentage points to move to fourth place with 15.5 % of all patent applications, behind the EU 27 (17.6 %), the United States (21.0 %) and Japan, while South Korea’s share also increased substantially (up 2.8 percentage points).
Figure 13.4: Patent applications to the European patent office, 2008 (1)
(number per million inhabitants)
160 |
|
|
|
|
|
|
|
|
|
|
|
|
120 |
|
|
|
|
|
|
|
|
|
|
|
|
80 |
|
|
|
|
|
|
|
|
|
|
|
|
40 |
|
|
|
|
|
|
|
|
|
|
|
|
0 |
|
|
|
|
|
|
|
|
|
|
|
|
Japan |
EU-(272) |
StatesUnited |
KoreaSouth |
Canada |
Australia |
(Turkey2) |
SouthAfrica |
China |
Russia(2) |
Brazil |
Mexico |
India(3) |
(1) Argentina, Indonesia and Saudi Arabia, not available. |
|
|
|
|
|
|
|
|
||||
(2) 2010, estimate. |
|
|
|
|
|
|
|
|
|
|
|
|
(3) 2007. |
|
|
|
|
|
|
|
|
|
|
|
|
Source: Eurostat (online data code: pat_ep_ntot) |
|
|
|
|
|
|
|
|
||||
Figure 13.5: Share of world patent applications, 2000 and 2010(1)
(%) |
|
|
|
|
|
|
|
|
|
|
|
|
|
|
|
40 |
|
|
|
|
|
|
|
|
|
|
|
|
|
|
|
30 |
|
|
|
|
|
|
|
|
|
|
|
|
|
|
|
20 |
|
|
|
|
|
|
|
|
|
|
|
|
|
|
|
10 |
|
|
|
|
|
|
|
|
|
|
|
|
|
|
|
0 |
|
|
|
|
|
|
|
|
|
|
|
|
|
|
|
Japan |
StatesUnited |
EU-27 (2) |
China |
KoreaSouth |
Russia |
Canada |
Australia |
India |
Brazil |
SouthAfrica |
Mexico |
SaudiArabia |
Turkey |
Argentina |
Indonesia |
|
|
|
|
|
|
2000 |
|
|
|
2010 |
|
|
|
|
|
(1) Estimates; country of origin based on the residence of the first-named applicant (or assignee). |
|
|
|
|
|||||||||||
(2) Sum of data for the 27 EU Member States. |
|
|
|
|
|
|
|
|
|
|
|
||||
Source: the World Intellectual Property Organisation |
|
|
|
|
|
|
|
|
|
||||||
|
The EU in the world 2013 — a statistical portrait |
|
133 |
|