Population
As a population grows or contracts its structure changes. In many developed economies the population’s age structure has become older as post-war baby-boom generations reach retirement age. Furthermore, many countries have experienced a general increase in life expectancy combined with a fall in fertility, in some cases to a level below that necessary to keep the size of the population constant in the absence of migration. If sustained over a lengthy period, these changes can pose considerable challenges associated with an ageing society which impact on a range of policy areas, including labour markets, pensions and the provision of healthcare, housing and social services.
Main findings
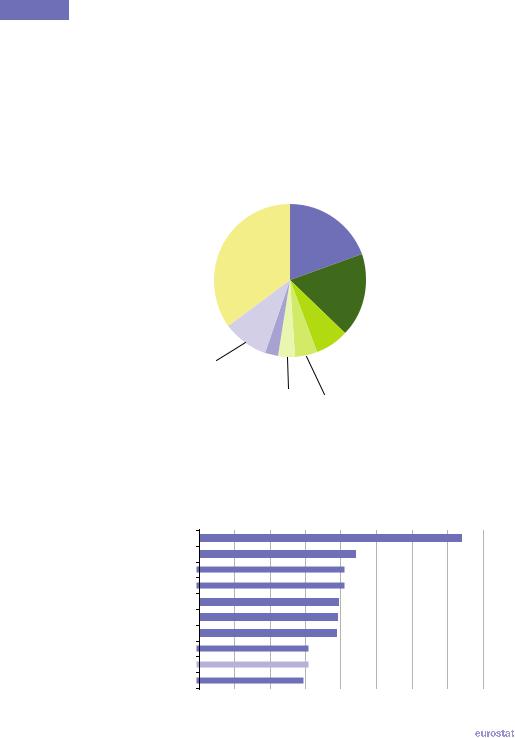
The world’s population was approaching 7 000 million inhabitants at the beginning of 2010 and continues to grow. Although all members of the G20 recorded higher population levels in 2010 than 50 years before, between 1960 and 2010 the share of the world’s population living in G20 members fell from 73.5 % to 65.1 %. Russia recorded the smallest overall population increase (19.2 %) during these 50 years, while the fastest population growth was recorded in Saudi Arabia, with a near seven-fold increase. The most populous countries in the world in 2010 were China and India, together accounting for 37.2 % of the world’s population (see Figure 2.1 and Table 2.1) and 57.1 % of the population in the G20 members. The population of the EU 27 at the beginning of 2010 was 501.1 million inhabitants, 7.3 % of the world’s total.
The most densely populated members within the G20 were also in Asia, namely South Korea, India and Japan – each with more than 300 inhabitants per km², followed by China and Indonesia and then the EU 27 with more than 100 inhabitants per km².
Nine of the ten largest urban agglomerations in the world in 2011 were in G20 members, with Dhaka (Bangladesh) the only exception – see Figure 2.2. Including Dhaka, seven of the ten largest urban agglomerations were in Asia, with Mexico City, New York-Newark (United States) and São Paulo (Brazil) completing the list. Worldwide, there were more than 630 urban agglomerations with a population in excess of 750 000 inhabitants and together their population of 1.5 billion people was equivalent to just over one fifth of the world’s population.
|
The EU in the world 2013 — a statistical portrait |
|
29 |
|
2  Population
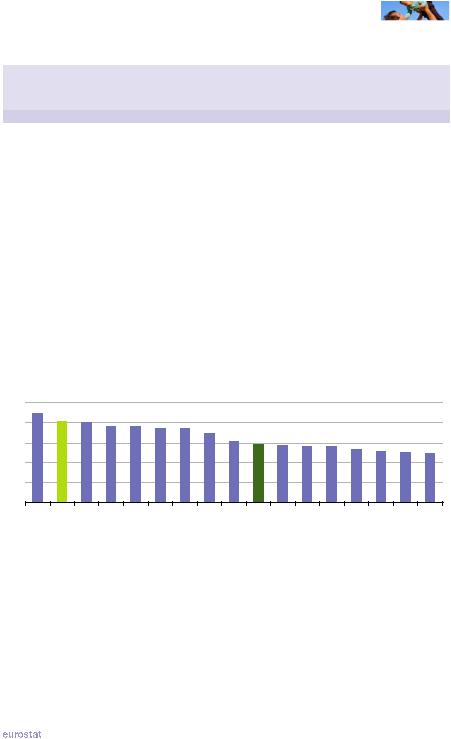
The median age of the world’s population in 2010 was 29.2 years. In China, the United States, Australia, South Korea and Russia the median age was at least five years higher than the world average, while in Canada and the EU 27 the median age was more than ten years higher, and in Japan it was more than 15 years above the world average – see Figure 2.3. More information on the age structures of G20 members is presented in Table 2.2, while some of the factors influencing this structure are presented in the rest of this chapter and Chapter 3, including life expectancy, fertility and migration.
Figure 2.1: Share of world population, 2010
(%)
|
|
|
|
|
China |
|
|
|
|
19.5% |
|
Rest of the world |
|
|
|
||
34.9% |
|
|
|
|
|
|
|
|
|
|
India |
|
|
|
|
17.8% |
|
Remaining |
|
|
EU-27 (1) |
||
G20 countries (2) |
|
|
Brazil |
7.3% |
|
|
|||||
9.8% |
|
|
|
|
|
|
|
2.8% |
|
United |
|
|
|
|
|
||
|
|
|
|
|
|
|
|
|
Indonesia |
|
States |
|
|
|
|
||
|
|
|
3.5% |
4.5% |
|
(1) Provisional.
(2) Russia, Japan, Mexico, Turkey, South Africa, South Korea, Argentina, Canada, Saudi Arabia and Australia.
Source: Eurostat (online data code: demo_gind) and the United Nations Department of Economic and Social Affairs (World Population Prospects: the 2010 Revision)
Figure 2.2: Ten largest urban agglomerations in the world, 2011
(million inhabitants)
0 |
5 |
10 |
15 |
20 |
25 |
30 |
35 |
40 |
Tokyo (Japan)
Delhi (India)
Mexico City (Mexico)
New York-Newark (United States)
São Paulo (Brazil)
Shanghai (China)
Mumbai (India)
Beijing (China)
Dhaka (Bangladesh)
Calcutta (India)
Source: United Nations, Department of Economic and Social Affairs (World Urbanisation Prospects: the 2011 Revision)
30 |
|
The EU in the world 2013 — a statistical portrait |
|
|
|
|
|
|
|
|
|
|
|
|
|
|
|
|
|
|
|
|
|
|
Population |
|
|
2 |
||
Table 2.1: Main indicators for population, 1960 and 2010 |
|
|
|
|||||||||
|
|
|
|
|
|
|||||||
|
|
|
|
|
|
|
|
|
||||
|
Population |
Share in world |
|
Population density |
|
|||||||
|
|
population |
|
(inhabitants |
||||||||
|
|
(million) |
|
|
||||||||
|
|
|
(% of total) |
|
|
per km²) |
||||||
|
|
|
|
|
|
|
||||||
|
1960 |
|
2010 |
1960 |
|
2010 |
|
1960 |
|
2010 |
|
|
EU-27 (1) |
402.6 |
|
501.1 |
13.3 |
|
7.3 |
|
93.7 |
|
116.6 |
|
|
Argentina |
20.6 |
|
40.4 |
0.7 |
|
0.6 |
|
7.4 |
|
14.5 |
|
|
Australia |
10.3 |
|
22.3 |
0.3 |
|
0.3 |
|
1.3 |
|
2.9 |
|
|
Brazil |
72.8 |
|
194.9 |
2.4 |
|
2.8 |
|
8.5 |
|
22.9 |
|
|
Canada |
17.9 |
|
34.0 |
0.6 |
|
0.5 |
|
1.8 |
|
3.4 |
|
|
China |
658.3 |
|
1 341.3 |
21.7 |
|
19.5 |
|
68.6 |
|
139.8 |
|
|
India |
447.8 |
|
1 224.6 |
14.7 |
|
17.8 |
|
136.2 |
|
372.5 |
|
|
Indonesia |
91.9 |
|
239.9 |
3.0 |
|
3.5 |
|
48.3 |
|
125.9 |
|
|
Japan |
92.5 |
|
126.5 |
3.0 |
|
1.8 |
|
244.8 |
|
334.9 |
|
|
Mexico |
38.4 |
|
113.4 |
1.3 |
|
1.6 |
|
19.6 |
|
57.9 |
|
|
Russia |
119.9 |
|
143.0 |
3.9 |
|
2.1 |
|
7.0 |
|
8.4 |
|
|
Saudi Arabia |
4.0 |
|
27.4 |
0.1 |
|
0.4 |
|
1.9 |
|
12.8 |
|
|
South Africa |
17.4 |
|
50.1 |
0.6 |
|
0.7 |
|
14.2 |
|
41.1 |
|
|
South Korea |
25.1 |
|
48.2 |
0.8 |
|
0.7 |
|
251.9 |
|
484.1 |
|
|
Turkey |
28.2 |
|
72.8 |
0.9 |
|
1.1 |
|
35.9 |
|
92.8 |
|
|
United States |
186.3 |
|
310.4 |
6.1 |
|
4.5 |
|
19.4 |
|
32.2 |
|
|
World |
3 038.4 |
|
6 895.9 |
100.0 |
|
100.0 |
|
22.3 |
|
50.6 |
|
|
(1) 1960, excluding French overseas departments and territories.
Source: Eurostat (online data codes: demo_gind and tps00003) and the United Nations Department of Economic and Social Affairs (World Population Prospects: the 2010 Revision)
Figure 2.3: Median age of the population, 2010
(years) |
|
|
|
|
|
|
|
|
|
|
|
|
|
|
|
|
50 |
|
|
|
|
|
|
|
|
|
|
|
|
|
|
|
|
40 |
|
|
|
|
|
|
|
|
|
|
|
|
|
|
|
|
30 |
|
|
|
|
|
|
|
|
|
|
|
|
|
|
|
|
20 |
|
|
|
|
|
|
|
|
|
|
|
|
|
|
|
|
10 |
|
|
|
|
|
|
|
|
|
|
|
|
|
|
|
|
0 |
|
|
|
|
|
|
|
|
|
|
|
|
|
|
|
|
Japan |
EU-27 |
Canada |
Russia |
KoreaSouth |
Australia |
StatesUnited |
China |
Argentina |
World |
Brazil |
Turkey |
Indonesia |
Mexico |
ArabiaSaudi |
India |
AfricaSouth |
Source: Eurostat (online data code: demo_pjanind) and the United Nations Department of Economic and Social Affairs (World Population Prospects: the 2010 Revision)
|
The EU in the world 2013 — a statistical portrait |
|
31 |
|
2  Population
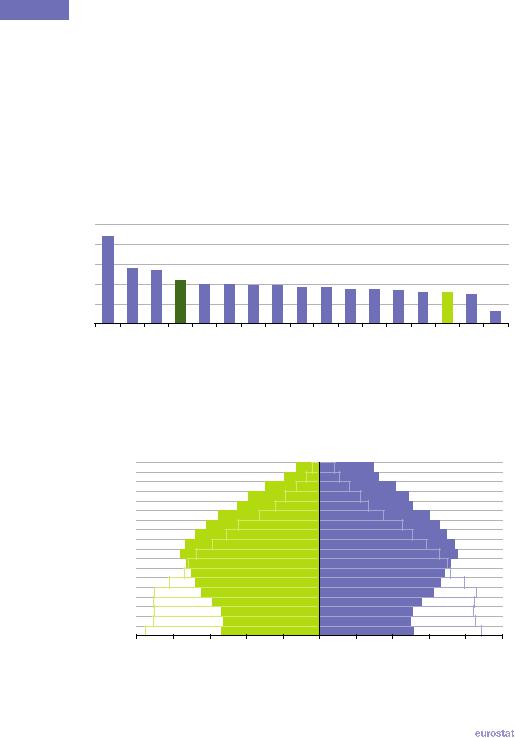
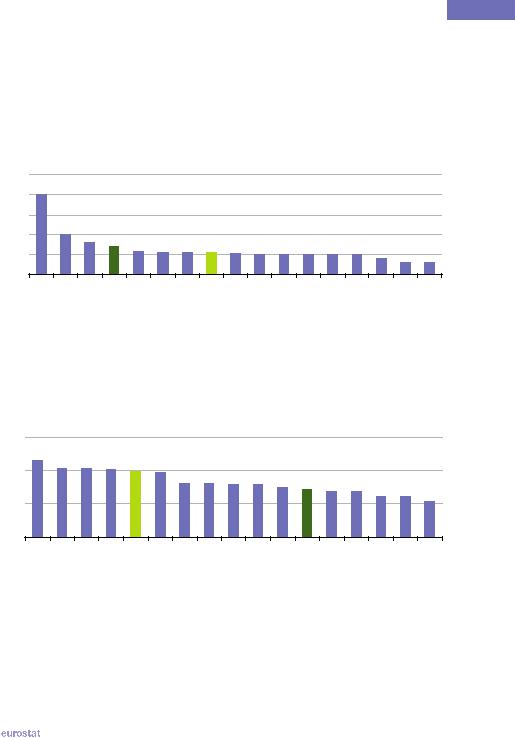
In the majority of G20 members the number of men and women in the population is relatively balanced, although women often account for a slight majority of the population reflecting among other factors women’s higher life expectancy. The number of men per 100 women ranged from 86.1 in Russia to 124.0 in Saudi Arabia. Within this range, there were 101.7 men per 100 women across the whole of the world and 95.4 men per 100 women in the EU 27 (see Figure 2.4). The particularly high ratio in Saudi Arabia is concentrated in the adult working age population (aged 15-64 years), with ratios more balanced for persons aged less than 15 or 65 and over; as such, the overall imbalance may reflect, in part, a gender imbalance among immigrants that have fuelled a rapid increase in population levels during recent decades.
Figure 2.4: Ratio of men to women in the population, 2010(1)
(men per 100 women)
130 |
|
|
|
|
|
|
|
|
|
|
|
|
|
|
|
|
120 |
|
|
|
|
|
|
|
|
|
|
|
|
|
|
|
|
110 |
|
|
|
|
|
|
|
|
|
|
|
|
|
|
|
|
100 |
|
|
|
|
|
|
|
|
|
|
|
|
|
|
|
|
90 |
|
|
|
|
|
|
|
|
|
|
|
|
|
|
|
|
80 |
China |
India |
|
|
Indonesia |
|
Australia |
Canada |
|
|
Mexico |
Brazil |
|
|
Japan |
|
Saudi Arabia |
World |
Turkey |
KoreaSouth |
South Africa |
StatesUnited |
Argentina |
EU-27 |
Russia |
(1) Note: y-axis does not start at 0.
Source: Eurostat (online data code: demo_pjangroup) and the United Nations Department of Economic and Social Affairs (World Population Prospects: the 2010 Revision)
Figure 2.5: Age pyramids, 2010
(% of total population)
Age
85+
80-84
75-79
70-74
65-69
60-64
55-59
50-54
45-49
40-44
35-39
30-34
25-29
20-24
15-19
10-14
5-9
0-4
5 |
4 |
3 |
2 |
1 |
|
0 |
1 |
2 |
3 |
4 |
5 |
||
|
|
|
|
|
|
Men |
|
|
Women |
|
|
|
|
|
|
|
|
|
|
|
|
|
|
|
|
||
|
|
|
|
|
|
|
|
|
|
|
|
||
Solid colour: EU-27 Bordered: World
Source: Eurostat (online data code: demo_pjangroup) and the United Nations Department of Economic and Social Affairs (World Population Prospects: the 2010 Revision)
32 |
|
The EU in the world 2013 — a statistical portrait |
|
|

Population  2
2
Ageing society represents a major demographic challenge for many economies and may be linked to a range of issues, including, persistently low levels of fertility rates and significant increases in life expectancy during recent decades.
Figure 2.5 shows how different the age structure of the EU 27’s population is from the average for the world. Most notably the largest shares of the world’s population are among the youngest age classes, reflecting a population structure that is younger, whereas for the EU 27 the share of the age groups below those aged 40 to 44 years gets progressively smaller approaching the youngest cohorts, reflecting falling fertility rates over several decades and the impact of the baby-boomer cohorts on the population structure (resulting from high fertility rates in several European countries up to mid-1960s). Another notable difference is the greater gender imbalance within the EU 27 among older age groups than is typical for the world as a whole.
The age dependency ratios shown in Table 2.2 summarise the level of support for older persons (aged 65 years and over) and younger persons (aged less than 15 years) provided by the working age population (those aged between 15 to 64 years). The overall age dependency ratio for the EU 27 was lower in 2010 than it was in 1960 due to a large fall in the young-age dependency ratio more than cancelling out an increase in the old-age dependency ratio. Most of the G20 members displayed a similar pattern with two exceptions: in Japan the increase in the old-age dependency ratio exceeded the fall in the young-age dependency ratio; in Saudi Arabia both the young and old-age dependency ratios were lower in 2010 than in 1960, reflecting the large increase in the working age population in this country. In 2010 the highest age dependency ratios among G20 members recorded for Japan, Argentina and Mexico.
Table 2.2: Dependency ratios, 1960 and 2010
(% of the population aged 15-64)
|
|
Age |
|
Young-age |
|
Old-age |
|||
|
dependency ratio (1) |
dependency ratio (2) |
dependency ratio (3) |
||||||
|
1960 |
|
2010 |
1960 |
|
2010 |
1960 |
|
2010 |
EU-27 (4) |
54.5 |
|
49.3 |
39.0 |
|
23.3 |
15.5 |
|
25.9 |
Argentina |
56.9 |
|
54.9 |
48.2 |
|
38.5 |
8.7 |
|
16.4 |
Australia |
63.3 |
|
48.0 |
49.3 |
|
28.1 |
14.0 |
|
19.9 |
Brazil |
86.1 |
|
48.0 |
80.2 |
|
37.7 |
5.9 |
|
10.4 |
Canada |
69.6 |
|
44.0 |
56.9 |
|
23.6 |
12.7 |
|
20.3 |
China |
77.3 |
|
38.2 |
70.2 |
|
26.9 |
7.1 |
|
11.3 |
India |
77.6 |
|
55.1 |
72.3 |
|
47.4 |
5.4 |
|
7.6 |
Indonesia |
77.0 |
|
48.3 |
70.7 |
|
40.1 |
6.3 |
|
8.2 |
Japan |
56.0 |
|
56.4 |
47.0 |
|
20.9 |
8.9 |
|
35.5 |
Mexico |
95.7 |
|
54.9 |
89.3 |
|
45.1 |
6.4 |
|
9.8 |
Russia |
56.9 |
|
38.6 |
47.0 |
|
20.8 |
9.9 |
|
17.7 |
Saudi Arabia |
90.2 |
|
49.9 |
83.2 |
|
45.5 |
7.0 |
|
4.4 |
South Africa |
81.2 |
|
53.3 |
74.2 |
|
46.2 |
7.0 |
|
7.1 |
South Korea |
80.6 |
|
38.1 |
73.8 |
|
22.7 |
6.8 |
|
15.4 |
Turkey |
82.6 |
|
47.8 |
77.1 |
|
39.0 |
5.5 |
|
8.8 |
United States |
66.7 |
|
49.6 |
51.4 |
|
30.0 |
15.3 |
|
19.5 |
World |
73.0 |
|
52.4 |
64.2 |
|
40.8 |
8.8 |
|
11.6 |
(1) Population aged 0-14 and 65 or more as a percentage of the population aged 15-64. (2) Population aged 0-14 as a percentage of the population aged 15-64.
(3) Population aged 65 or more as a percentage of the population aged 15-64.
(4) 1960 is estimated based on those EU Member States for which data are available (excludes Estonia, French overseas departments, Cyprus, Latvia, Lithuania, Malta, Romania and Slovenia).
Source: Eurostat (online data codes: demo_pjan and demo_pjanind) and the United Nations Department of Economic and Social Affairs (World Population Prospects: the 2010 Revision)
|
The EU in the world 2013 — a statistical portrait |
|
33 |
|
2  Population
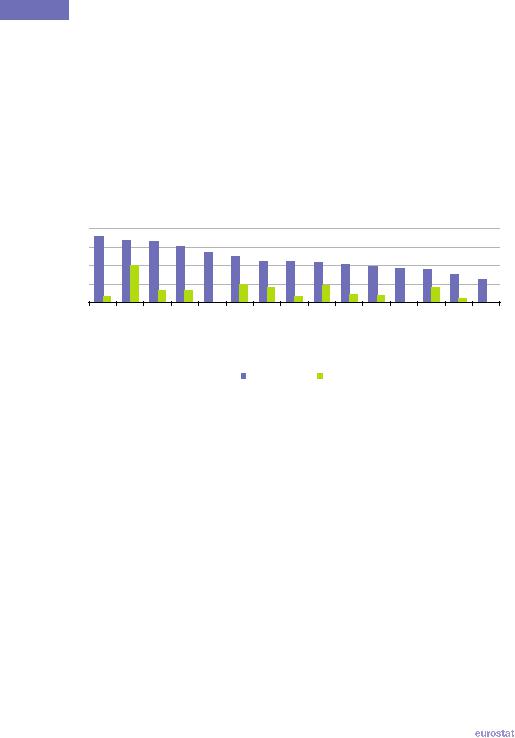
Indicators for marriage and divorce provide information in relation to family formation and dissolution. Marriage, as recognised by the law of each country, has long been considered to mark the formation of a family unit. Marriage and divorce rates are generally presented relative to 1 000 members of overall population – see Figure 2.6. The lowest marriage rates among the G20 members in 2009 were in Argentina and South Africa (2008 data) with the rate for the EU 27 the next lowest, while the highest rates were recorded in Indonesia (2008 data), Russia and Turkey. Concerning the divorce rate, the value for Russia stands out, being considerably higher than any of the other G20 members (for which data are available). The ratio of divorces to marriages was highest in Russia and lowest in Indonesia.
Figure 2.6: Crude marriage and divorce rates, 2009(1)
(per 1 000 population)
10.0 |
|
|
|
|
|
|
|
|
|
|
|
|
|
|
7.5 |
|
|
|
|
|
|
|
|
|
|
|
|
|
|
5.0 |
|
|
|
|
|
|
|
|
|
|
|
|
|
|
2.5 |
|
|
|
|
|
|
|
|
|
|
|
|
|
|
0.0 |
Russia |
|
|
|
|
Japan |
|
Australia |
Saudi Arabia (3) |
Brazil |
|
|
|
|
Indonesia (2) |
Turkey |
China (3) |
StatesUnited |
South Korea |
Mexico (2) |
Canada (2) |
EU-27 (4) |
(AfricaSouth2) |
Argentina |
|||||
|
|
|
|
|
|
Marriage |
|
|
Divorce |
|
|
|
|
|
(1) India, not available; Argentina, Canada and the United States: divorce rate, not available. (2) 2008.
(3) 2007.
(4) Divorce rate, 2008.
Source: Eurostat (online data code: demo_nind and demo_ndivind) and the United Nations Department of Economic and Social Affairs (Demographic Yearbook)
There are two distinct components of population change: the natural change that results out of the difference between the number of live births and the number of deaths; and the net effect of migration, in other words, the balance between people coming into and people leaving a territory. The following tables and figures look at several indicators related to births, deaths and migration and their impact on the overall level of population.
Unlike the gender balance of the whole population, where most G20 members show a slight imbalance towards more women, the ratio of boys to girls at birth shows a somewhat higher number of boys being born than girls – see Figure 2.7. The ratio of the number of births of boys per 100 births of girls fell in a narrow range for most G20 members, between 103 in South Africa and Saudi Arabia and 106 in Russia; India (108) and South Korea (110) were somewhat above this range and China (120) far above it.
34 |
|
The EU in the world 2013 — a statistical portrait |
|
|
Population  2
2
One of the reasons used to explain partly the downward development of fertility rates is the decision of parents to delay starting a family. Figure 2.8 shows a wide spread in the average age of women at child bearing during the years 2005 to 2010, from 25.3 years in India to 30 years or above in Japan, Australia, South Korea and Saudi Arabia. For the EU 27 the average age in 2009 was 29.8 years, a slight increase over the 29.3 years average that was recorded in 2003.
Figure 2.7: Ratio of births of boys to girls, average for July 2005 to June 2010 (1)
(boys per 100 girls)
125 |
|
|
|
|
|
|
|
|
|
|
|
|
|
|
|
|
120 |
|
|
|
|
|
|
|
|
|
|
|
|
|
|
|
|
115 |
|
|
|
|
|
|
|
|
|
|
|
|
|
|
|
|
110 |
|
|
|
|
|
|
|
|
|
|
|
|
|
|
|
|
105 |
|
|
|
|
|
|
|
|
|
|
|
|
|
|
|
|
100 |
|
|
|
|
Australia |
Japan |
EU-27 (2) |
|
Brazil |
|
|
|
|
|
|
|
China |
KoreaSouth |
India |
World |
Russia |
Canada |
Indonesia |
Mexico |
Turkey |
StatesUnited |
Argentina |
Saudi Arabia |
South Africa |
||||
(1) Note: y-axis does not start at 0. |
|
|
|
|
|
|
|
|
|
|
|
|
|
|||
(2) 2010. |
|
|
|
|
|
|
|
|
|
|
|
|
|
|
|
|
Source: Eurostat (online data code: demo_fasec) and the United Nations Department of Economic and Social Affairs (World Population Prospects: the 2010 Revision)
Figure 2.8: Mean age at child bearing, average for July 2005 to June 2010 (1)
(years) |
|
|
|
|
|
|
|
|
|
|
|
|
|
|
|
|
35 |
|
|
|
|
|
|
|
|
|
|
|
|
|
|
|
|
30 |
|
|
|
|
|
|
|
|
|
|
|
|
|
|
|
|
25 |
|
|
|
|
|
|
|
|
|
|
|
|
|
|
|
|
20 |
|
Australia |
Japan |
EU-27 (2) |
Canada |
Indonesia |
|
|
|
|
|
Mexico |
|
China |
Brazil |
India |
Saudi Arabia |
KoreaSouth |
South Africa |
StatesUnited |
Argentina |
Turkey |
World |
Russia |
|||||||||
(1) Note: y-axis does not start at 0. |
|
|
|
|
|
|
|
|
|
|
|
|
|
|||
(2) 2009. |
|
|
|
|
|
|
|
|
|
|
|
|
|
|
|
|
Source: Eurostat (online data code: demo_find) and the United Nations Department of Economic and Social Affairs (World Population Prospects: the 2010 Revision)
|
The EU in the world 2013 — a statistical portrait |
|
35 |
|

2  Population
The crude birth rate in the EU 27 was marginally higher in the years 2006 to 2010 than it was between 2001 and 2005, but remained among the lowest across the G20 members, with only Japan and South Korea recording lower birth rates. Crude birth rates recorded in India, Saudi Arabia and South Africa between 2005 and 2010 were more than double the average rate for the EU 27 in 2010.
When the death rate exceeds the birth rate there is negative natural population change; this situation was experienced in Russia and Japan over the period 2005 to 2010. The reverse situation, natural population growth due to a higher birth rate, was observed for all of the remaining G20 members (see Tables 2.3 and 2.4) with the largest differences recorded in Saudi Arabia, Mexico and India. South Africa recorded the highest crude death rate (in part reflecting an HIV/AIDS epidemic resulting in a high number of deaths among relatively young persons) such that the difference between the crude birth and death rates in this country was not large despite its very high birth rate.
The combined effect of natural population change and net migration including statistical adjustment (which refers to changes observed in the population figures which cannot be attributed to births, deaths, immigration or emigration) can be seen in the total change in population levels. During the ten years between 2000 and 2010 all of the G20 members, except Russia, experienced an increase in their population numbers: Russia’s declining population resulted from positive net migration being less substantial than the negative natural population change. Argentina, Brazil, China, India, Indonesia, Mexico, South Korea and Turkey experienced negative net migration that was less than the positive increase from natural population change. The EU 27, Australia, Canada, Saudi Arabia, South Africa and the United States experienced the cumulative effects of positive natural population change and net migration.
Table 2.3: Birth, fertility and death rates, annual averages for July 2000 to June 2010
|
Crude birth rate |
Fertility rate |
Crude death rate |
|||
|
(per 1 000 population) |
(births per woman) |
(per 1 000 population) |
|||
|
2000-2005 |
2005-2010 |
2000-2005 |
2005-2010 |
2000-2005 |
2005-2010 |
EU-27 (1) |
10.4 |
10.7 |
1.5 |
1.6 |
9.9 |
9.7 |
Argentina |
18.0 |
17.5 |
2.4 |
2.3 |
7.8 |
7.7 |
Australia |
12.7 |
13.6 |
1.8 |
1.9 |
6.9 |
6.7 |
Brazil |
19.8 |
16.4 |
2.3 |
1.9 |
6.4 |
6.4 |
Canada |
10.6 |
11.2 |
1.5 |
1.7 |
7.2 |
7.4 |
China |
13.5 |
12.6 |
1.7 |
1.6 |
7.1 |
7.2 |
India |
24.8 |
23.1 |
3.0 |
2.7 |
8.7 |
8.3 |
Indonesia |
21.0 |
19.1 |
2.4 |
2.2 |
7.4 |
7.2 |
Japan |
8.9 |
8.6 |
1.3 |
1.3 |
7.9 |
8.8 |
Mexico |
22.4 |
20.6 |
2.6 |
2.4 |
4.7 |
4.7 |
Russia |
9.9 |
11.4 |
1.3 |
1.4 |
16.0 |
14.2 |
Saudi Arabia |
24.7 |
22.1 |
3.5 |
3.0 |
4.1 |
3.8 |
South Africa |
24.0 |
21.9 |
2.8 |
2.6 |
13.9 |
15.2 |
South Korea |
10.2 |
10.0 |
1.2 |
1.3 |
5.3 |
5.1 |
Turkey |
19.7 |
18.7 |
2.2 |
2.2 |
5.7 |
5.5 |
United States |
14.1 |
14.0 |
2.0 |
2.1 |
8.5 |
8.3 |
World |
20.8 |
20.0 |
2.6 |
2.5 |
8.7 |
8.4 |
(1) Crude birth rate and crude death rate: annual averages for 2000 to 2005 and 2005 to 2010; fertility rate: data for 2003 instead of 2000 to 2005 and data for 2008 instead of 2005 to 2010.
Source: Eurostat (online data codes: demo_gind and demo_find) and the United Nations Department of Economic and Social Affairs (World Population Prospects: the 2010 Revision)
36 |
|
The EU in the world 2013 — a statistical portrait |
|
|

Population  2
2
Table 2.4: Population change, annual averages for July 2000 to June 2010
(per 1 000 population)
|
|
Total |
Natural |
|
Net |
|||
|
population change |
population change |
migration |
|||||
|
2000-2005 |
|
2005-2010 |
2000-2005 |
2005-2010 |
2000-2005 |
|
2005-2010 |
EU-27 (1) |
3.9 |
|
3.7 |
0.5 |
1.0 |
3.4 |
|
2.7 |
Argentina |
9.3 |
|
8.8 |
10.2 |
9.8 |
-1.0 |
|
-1.0 |
Australia |
12.5 |
|
17.5 |
5.8 |
6.9 |
6.7 |
|
10.5 |
Brazil |
12.8 |
|
9.4 |
13.4 |
9.9 |
-0.6 |
|
-0.5 |
Canada |
10.3 |
|
10.5 |
3.4 |
3.8 |
6.9 |
|
6.6 |
China |
6.0 |
|
5.1 |
6.3 |
5.4 |
-0.4 |
|
-0.3 |
India |
15.7 |
|
14.3 |
16.1 |
14.8 |
-0.4 |
|
-0.5 |
Indonesia |
12.6 |
|
10.8 |
13.7 |
11.9 |
-1.1 |
|
-1.1 |
Japan |
1.1 |
|
0.2 |
1.0 |
-0.2 |
0.1 |
|
0.4 |
Mexico |
12.7 |
|
12.6 |
17.7 |
15.9 |
-5.0 |
|
-3.3 |
Russia |
-4.0 |
|
-1.2 |
-6.2 |
-2.8 |
2.2 |
|
1.6 |
Saudi Arabia |
36.4 |
|
26.5 |
20.6 |
18.3 |
15.7 |
|
8.2 |
South Africa |
13.1 |
|
9.6 |
10.1 |
6.7 |
3.0 |
|
2.9 |
South Korea |
4.5 |
|
4.8 |
5.0 |
4.9 |
-0.4 |
|
-0.1 |
Turkey |
13.7 |
|
13.1 |
14.0 |
13.2 |
-0.3 |
|
-0.1 |
United States |
9.9 |
|
8.9 |
5.6 |
5.7 |
4.3 |
|
3.3 |
World |
12.2 |
|
11.6 |
12.2 |
11.6 |
- |
|
- |
(1) Net migration includes statistical adjustment and migrant flows between EU Member States; annual averages for 2001 to 2005 and 2006 to 2010.
Source: Eurostat (online data code: demo_gind) and the United Nations Department of Economic and Social Affairs (World Population Prospects: the 2010 Revision)
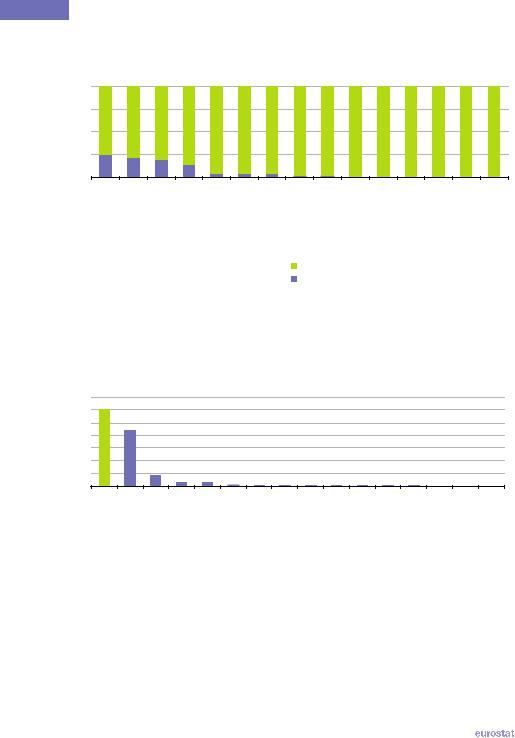
Australia, Saudi Arabia, Canada and the United States had the largest shares of foreigners in their population (see Figure 2.9 overleaf), in line with high positive net migration rates recorded for these countries in recent years. The EU 27 had a comparatively low share of foreigners (non-EU citizens), equal to some 4.0 % of its total population in 2009. The share of foreigners in China and Turkey was considerably lower, at around 0.1 %, while in Mexico, Brazil and India it was also less than 0.5 %.
In 2011, the United Nations High Commissioner for Refugees reported that there were 895 284 asylum applicants across the world, of which 302 445 (from non-member countries) were in the EU 27. Among those seeking asylum in the EU 27 a relatively high proportion of applicants were from Afghanistan, Russia, Pakistan, Iraq, Serbia, Somalia, Iran and Nigeria (each accounting for between 28 000 and 11 000 asylum seekers). The highest number of asylum applicants into the EU 27 from G20 countries came from Russia (18 330), Turkey (6 455) and China (5 540); note, the latter figure includes applicants from Hong Kong. Figure 2.10 shows that aside from the EU 27, there were relatively high numbers of asylum seekers in South Africa (many of whom originated from neighbouring Zimbabwe) and in Canada in 2011; note that the figures for the United States exclude individuals pending a decision on their asylum claim.
|
The EU in the world 2013 — a statistical portrait |
|
37 |
|
2  Population
Figure 2.9: Analysis of the citizenship of the population, 2010(1)
(% of total)
100 |
|
|
|
|
|
|
|
|
|
|
|
|
|
|
75 |
|
|
|
|
|
|
|
|
|
|
|
|
|
|
50 |
|
|
|
|
|
|
|
|
|
|
|
|
|
|
25 |
|
|
|
|
|
|
|
|
|
|
|
|
|
|
0 |
|
|
|
|
|
|
|
|
|
|
|
|
|
|
Australia (2)(3) |
Saudi Arabia |
Canada (2)(3) |
StatesUnited (2)(3) |
Argentina (4) |
EU-27 (5)(6) |
(AfricaSouth3)(7) |
(KoreaSouth5) |
Japan (5) |
Russia (8) |
India |
Brazil (3)(5) |
Mexico (5) |
Turkey (9) |
China |
|
|
|
|
|
|
|
National |
|
|
|
|
|
|
|
|
|
|
|
|
|
|
Foreign |
|
|
|
|
|
|
|
(1) Excludes unknown and stateless persons; Indonesia, not available. (2) 2007. (3) Foreign-born population. (4) 2001. (5) 2009. |
|
|||||||||||||
(6) Non-EU citizens only. (7) Foreigners estimated within the range of 3 % to 4 % for documented and undocumented cases. (8) 2002. |
||||||||||||||
(9) 2007. |
|
|
|
|
|
|
|
|
|
|
|
|
|
|
Source: Eurostat (online data code: migr_pop1ctz), the United Nations Department of Economic and Social Affairs (Demographic Statistics), the OECD (International Migration Data 2011) and national census results
Figure 2.10: Asylum seekers, 2011 |
|
|
|
|
|
|
|
|
|
|
|||||
(1 000 applicants) |
|
|
|
|
|
|
|
|
|
|
|
|
|
|
|
350 |
|
|
|
|
|
|
|
|
|
|
|
|
|
|
|
300 |
|
|
|
|
|
|
|
|
|
|
|
|
|
|
|
250 |
|
|
|
|
|
|
|
|
|
|
|
|
|
|
|
200 |
|
|
|
|
|
|
|
|
|
|
|
|
|
|
|
150 |
|
|
|
|
|
|
|
|
|
|
|
|
|
|
|
100 |
|
|
|
|
|
|
|
|
|
|
|
|
|
|
|
50 |
|
|
|
|
|
|
|
|
|
|
|
|
|
|
|
0 |
|
Canada |
|
|
Australia |
Brazil |
Japan |
India |
Indonesia |
Argentina |
|
Russia |
Mexico |
Saudi Arabia |
China |
EU-27 (1) |
South Africa |
(StatesUnited2) |
Turkey |
South Korea |
|||||||||||
(1) Asylum-seekers from non-member countries.
(2) Excludes individuals pending a decision on their asylum claim with the Executive Office for Immigration Review.
Source: Eurostat (online data code: migr_asyappctza) and the United Nations High Commissioner for Refugees (UNHCR Statistical Online Population Database)
38 |
|
The EU in the world 2013 — a statistical portrait |
|
|
Population  2
2
The latest United Nations population projections suggest that the pace at which the world’s population is expanding will slow in the coming decades; however, the total number of inhabitants is projected to reach more than 9 600 million by 2060, representing an increase of 39.4 % compared with 2010. This slowdown in population growth will be particularly evident for developed and emerging economies as the number of inhabitants within the G20 – excluding the EU 27 – is projected to increase by 15.1 % between 2010 and 2060 while the EU 27’s population is projected (by Eurostat) to increase by 3.0 % over the same period. The population of many developing countries, in particular, those in Africa, is likely to continue growing at a rapid pace. Among the G20 members the fastest population growth between 2010 and 2060 is projected to be in Saudi Arabia, while the populations of Japan, Russia, China and South Korea are projected to be smaller in 2060 than they were in 2010.
Old-age dependency ratios are projected to continue to rise in all G20 members, suggesting that there will be an increasing burden to provide for social expenditure related to population ageing (pensions, healthcare, institutional care). The EU 27’s old-age dependency ratio is projected to reach 29.5 % by 2060, around 7.3 percentage points above the world average, but considerably lower than in Japan, South Korea or China. With relatively low fertility rates the young-age dependency ratio is projected to be lower in 2060 than it was in 2010 in all G20 members, dropping to 14.3 % in the EU 27, some 4.5 percentage points below the projected world average.
Table 2.5: Population projections, 2010 and 2060(1)
|
|
Total |
Population density |
Young-age |
Old-age |
||||||
|
|
dependency |
dependency |
||||||||
|
population |
(inhabitants |
|||||||||
|
|
ratio |
|
ratio |
|||||||
|
(millions) |
per km²) |
|
|
|||||||
|
|
(%) (2) |
|
(%) (3) |
|||||||
|
2010 |
|
2060 |
2010 |
2060 |
2010 |
|
2060 |
2010 |
|
2060 |
EU-27 |
501.8 |
|
516.9 |
116.6 |
120.3 |
23.3 |
|
14.2 |
25.9 |
|
29.5 |
Argentina |
40.4 |
|
51.3 |
14.5 |
18.4 |
38.5 |
|
15.2 |
16.4 |
|
26.0 |
Australia |
22.3 |
|
32.7 |
2.9 |
4.2 |
28.1 |
|
15.3 |
19.9 |
|
29.4 |
Brazil |
194.9 |
|
216.9 |
22.9 |
25.5 |
37.7 |
|
13.0 |
10.4 |
|
31.7 |
Canada |
34.0 |
|
45.1 |
3.4 |
4.5 |
23.6 |
|
14.5 |
20.3 |
|
31.1 |
China |
1 341.3 |
|
1 211.5 |
139.8 |
126.2 |
26.9 |
|
12.5 |
11.3 |
|
35.1 |
India |
1 224.6 |
|
1 718.0 |
372.5 |
522.6 |
47.4 |
|
16.7 |
7.6 |
|
19.6 |
Indonesia |
239.9 |
|
290.3 |
125.9 |
152.4 |
40.1 |
|
14.7 |
8.2 |
|
26.8 |
Japan |
126.5 |
|
103.2 |
334.9 |
273.2 |
20.9 |
|
11.6 |
35.5 |
|
43.9 |
Mexico |
113.4 |
|
142.8 |
57.9 |
72.9 |
45.1 |
|
14.0 |
9.8 |
|
28.7 |
Russia |
143.0 |
|
120.8 |
8.4 |
7.1 |
20.8 |
|
15.4 |
17.7 |
|
29.2 |
Saudi Arabia |
27.4 |
|
46.3 |
12.8 |
21.5 |
45.5 |
|
14.2 |
4.4 |
|
22.9 |
South Africa |
50.1 |
|
57.1 |
41.1 |
46.8 |
46.2 |
|
18.5 |
7.1 |
|
14.2 |
South Korea |
48.2 |
|
44.3 |
484.1 |
444.6 |
22.7 |
|
11.9 |
15.4 |
|
40.2 |
Turkey |
72.8 |
|
90.8 |
92.8 |
115.9 |
39.0 |
|
14.1 |
8.8 |
|
26.7 |
United States |
310.4 |
|
421.0 |
32.2 |
43.7 |
30.0 |
|
17.2 |
19.5 |
|
27.5 |
World |
6 895.9 |
|
9 615.2 |
50.6 |
70.6 |
40.8 |
|
18.7 |
11.6 |
|
22.3 |
(1) EU 27 population projections made on the basis of Europop2010 convergence scenario; all remaining projections are made on the basis of the UN’s medium fertility projection variant.
(2) Population aged 0-14 as a percentage of the population aged 15-64.
(3) Population aged 65 or more as a percentage of the population aged 15-64.
Source: Eurostat (online data codes: demo_gind, tps00003, demo_pjan, demo_pjanind and proj_10c2150p) and the United Nations Department of Economic and Social Affairs (World Population Prospects: the 2010 Revision)
|
The EU in the world 2013 — a statistical portrait |
|
39 |
|