
Introduction
•to provide other European institutions and the governments of the EU Member States with the information needed to design, implement, monitor and evaluate Community policies;
•to disseminate statistics to the European public and enterprises and to all economic and social agents involved in decision-making;
•to implement a set of standards, methods and organisational structures which allow comparable, reliable and relevant statistics to be produced throughout the Union, in line with the principles of the European statistics Code of Practice;
•to improve the functioning of the European statistical system (ESS), to support the EU Member States, and to assist in the development of statistical systems at an international level.
Since the creation of a European statistical office in 1952, there has always been a realisation that the planning and implementation of European policies must be based on reliable and comparable statistics. As a result, the ESS was built-up gradually to provide comparable statistics at EU level.
The ESS is the partnership between Eurostat and the national statistical offices and other national authorities responsible in each EU Member State for the development, production and dissemination of European statistics. This partnership also includes the member countries of the European Free Trade Association (EFTA). The ESS also coordinates its work with candidate countries and with other European Commission services, agencies and the European Central Bank and international organisations such as the United Nations (UN), the International Monetary Fund (IMF), the World Bank and the Organisation for Economic Cooperation and Development (OECD).
Eurostat and its partners in the ESS aim to provide relevant, impartial, reliable and comparable statistical data. Indeed, access to high-quality statistics and Eurostat’s obligation for trustworthiness is enshrined in law.
|
The EU in the world 2013 — a statistical portrait |
|
7 |
|

Introduction
Cooperation on statistics with international and global organisations
In a globalised world statistical organisations are working to define and implement common concepts, classifications and methods for making global comparisons of official statistics. European and international standards have been developed through joint work conducted by national statistical systems and international organisations such as the European Commission, the UN, the IMF, the World Bank and the OECD. This work has led to the formation of a global statistical system that uses a common language, international methods and standards to produce comparable data at regional, national and international level.
Examples of the results of this work are:
•classifications – such as the International Standard Classification of Education for education levels and fields of study and the International Standard Industrial Classification for the classification of economic activities;
•manuals – for example, the system of national accounts and the Frascati manual for research and development statistics.
The Group of Twenty or G20
In September 1999, the finance ministers and central bank governors of the Group of Seven (or G7) countries announced their intention to ‘broaden the dialogue on key economic and financial policy issues’. The establishment of the G20 recognised the considerable changes in the international economic landscape, such as the growing importance of emerging economies, or the increasing integration of the global economy and financial markets. In November 2008, during the financial and economic crisis the leaders of the G20 members convened for the first time, in Washington (United States). Between November 2008 and June 2012, the G20 held seven Leaders’ Summits to seek agreements on global economic matters.
The G20 brings together the world’s major advanced and emerging economies, comprising 19 country members and the EU. The country members include four EU Member States (Germany, France, Italy and the United Kingdom), and 15 countries from the rest of the world, namely: Argentina, Australia, Brazil, Canada, China, India, Indonesia, Japan, Mexico, Russia, Saudi Arabia, South Africa, South Korea, Turkey and the United States. The EU (coloured green) and the 15 countries from the rest of the world (purple) are shown in the map on the facing page and are listed in the table below. The G20 members covered 60.7 % of the world’s land area, generated 86.7 % of global gross domestic product (GDP) and were home to 65.1 % of the world’s population in 2010.
8 |
|
The EU in the world 2013 — a statistical portrait |
|
|
Introduction
EU 27  15 non-EU G20 member countries
Table 1: Key indicators, 2010
|
Total area |
GDP |
Population |
|
(km2) (1) |
(EUR million) |
(million) |
EU-27 |
4 422 993 |
12 260 495 |
501.8 |
Argentina |
2 780 400 |
279 297 |
40.4 |
Australia |
7 741 220 |
959 452 |
22.3 |
Brazil |
8 514 880 |
1 575 745 |
194.9 |
Canada |
9 984 670 |
1 189 590 |
34.0 |
China |
9 600 001 |
4 329 304 |
1 341.3 |
India |
3 287 260 |
1 299 184 |
1 224.6 |
Indonesia |
1 904 570 |
533 641 |
239.9 |
Japan |
377 947 |
4 117 729 |
126.5 |
Mexico |
1 964 380 |
778 626 |
113.4 |
Russia |
17 098 240 |
1 116 258 |
143.0 |
Saudi Arabia |
2 149 690 |
327 877 |
27.4 |
South Africa |
1 219 090 |
274 349 |
50.1 |
South Korea |
99 900 |
765 157 |
48.2 |
Turkey |
783 560 |
554 002 |
72.8 |
United States |
9 831 510 |
10 897 714 |
310.4 |
World |
134 591 234 |
47 570 320 |
6 895.9 |
(1) 2009, except for EU 27.
Source: Eurostat (online data codes: nama_gdp_c, demo_gind and tps00003), the Food and Agriculture Organisation of the United Nations (FAOSTAT: Resources), the United Nations Statistics Division (National Accounts Main Aggregates Database) and the United Nations Department of Economic and Social Affairs (World Population Prospects: the 2010 Revision)
|
The EU in the world 2013 — a statistical portrait |
|
9 |
|

Introduction
Publication structure and coverage
The EU in the world 2013 provides users of official statistics with a snapshot of the wealth of information that is available on Eurostat’s website and those websites of other international organisations. The publication provides a balanced set of indicators, with a broad cross-section of information; it is composed of an introduction and 13 main chapters.
The publication aims to present information for the EU-27 (the EU of 27 Member States (1)), occasionally the euro area (based on 17 members (2)), as well as 15 other major advanced or emerging economies from around the world, in other words, all members of the G20 (Group of Twenty). Note that data are generally presented for the EU-27 aggregate and for the 15 other non-EU G20 countries. In the text, statements such as ‘among G20 members’ refer (unless otherwise specified) to the EU-27 as a whole and the 15 non-EU G20 countries. In exceptional cases when information for the EU-27 aggregate is not available, then data and comments for the four G20 countries which are also EU Member States – Germany, France, Italy and the United Kingdom – have been included instead.
Spatial data coverage
The EU 27 and euro area (EA-17) aggregates that are provided include information for all of the countries or estimates for missing information; any incomplete totals that are created are systematically footnoted. Time series for these geographical aggregates are based on a fixed set of countries for the whole of the time period (unless otherwise indicated) – any time series for the EU 27 refer to a sum or an average for all 27 current Member States regardless of when they joined the EU. In a similar vein, the data for the EA-17 are consistently presented for the 17 current members (euro area membership as of January 2011).
When available, information is also presented for a world total; in the event that data for the world is not available this heading has been excluded from tables and figures.
If data for a reference period are not available for a particular country, then efforts have been made to fill tables and figures with data for previous reference years (these exceptions are footnoted); generally an effort has been made to take account of at least two older reference periods.
The order of the G20 countries used in this publication follows the alphabetical order of the countries’ names in English; in some of the figures the data are ranked according to the values of a particular indicator. The data for China presented in this publication systematically excludes Hong Kong and Macao (unless otherwise stated).
(1) Comprising Belgium, Bulgaria, the Czech Republic, Denmark, Germany, Estonia, Ireland, Greece, Spain, France, Italy, Cyprus, Latvia, Lithuania, Luxembourg, Hungary, Malta, the Netherlands, Austria, Poland, Portugal, Romania, Slovenia, Slovakia, Finland, Sweden and the United Kingdom.
(2) Comprising Belgium, Germany, Estonia, Ireland, Greece, Spain, France, Italy, Cyprus, Luxembourg, Malta, the Netherlands, Austria, Portugal, Slovenia, Slovakia and Finland.
10 |
|
The EU in the world 2013 — a statistical portrait |
|
|

Introduction
Data sources
The indicators presented are often compiled according to international – sometimes global
– standards, for example, UN standards for national accounts and the IMF’s standards for balance of payments statistics. Although most data are based on international concepts and definitions there may be certain discrepancies in the methods used to compile the data.
EU 27 and euro area data
Almost all of the indicators presented for the EU 27 and EA-17 aggregates have been drawn from Eurobase, Eurostat’s online database. Eurobase is updated regularly, so there may be differences between data appearing in this publication and data that is subsequently downloaded. In exceptional cases some indicators for the EU have been extracted from international sources, for example, when values are expressed in purchasing power parities. Otherwise, European Commission sources have been used, for example, data from the Market Observatory for Energy have been used for retail fuel prices in Chapter 12.
G20 countries from the rest of the world
For the 15 G20 countries that are not members of the EU, the data presented in this publication have generally been extracted from a range of international sources listed below. In a few cases the data available from these international sources have been supplemented by data for individual countries from national statistics authorities. For some of the indicators a range of international statistical sources are available, each with their own policies and practices concerning data management (for example, concerning data validation, correction of errors, estimation of missing data, and frequency of updating). In general, attempts have been made to use only one source for each indicator in order to provide a comparable analysis between the countries.
|
The EU in the world 2013 — a statistical portrait |
|
11 |
|

Introduction
The international data sources include:
Organisation |
Data source(s) |
The United Nations (UN) and related organisations |
|
The United Nations |
Indstat; Comtrade; Service Trade |
The United Nations Statistics Division (UNSD) |
National Accounts Main Aggregates Database; Economic Statistics |
|
Branch; Millennium Development Goals Database; Environment |
|
statistics, Waste section |
The United Nations Department of Economic |
World Population Prospects: the 2010 Revision; World Urbanisation |
and Social Affairs (UN DESA) |
Prospects: the 2011 Revision; Demographic Yearbook; |
|
Demographic statistics |
The United Nations High Commissioner for |
UNHCR Statistical Online Population Database |
Refugees (UNHCR) |
|
The United Nations Conference on Trade and |
Unctadstat; Maritime transport indicators; Review of maritime |
Development (UNCTAD) |
transport, 2011 |
The United Nations Framework Convention on |
Data available from data.un.org/Explorer.aspx |
Climate Change (UNFCCC) |
|
The United Nations Environment Programme |
Ozone Secretariat; Water Section; World Conservation Monitoring |
(UNEP) |
Centre |
The Food and Agriculture Organisation (FAO) of |
FAOSTAT; FishStatJ |
the United Nations |
|
The United Nations World Tourism Organisation |
Tourism highlights, 2012; World tourism barometer |
(UNWTO) |
|
The United Nations Educational, Scientific and |
UIS: Science & Technology; Demographic & Socio-economic; |
Cultural Organisation (UNESCO) |
Education |
The International Telecommunication Union |
Data available from data.un.org/Explorer.aspx |
(ITU) |
|
The International Labour Organisation (ILO) |
Key indicators of the labour market; Global wage database; Social |
|
Security Department; Global wage report 2010/2011 |
The World Health Organisation (WHO) |
World Health Statistics; World Health Report 2004; Department of |
|
Measurement and Health Information) |
The World Intellectual Property Organisation |
Data available from data.un.org/Explorer.aspx |
(WIPO) |
|
The International Monetary Fund (IMF) |
World Economic Outlook; International Financial Statistics |
The World Bank |
World Development Indicators; Global Development Finance; |
|
Millennium Development Goals; Poverty and Inequality Database |
The Organisation for Economic |
International Migration Data 2011; Labour market statistics; Income |
Co-operation and Development (OECD) |
Distribution and Poverty; Social Expenditure Database; Gross |
|
domestic product; Energy and transportation; Factbook 2012 |
The International Energy Agency (IEA) |
Energy balances; Key world energy statistics, 2011; Electricity; |
|
Prices |
The International Union for Conservation of |
World Database on Protected Areas |
Nature (IUCN) |
|
For transport statistics:
•data concerning ports have been extracted from the World port rankings of the American Association of Port Authorities;
•data concerning airports have been compiled from information available from individual airports, regional or national civil aviation authorities.
12 |
|
The EU in the world 2013 — a statistical portrait |
|
|

Introduction
Data extraction and processing
The statistical data presented in this publication were mainly extracted during June and July 2012. The accompanying text was drafted in July and August 2012.
Many of the international sources from which data were extracted present monetary data in national currencies and/or United States dollars (USD), whereas Eurostat data are normally presented in national currencies and/or euro (EUR). Monetary data for the G20 countries from the rest of the world have been converted into euro using current exchange rates. Data that are expressed in USD having been converted from national currencies using purchasing power parities have been left in dollars. Equally, time series for indicators expressed in constant prices have not been converted from the original currency (whether national currencies or USD).
Several indicators have been standardised by expressing their values relative to an appropriate measure of the size of a country, for example, in relation to the surface or land area, the total population or the size of the economy (GDP). Whenever possible these size measures have been extracted from the same source as the indicator itself; otherwise data have been extracted from United Nations data sources, namely surface and land area data from the Food and Agriculture Organisation, population data from the Department of Economic and Social Affairs, and GDP data from the Statistics Division.
Data presentation
Many of the data sources contain metadata that provide information on the status of particular values or data series. In order to improve readability, only the most significant information has been included as footnotes under the tables and figures. The following symbols are used, where necessary:
Italic |
data value is forecasted, provisional or estimated and is likely to change; |
billion |
a thousand million; |
:not available, confidential or unreliable value;
–not applicable.
Where appropriate, breaks in series are indicated in the footnotes provided under each table and figure.
|
The EU in the world 2013 — a statistical portrait |
|
13 |
|
Introduction
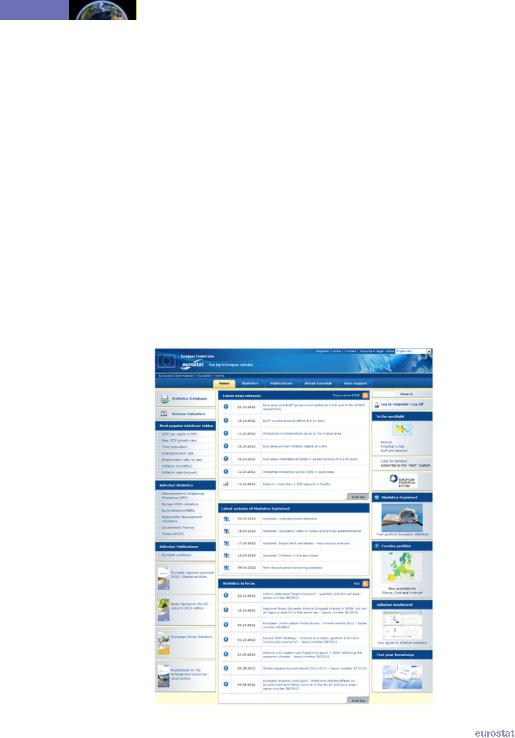
Access to Eurostat data
The simplest way to access Eurostat’s broad range of statistical information is through the Eurostat website (http://ec.europa.eu/eurostat). Eurostat provides users with free access to its databases and all of its publications in portable document format (PDF) via the Internet. The website is updated daily and gives access to the latest and most comprehensive statistical information available on: the EU and euro area; the EU Member States; the EFTA countries (Iceland, Liechtenstein, Norway and Switzerland); an acceding state (Croatia) and the candidate countries (Montenegro, Iceland, the former Yugoslav Republic of Macedonia, Serbia and Turkey).
Furthermore, a number of databases provide statistical information for key indicators related to other non-member countries, notably:
•potential candidate countries – Albania, Bosnia and Herzegovina, and Kosovo (under United Nations Security Council Resolution 1244/99);
•the European neighbourhood policy (ENP) countries
•ENP-East – Armenia, Azerbaijan, Belarus, Georgia, Moldova and Ukraine;
•ENP-South – Algeria, Egypt, Israel, Jordan, Lebanon, Libya, Morocco, the occupied Palestinian territory, Syria and Tunisia.
14 |
|
The EU in the world 2013 — a statistical portrait |
|
|

Introduction
Eurostat online data code(s) – easy access to the freshest data
Eurostat online data codes, such as tps00001 and nama_gdp_c (3), allow users easy access to the most recent data in the Eurobase database on Eurostat’s website. In this publication these online data codes are given as part of the source below each table and figure that use Eurobase data. In the PDF version of this publication, the reader is led directly to the freshest data when clicking on the hyper-links for each online data code. Readers can access the freshest data by typing a standardised hyper-link into a web browser, http://ec.europa.eu/eurostat/ product?code=<data_code>&mode=view, where <data_code> is to be replaced by the online data code printed under the tables or figure in question. Online data
codes can also be fed into the ‘Search’ function on Eurostat’s website, which is found in the upper-right corner of the Eurostat homepage, at
http://ec.europa.eu/eurostat. The results from such a search present related dataset(s) and possibly publication(s) and metadata. By clicking on these hyper-links users are taken to product page(s) (4), which provide some background information about each dataset/ publication or set of metadata.
Note that the data on the Eurostat’s website is frequently updated. Note also that the description above presents the situation as of the end of July 2012.
(3) There are two types of online data codes:
-Tables (accessed using the TGM interface) have 8-character codes, which consist of 3 or 5 letters – the first of which is ‘t’ – followed by 5 or 3 digits, e.g. tps00001 and tsdph220.
-Databases (accessed using the Data Explorer interface) have codes that use an underscore ‘_’ within the syntax of the code, e.g. nama_gdp_c and proj_08c2150p.
(4) The product page can also be accessed by using a hyper-link, for example, http://ec.europa.eu/eurostat/product?code=<data_code>, where <data_code> is to be replaced by the online data code in question.
|
The EU in the world 2013 — a statistical portrait |
|
15 |
|