Education and training
Education and training help foster economic growth, enhance productivity, contribute to people’s personal and social development, and help reduce social inequalities. In this light, education and training has the potential to play a vital role in both an economic and social context. Education statistics cover a range of subjects, including: expenditure, personnel, participation rates and attainment. The standards for international statistics on education are set by three international organisations: the Institute for Statistics of the United Nations Educational, Scientific and Cultural Organisation; the Organisation for Economic Cooperation and Development; and Eurostat.
Main findings
The level of educational enrolment depends on a wide range of factors, such as the age structure of the population, legal requirements concerning the start and end of compulsory education, and the availability of educational resources. The earliest starting age of compulsory education among G20 members (excluding the EU 27) was four years old in Mexico, while the latest was seven years old in Indonesia and South Africa; the range was similar among the EU 27 Member States. The youngest age for completing compulsory education in G20 members (excluding the EU 27) was 11 years old in Saudi Arabia while the oldest was 17 years old in Argentina and the United States; within the EU 27 the range was narrower, from 14 years old to 18 years old. Combining these two measures, the overall duration of compulsory education among the G20 members ranged from a total of six years in Saudi Arabia to 13 years in Argentina and among the EU 27 Member States from eight years to 13 years.
Public expenditure on education includes spending on schools, universities and other public and private institutions involved in delivering educational services or providing financial support to students. The cost of teaching increases significantly as a child moves through the education system, with expenditure per pupil/student considerably higher in universities than in primary schools.
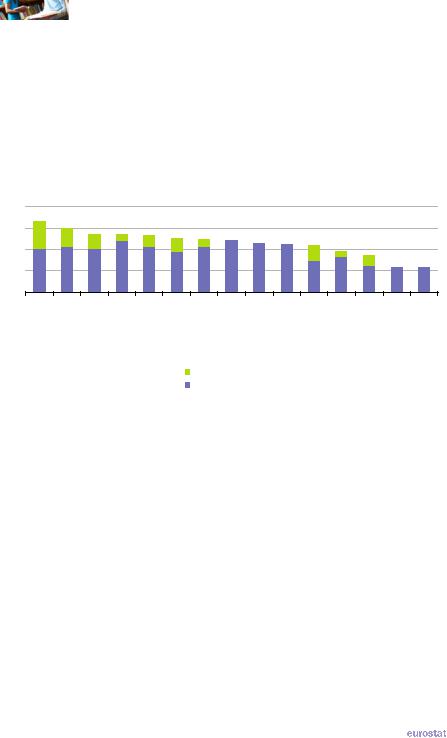
Comparisons between countries relating to levels of public expenditure on education are influenced by differences in price levels and by the number of students; Figure 4.1 provides
|
The EU in the world 2013 — a statistical portrait |
|
49 |
|
|
|
|
4 |
|
Education and training |
|
|
information on the level of expenditure relative to GDP – which is available for nearly all G20 members for public spending, while data on private expenditure is more limited. Based on the available data, education expenditure relative to GDP was notably higher in South Korea and the United States than in the other G20 members and notably lower in Russia, India, Indonesia and Turkey. In Argentina and South Africa public expenditure on education was equivalent to 6.0 % of GDP, followed by Brazil (5.7 %) and Saudi Arabia (5.6 %), just ahead of the EU 27 and the United States (both 5.4 %).
Figure 4.1: Analysis of expenditure on education, 2009(1)
(% of GDP)
10.0 |
|
|
|
|
|
|
|
|
|
|
|
|
|
|
7.5 |
|
|
|
|
|
|
|
|
|
|
|
|
|
|
5.0 |
|
|
|
|
|
|
|
|
|
|
|
|
|
|
2.5 |
|
|
|
|
|
|
|
|
|
|
|
|
|
|
0.0 |
|
|
|
|
Canada (2) |
EU-27 (3) |
SouthAfrica (4)(5) |
Brazil (4) |
(ArabiaSaudi2)(4) |
Japan (5) |
Russia (2) |
India (6) |
Indonesia (4) |
Turkey (4)(7) |
KoreaSouth |
StatesUnited |
Australia |
Argentina |
Mexico |
||||||||||
|
|
|
|
|
|
Private expenditure (8) |
|
|
|
|
|
|||
|
|
|
|
|
|
Public expenditure (9) |
|
|
|
|
|
|
||
(1) China, not available. (2) 2008. (3) Estimate. (4) Private expenditure, not available. (5) 2010. (6) Public expenditure, 2006; private expenditure, 2005. (7) 2006. (8) Private expenditure on educational institutions and administration. (9) Total public expenditure on education.
Source: Eurostat (online data code: educ_figdp) and the United Nations Educational, Scientific and Cultural Organisation (UIS: Education)
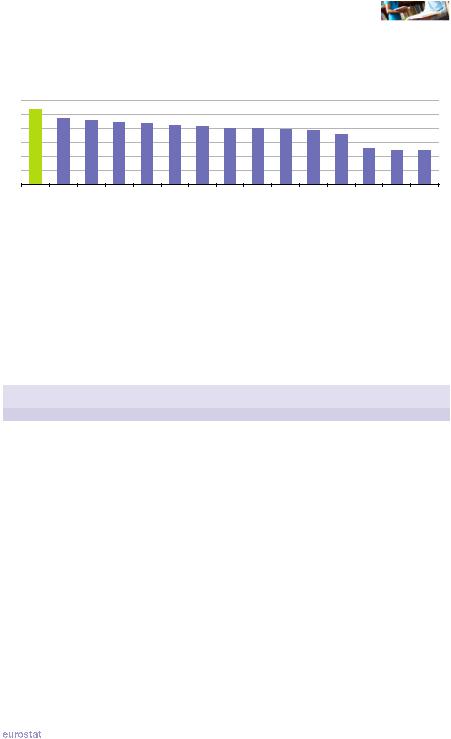
Average public spending per pupil or student in education can be related to GDP per capita as shown in Figure 4.2. This measure is similar to the relative size of public education expenditure compared with to GDP, but is adjusted for the proportion of pupils and students within the whole population, in other words the share of the population on which that relative expenditure is focused. Comparing the public expenditure part of Figure 4.1 with Figure 4.2 it can be seen that the EU 27’s public expenditure on education relative to GDP was the highest among the G20 members when the relatively small number of pupils and students within the whole population is taken into account; Canada and Japan also recorded high values for this indicator.
In 2010 there were more than 8.3 million teachers and academic staff in the EU 27’s education system, ranging from 1.1 million in pre-primary education through 2.2 million in primary and 3.7 million in secondary, to 1.4 million in tertiary education – see Table 4.1. In Brazil, the EU 27 and Mexico more than one tenth of teaching and academic staff were in pre-primary education, a share that fell to 2.7 % in Saudi Arabia. Around one quarter of teaching and academic staff in Canada and the United States were in tertiary education, a share that rose close to one third in Japan and exceeded this in South Korea; in the EU 27 this share was 16.6 %.
50 |
|
The EU in the world 2013 — a statistical portrait |
|
|
|
|
|
Education and training |
|
4 |
|
|
Figure 4.2: Public expenditure on education per pupil/student relative to GDP per capita, 2009(1)
(%) |
|
|
|
|
|
|
|
|
|
|
|
|
|
|
30 |
|
|
|
|
|
|
|
|
|
|
|
|
|
|
25 |
|
|
|
|
|
|
|
|
|
|
|
|
|
|
20 |
|
|
|
|
|
|
|
|
|
|
|
|
|
|
15 |
|
|
|
|
|
|
|
|
|
|
|
|
|
|
10 |
|
|
|
|
|
|
|
|
|
|
|
|
|
|
5 |
|
|
|
|
|
|
|
|
|
|
|
|
|
|
0 |
|
|
|
|
|
|
|
|
|
|
|
|
|
|
EU-27 |
Canada (2) |
Japan (3) |
KoreaSouth |
StatesUnited |
ArabiaSaudi (4) |
Brazil |
Argentina |
(AfricaSouth3)(5) |
Russia (4) |
Australia |
Mexico |
India (6) |
Indonesia (3) |
Turkey (6) |
(1) China, not available. (2) 2002.
(3) 2010. (4) 2008.
(5) Secondary education only. (6) 2006.
Source: Eurostat (online data code: educ_fipubin) and the United Nations Educational, Scientific and Cultural Organisation (UIS: Education)
Table 4.1: Number of teachers and academic staff, 2010
(1 000)
|
Pre-primary |
Primary |
Lower |
Upper |
Tertiary |
|
secondary |
secondary |
|||
|
|
|
|
||
EU-27 (1) |
1 087 |
2 151 |
1 824 |
1 894 |
1 381 |
Argentina (2) |
72 |
289 |
153 |
171 |
142 |
Australia |
: |
: |
: |
: |
: |
Brazil |
384 |
762 |
794 |
619 |
345 |
Canada (3) |
29 |
141 |
69 |
144 |
133 |
China |
1 106 |
5 997 |
3 658 |
2 759 |
1 557 |
India (4) |
738 |
3 388 |
1 913 |
2 339 |
539 |
Indonesia (5) |
340 |
1 900 |
915 |
725 |
271 |
Japan |
109 |
399 |
269 |
344 |
528 |
Mexico |
182 |
530 |
395 |
257 |
310 |
Russia (6) |
607 |
278 |
: |
: |
670 |
Saudi Arabia |
19 |
298 |
180 |
131 |
50 |
South Africa (6) |
: |
232 |
: |
: |
: |
South Korea (5) |
31 |
158 |
103 |
122 |
223 |
Turkey (6) |
29 |
: |
: |
197 |
101 |
United States |
541 |
1 795 |
933 |
825 |
1 439 |
(1) Estimate based on the latest available data (generally 2010) for each EU Member State with the exception of: Denmark, 2001 for all ISCED levels except primary (2010) and tertiary (not available); Estonia, 2004 for tertiary; Ireland, 2003 for lower secondary; Greece, 2007; Lithuania, not available for upper secondary; the Netherlands, not available for pre-primary and lower secondary.
(2) 2008. (3) 2000.
(4) Pre-primary, 2006; primary, 2004; tertiary, 2004. (5) Pre-primary, 2009.
(6) 2009.
Source: Eurostat (online data code: educ_pers1d) and the United Nations Educational, Scientific and Cultural Organisation (UIS: Education)
|
The EU in the world 2013 — a statistical portrait |
|
51 |
|

|
|
|
4 |
|
Education and training |
|
|
In 2010 there were around 86.6 million pupils in the EU 27 within pre-primary to upper secondary levels of education, of which 15 million (17.2 % of the total) were in pre-primary education, 28 million (32.3 %) were in primary education and 44 million (50.5 %) were in secondary education. Worldwide the total enrolment in these education levels was close to 1.4 billion, with 164 million (11.7 %) in pre-primary education, 691 million (49.4 %) in primary education and 543 million (38.9 %) in secondary education.
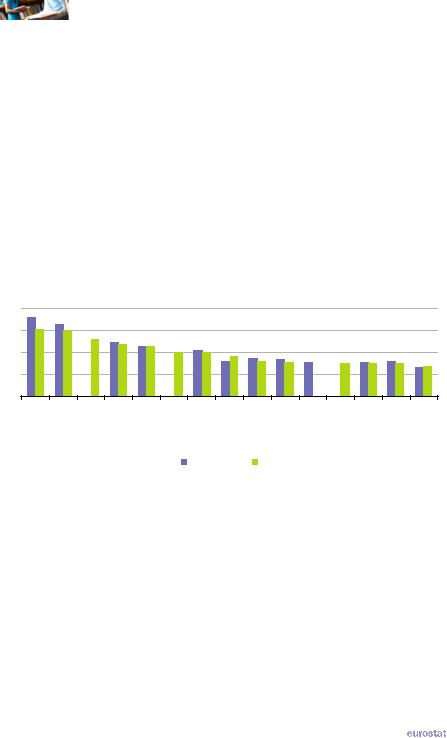
Figure 4.3 shows the pupil-teacher ratio for primary and secondary education among the G20 members: these ratios are calculated by dividing the number of full-time equivalent pupils and students by the number of full-time equivalent educational personnel. In 2009 the average number of pupils per teacher was generally lowest for upper secondary education and highest for primary education, with the main exceptions recorded for countries where the ratios were very similar across all three levels of education, such as in China, the United States and Saudi Arabia. Overall Saudi Arabia had the lowest pupil-teacher ratios and India the highest.
Figure 4.3: Pupil-teacher ratios, 2010(1)
(average number of pupils per teacher)
45
40
35
30
25 20
15 10
5
India (2) |
Mexico |
World |
SouthKorea |
Brazil |
China |
Canada (3) |
Japan |
UnitedStates |
Indonesia |
Primary |
|
|
 Lower secondary
 Upper secondary
EU-27 (4) |
Argentina (5) |
SaudiArabia |
SouthAfrica(6) |
Russia (6) |
Turkey (7) |
(1) Australia, not available. (2) Primary, 2004.
(3) Primary and lower secondary, 2000; upper secondary, 2008.
(4) Estimates for the purpose of this publication based on information available for the majority of EU Member States. (5) 2008.
(6) Primary, 2009; lower and upper secondary, not available.
(7) Upper secondary, 2009; primary and lower secondary, not available.
Source: Eurostat (online data codes: educ_iste and educ_pers1d) and the United Nations Educational, Scientific and Cultural Organisation (UIS: Education)
The EU has set a target of 95 % participation in early childhood education by 2015: this indicator relates to the share of the population aged between four years and the age when compulsory education starts which participates in early education. In 2000 the early childhood education rate in the EU 27 was 85.2 % and this had risen to 92.3 % by 2010 (see Table 4.2).
52 |
|
The EU in the world 2013 — a statistical portrait |
|
|

|
|
|
Education and training |
|
4 |
|
|
For the remaining G20 members, Table 4.2 shows a related indicator, namely the gross enrolment rate for pre-primary education, which is the number of pupils or students enrolled as a percentage of the population in the theoretical age group for pre-primary education: rates in excess of 100 % indicate that children outside of the theoretical age group were also enrolled. The gross enrolment rate for pre-primary education rose between 2000 and 2010 in all G20 members (for which data are available).
Worldwide there were more girls than boys in education in each of the three broad stages of education from primary to upper secondary, although the imbalance narrowed between 2000 and 2010, in large part due to major changes in the ratios for India. Within primary education the majority of G20 members recorded an increase in the gender ratio between 2000 and 2010 and in nearly all cases this reflected a move towards a more even gender balance. The EU 27 had a ratio of 1.06 boys for each girl, unchanged from 2000. The developments for lower and upper secondary education were less even. Several G20 members moved towards parity, for example, India from a position of under-participation of boys and South Africa from a position of underparticipation of girls. Equally some G20 members moved away from parity, notably Mexico and Argentina, both recording an increase in the above-parity ratio of boys to girls.
Table 4.2: School enrolments, 2000 and 2010
|
Gross enrolment |
Primary |
Lower secondary |
Upper secondary |
||||
|
rate for pre-primary |
|
|
|
|
|
|
|
|
|
(gender ratio: male / female) |
|
|
||||
|
education (%) |
|
|
|
||||
|
2000 |
2010 |
2000 |
2010 |
2000 |
2010 |
2000 |
2010 |
EU-27 (1) |
85.2 |
92.3 |
1.06 |
1.06 |
1.05 |
1.07 |
0.98 |
1.04 |
Argentina (2) |
60.0 |
74.1 |
0.98 |
0.99 |
1.01 |
1.05 |
1.11 |
1.26 |
Australia |
: |
78.4 |
1.00 |
0.99 |
1.01 |
0.97 |
0.99 |
0.93 |
Brazil (3) |
60.4 |
69.2 |
0.94 |
0.94 |
1.04 |
1.04 |
1.22 |
1.19 |
Canada (4) |
63.2 |
71.1 |
1.00 |
1.00 |
1.00 |
0.98 |
1.04 |
0.98 |
China |
38.3 |
53.9 |
: |
1.03 |
: |
1.06 |
: |
1.02 |
India (5) |
23.8 |
54.8 |
0.84 |
1.00 |
0.73 |
0.93 |
0.68 |
0.82 |
Indonesia |
23.9 |
43.4 |
0.97 |
1.02 |
0.96 |
1.02 |
0.94 |
0.98 |
Japan |
84.5 |
87.7 |
1.00 |
1.00 |
1.00 |
1.00 |
1.02 |
1.00 |
Mexico |
73.7 |
101.5 |
0.98 |
0.99 |
1.03 |
1.08 |
1.01 |
1.05 |
Russia (2) |
74.5 |
89.9 |
0.99 |
1.00 |
1.01 |
1.01 |
: |
0.91 |
Saudi Arabia |
: |
11.0 |
: |
0.99 |
: |
0.99 |
: |
0.90 |
South Africa (2) |
32.2 |
65.0 |
0.95 |
0.96 |
1.06 |
1.01 |
1.14 |
1.08 |
South Korea |
77.0 |
118.9 |
1.01 |
0.99 |
1.01 |
0.99 |
0.98 |
0.98 |
Turkey (2) |
6.3 |
21.7 |
0.92 |
0.98 |
0.80 |
0.94 |
0.64 |
0.89 |
United States |
59.1 |
69.0 |
0.98 |
0.99 |
0.99 |
1.01 |
1.04 |
1.01 |
World |
34.1 |
48.3 |
0.93 |
0.97 |
0.92 |
0.97 |
0.92 |
0.96 |
(1) Early childhood education rate instead of the gross enrolment rate for pre-primary education. (2) Data for 2009 instead of 2010.
(3) Data for 2005 instead of 2010. (4) Data for 2008 instead of 2010.
(5) Gender ratios, data for 2008 instead of 2010.
Source: Eurostat (online data codes: tps00179 and educ_enrl1tl) and the United Nations Educational, Scientific and Cultural Organisation (UIS: Education)
|
The EU in the world 2013 — a statistical portrait |
|
53 |
|
|
|
|
4 |
|
Education and training |
|
|
Tertiary education is generally provided by universities and other higher education institutions. In 2010 there were 19.8 million tertiary education students in the EU 27; worldwide, tertiary education enrolment was 177.7 million.
Figure 4.4 provides an analysis of tertiary students by sex which can be compared with the similar analysis for enrolments in primary and secondary education presented in Table 4.2. Between 2000 and 2010 the gender ratio in tertiary education fell in most of the G20 members (with data available for both years), with the exceptions of Saudi Arabia and Argentina (2000 to 2009) where there was an increase that represented a move towards parity. For South Korea, India, Japan, Indonesia and Mexico the fall in the ratio also represented a move towards parity, in other words the ratio moved downwards towards 1.00, although only in the case of Mexico did it reach this level. In the remaining G20 members, namely the EU 27, Australia, Brazil and the United States the fall in the ratio reinforced the position of more female than male students. In the EU 27 the ratio fell from 0.87 male students for each female student in 2000 to a ratio of 0.80 by 2010.
Figure 4.4: Gender balance of enrolment in tertiary education, 2010(1)
(gender ratio: male / female)
2.0 |
|
|
|
|
|
|
|
|
|
|
|
|
|
|
1.5 |
|
|
|
|
|
|
|
|
|
|
|
|
|
|
1.0 |
|
|
|
|
|
|
|
|
|
|
|
|
|
|
0.5 |
|
|
|
|
|
|
|
|
|
|
|
|
|
|
0.0 |
|
Turkey (2)(3) |
Japan |
Indonesia |
China (2) |
Mexico |
ArabiaSaudi |
EU-27 |
Australia |
Canada (4) |
Russia (2)(3) |
Brazil |
StatesUnited |
Argentina (3) |
KoreaSouth |
India |
|||||||||||||
|
|
|
|
|
|
2000 |
|
|
2010 |
|
|
|
|
|
(1) South Africa, not available. (2) 2000, not available.
(3) Data for 2009 instead of 2010. (4) 2010, not available.
Source: Eurostat (online data code: educ_enrl1tl) and the United Nations Educational, Scientific and Cultural Organisation (UIS: Education)
54 |
|
The EU in the world 2013 — a statistical portrait |
|
|

|
|
|
Education and training |
|
4 |
|
|
Within the EU 27 close to 4.4 million students graduated from tertiary education in 2010. Among these graduates in the EU 27 three fifths (60.1 %) were women. Across the G20 members only China (no data for India or South Africa – see Table 4.3) had more graduates than the EU 27 in 2010, with a total of 7.9 million, while the next largest graduate levels were recorded for the United States, Russia, Brazil and Japan. The share of women among all graduates was higher than that recorded for the EU 27 in just two G20 members, namely Argentina (64.4 %) and Brazil (60.5 %). Men were in the majority among graduates in Turkey, Indonesia, Japan, China and South Korea.
The combination of social sciences, business and law was the largest field of study for EU 27 graduates and for graduates in most of the other G20 members: Turkey was one exception as engineering, manufacturing and construction was the largest field of study; Saudi Arabia was the other exception where social sciences, business and law was only the fourth largest field of study with humanities and arts the most common.
Table 4.3: Graduates by broad field of study, 2010
|
(1 000) |
Share of |
science,Social &businesslaw |
welfare&Health |
Engineering,manufacconstruction&turing |
Humanities& arts |
Education& training |
mathematicsScience, computing& |
Services |
Agriculture& veterinary |
|
education |
|||||||||
|
Total |
women |
|
|
|
|
|
|
|
|
|
number of |
in total |
|
|
|
|
|
|
|
|
|
graduates |
number of |
|
|
|
|
|
|
|
|
|
from |
graduates |
|
|
|
|
|
|
|
|
|
tertiary |
within |
|
|
|
|
|
|
|
|
|
education |
tertiary |
|
|
|
|
|
|
|
|
|
|
(%) |
|
|
|
|
|
|
|
|
|
|
|
|
(% share of total graduates) (1) |
|
|
||||
EU-27 (2) |
4 357 491 |
60.1 |
34.9 |
15.2 |
12.3 |
11.8 |
10.9 |
9.1 |
4.2 |
1.6 |
Argentina (3) |
207 575 |
64.4 |
35.1 |
16.4 |
7.2 |
10.1 |
17.7 |
7.2 |
3.8 |
2.6 |
Australia (4) |
306 901 |
55.9 |
44.1 |
15.0 |
7.9 |
10.4 |
8.9 |
9.8 |
2.9 |
0.9 |
Brazil |
1 024 743 |
60.5 |
42.3 |
14.7 |
6.1 |
2.3 |
24.0 |
5.7 |
3.0 |
1.9 |
Canada (5) |
246 589 |
58.4 |
34.2 |
12.3 |
10.7 |
12.7 |
11.6 |
10.9 |
5.5 |
2.0 |
China |
7 863 663 |
49.0 |
: |
: |
: |
: |
: |
: |
: |
: |
India |
: |
: |
: |
: |
: |
: |
: |
: |
: |
: |
Indonesia (6) |
811 455 |
48.1 |
39.0 |
6.2 |
16.7 |
0.5 |
19.5 |
6.0 |
5.8 |
6.3 |
Japan |
966 635 |
48.5 |
28.6 |
13.5 |
18.6 |
16.3 |
7.6 |
3.3 |
9.5 |
2.7 |
Mexico |
465 813 |
54.4 |
47.0 |
8.9 |
19.4 |
4.0 |
12.5 |
6.1 |
0.6 |
1.6 |
Russia (7) |
2 064 473 |
: |
46.6 |
5.5 |
22.4 |
3.6 |
9.3 |
6.2 |
4.7 |
1.7 |
Saudi Arabia |
115 790 |
51.8 |
14.6 |
7.4 |
18.2 |
29.3 |
12.3 |
17.6 |
0.1 |
0.5 |
South Africa |
: |
: |
: |
: |
: |
: |
: |
: |
: |
: |
South Korea (7) |
595 127 |
49.7 |
20.9 |
14.1 |
23.9 |
17.8 |
8.3 |
7.5 |
6.3 |
1.2 |
Turkey (7) |
488 803 |
46.0 |
40.7 |
5.8 |
13.1 |
7.2 |
14.6 |
7.9 |
5.1 |
5.6 |
United States |
2 997 614 |
58.5 |
38.0 |
15.7 |
7.0 |
12.5 |
10.3 |
8.5 |
7.0 |
1.0 |
(1) Excluding unknown. (2) Including France, 2009. (3) 2009.
(4) 2008. (5) 2002.
(6) Share of women in the total number of graduates, 2004. (7) 2009.
Source: Eurostat (online data codes: educ_grad4 and educ_itertc) and
the United Nations Educational, Scientific and Cultural Organisation (UIS: Education)
|
The EU in the world 2013 — a statistical portrait |
|
55 |
|