Agriculture, forestry and fisheries
Issues related to agriculture, forestry and fishing go far beyond their simple economic function, reflecting the role of these sectors within society and the contribution and impact of their resources on the environment. Among the many issues of importance are the protection of the environment, sustainable practices for farming, forestry and fishing, food safety and security, animal welfare and broader perspectives relating to rural development.
Main findings
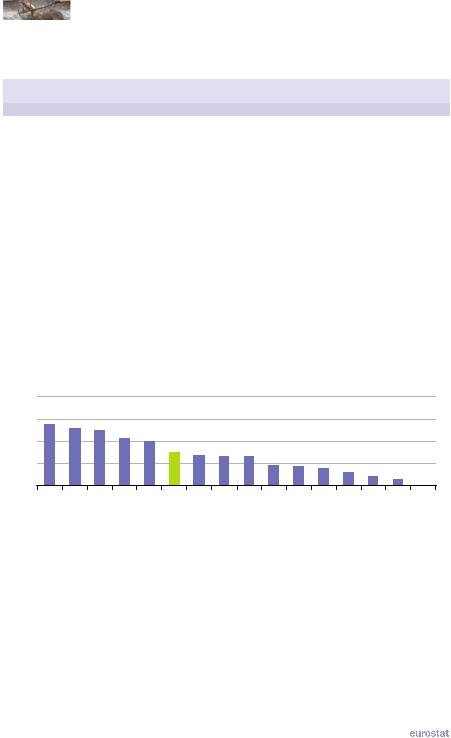
Forests occur under a huge variety of climatic, geographic, ecological and socio-economic conditions and are an essential part of the natural environment. They have an impact on water resources, act as a stabiliser for the Earth’s climate, provide shelter to animal and plant life, provide food, medicinal and cosmetic resources, genetic breeding stock, seeds for cultivation, wood and similar materials to be used for manufacturing, construction and as a fuel. Forestry also provides employment in many rural areas and diverse opportunities for outdoor recreation attracting tourists. Roundwood production in the EU 27 reached 420.8 million m³ in 2010, making the EU 27 the largest producer within the G20 – see Table 8.1. Forest cover within the EU extended to 156.9 million hectares in 2009, around 37.7 % of all land area.
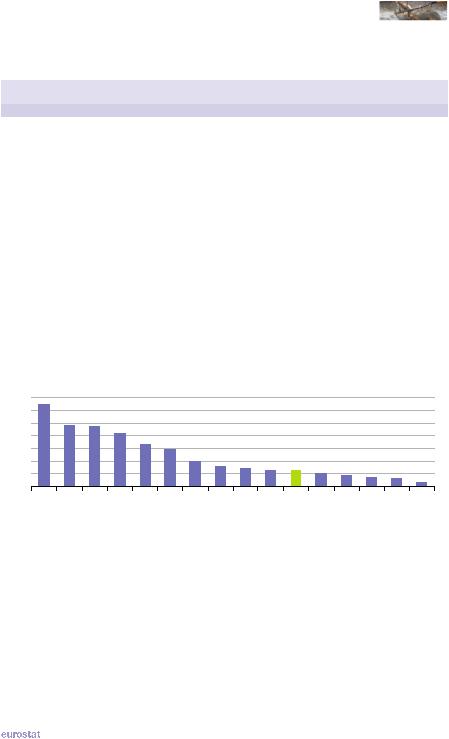
Aside from fish farming, fish are not owned until they have been caught, and so fish stocks continue to be regarded as a common resource, requiring collective management. This has led to a range of policies and international agreements that regulate the amount of fishing, as well as the types of fishing techniques and gear used to catch fish. The total fish catch in the EU 27 was 5.1 million tonnes in 2009, about one quarter less than in 2000 – see Table 8.2. The largest fish catch among G20 members in 2010 was reported for China, around three times the level for the EU 27. Aquaculture production in the EU 27 was 1.3 million tonnes in 2009, similar in size to the production in South Korea, but far behind that of China, Indonesia and India. Relative to population size, the EU 27’s combined fish catch and aquaculture production was 12.7 kg per inhabitant in 2009, a relatively low level compared with most G20 members.
|
The EU in the world 2013 — a statistical portrait |
|
85 |
|
|
|
|
8 |
|
Agriculture, forestry and fisheries |
|
|
Table 8.1: Production of roundwood and sawnwood, 2000-2010(1)
(1 000 m³)
|
|
Roundwood |
|
|
Sawnwood |
|
|
2000 |
2005 |
2010 |
2000 |
2005 |
2010 |
EU-27 (2) |
408 095 |
443 484 |
420 794 |
100 064 |
108 082 |
100 374 |
Argentina |
9 970 |
14 218 |
14 410 |
821 |
1 739 |
2 151 |
Australia |
31 181 |
31 933 |
29 788 |
4 093 |
4 687 |
5 094 |
Brazil |
235 402 |
255 743 |
271 501 |
21 600 |
23 557 |
25 080 |
Canada |
201 845 |
203 121 |
132 461 |
50 465 |
60 187 |
38 667 |
China |
323 646 |
302 037 |
291 251 |
7 104 |
18 398 |
37 685 |
India |
296 141 |
328 677 |
332 499 |
7 900 |
14 789 |
14 789 |
Indonesia |
137 830 |
123 791 |
113 849 |
6 500 |
4 330 |
4 169 |
Japan |
18 121 |
16 276 |
17 281 |
17 094 |
12 825 |
9 415 |
Mexico |
45 666 |
44 629 |
45 686 |
3 110 |
2 674 |
3 615 |
Russia |
158 100 |
185 000 |
173 000 |
20 000 |
23 913 |
28 312 |
Saudi Arabia |
179 |
213 |
247 |
: |
: |
: |
South Africa |
30 959 |
34 564 |
30 888 |
1 498 |
2 217 |
1 876 |
South Korea |
4 041 |
4 815 |
5 653 |
4 544 |
4 366 |
3 798 |
Turkey |
15 939 |
16 185 |
20 554 |
5 528 |
6 445 |
6 243 |
United States |
466 549 |
467 347 |
340 655 |
91 076 |
97 020 |
58 645 |
(1) May include estimates.
(2) Excluding French overseas departments and territories.
Source: Eurostat (online data codes: tag00072 and tag00073) and the Food and Agriculture Organisation of the United Nations (FAOSTAT: Forestry)
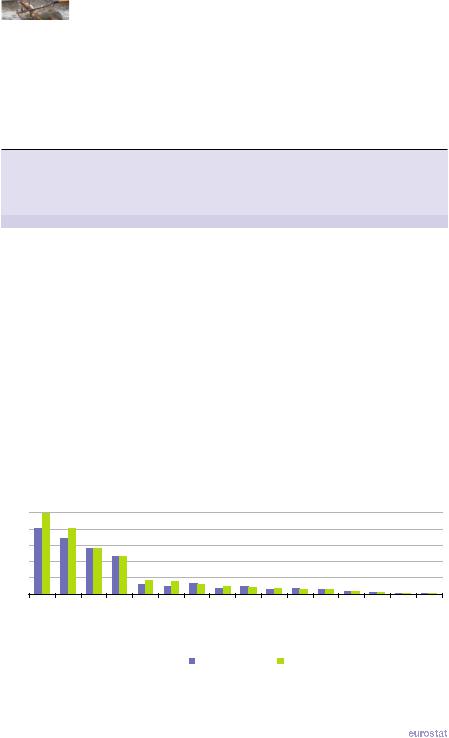
Figure 8.1: Forest as a share of land area, 2009
(%) |
|
|
|
|
|
|
|
|
|
|
|
|
|
|
|
100 |
|
|
|
|
|
|
|
|
|
|
|
|
|
|
|
75 |
|
|
|
|
|
|
|
|
|
|
|
|
|
|
|
50 |
|
|
|
|
|
|
|
|
|
|
|
|
|
|
|
25 |
|
|
|
|
|
|
|
|
|
|
|
|
|
|
|
0 |
|
|
|
|
|
|
|
|
|
|
|
|
|
|
|
Japan |
KoreaSouth |
Brazil |
Indonesia |
Russia |
EU-(271) |
Canada |
Mexico |
StatesUnited |
India |
China |
Australia |
Turkey |
Argentina |
AfricaSouth |
ArabiaSaudi |
(1) 2010; includes data for surface area instead of land area for some EU Member States; excluding French overseas departments and territories.
Source: Eurostat (online data code: for_area) and the Food and Agriculture Organisation of the United Nations (FAOSTAT: Resources)
86 |
|
The EU in the world 2013 — a statistical portrait |
|
|
|
|
|
|
|
|
|
|
|
|
|
|
Agriculture, forestry and fisheries |
|
|
8 |
||
|
|
|
|
|
|
|||
Table 8.2: Fish catches and aquaculture production, 2000-2010 |
|
|
|
|
||||
(tonnes) |
|
|
|
|
|
|
|
|
|
|
|
|
|
||||
|
|
Total catches |
|
Aquaculture production |
|
|||
|
2000 |
2005 |
2010 |
2000 |
2005 |
|
2010 |
|
EU-27 (1) |
6 789 271 |
5 641 307 |
5 067 891 |
1 398 507 |
1 260 590 |
|
1 299 635 |
|
Argentina |
921 800 |
929 937 |
811 749 |
1 784 |
2 430 |
|
2 665 |
|
Australia |
204 248 |
250 853 |
173 545 |
31 746 |
42 787 |
|
69 581 |
|
Brazil |
666 846 |
750 261 |
785 369 |
172 450 |
257 784 |
|
480 129 |
|
Canada |
1 032 686 |
1 145 624 |
965 254 |
127 665 |
154 587 |
|
160 924 |
|
China |
14 823 866 |
14 850 730 |
15 665 587 |
28 460 190 |
37 615 311 |
|
47 829 610 |
|
India |
3 726 427 |
3 691 364 |
4 694 970 |
1 942 531 |
2 973 126 |
|
4 653 093 |
|
Indonesia |
4 124 328 |
4 703 927 |
5 384 418 |
993 727 |
2 124 093 |
|
6 277 924 |
|
Japan |
5 193 558 |
4 419 008 |
4 141 312 |
1 291 735 |
1 254 143 |
|
1 151 080 |
|
Mexico |
1 349 770 |
1 325 771 |
1 525 665 |
53 918 |
133 131 |
|
126 240 |
|
Russia |
4 027 370 |
3 207 824 |
4 075 541 |
77 132 |
114 997 |
|
120 998 |
|
Saudi Arabia |
49 080 |
60 421 |
65 142 |
6 004 |
14 375 |
|
26 374 |
|
South Africa |
664 095 |
824 285 |
636 927 |
2 819 |
5 895 |
|
5 148 |
|
South Korea |
1 838 018 |
1 661 370 |
1 745 971 |
667 883 |
1 057 725 |
|
1 377 233 |
|
Turkey |
503 352 |
426 496 |
485 939 |
79 031 |
119 567 |
|
167 721 |
|
United States |
4 760 000 |
4 961 267 |
4 378 684 |
456 830 |
513 794 |
|
495 499 |
|
(1) Data for 2009 instead of 2010.
Source: Eurostat (online data codes: tag00075 and tag00076) and the Food and Agriculture Organisation of the United Nations (FishStatJ)
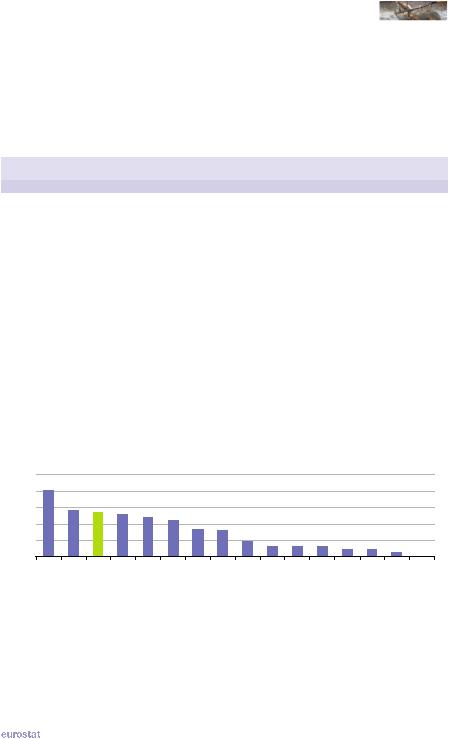
Figure 8.2: Production (fish catch and aquaculture) per inhabitant, 2010 (1)
(kg per inhabitant)
70 |
|
|
|
|
|
|
|
|
|
|
|
|
|
|
|
60 |
|
|
|
|
|
|
|
|
|
|
|
|
|
|
|
50 |
|
|
|
|
|
|
|
|
|
|
|
|
|
|
|
40 |
|
|
|
|
|
|
|
|
|
|
|
|
|
|
|
30 |
|
|
|
|
|
|
|
|
|
|
|
|
|
|
|
20 |
|
|
|
|
|
|
|
|
|
|
|
|
|
|
|
10 |
|
|
|
|
|
|
|
|
|
|
|
|
|
|
|
0 |
Indonesia |
China |
Japan |
Canada |
|
|
|
Mexico |
|
|
Australia |
|
India |
Brazil |
ArabiaSaudi |
KoreaSouth |
Russia |
Argentina |
StatesUnited |
AfricaSouth |
EU-(272) |
Turkey |
|||||||||
(1) Includes estimates. |
|
|
|
|
|
|
|
|
|
|
|
|
|
|
|
(2) 2009. |
|
|
|
|
|
|
|
|
|
|
|
|
|
|
|
Source: Eurostat (online data codes: tag00075 and tag00076), the Food and Agriculture Organisation of
the United Nations (FishStatJ and FAOSTAT: Population) and the United Nations Department of Economic and Social Affairs (Demographic statistics)
|
The EU in the world 2013 — a statistical portrait |
|
87 |
|
|
|
|
8 |
|
Agriculture, forestry and fisheries |
|
|
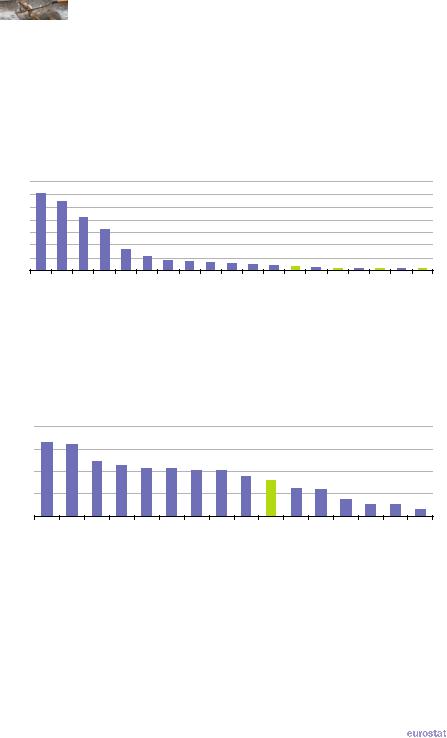
Less than one tenth of the labour force were active in agriculture, hunting, fishing and forestry in most G20 members in 2010, although this share rose to more than two fifths in Indonesia, more than one half in India, and reached three fifths in China. Among the four EU Member States that are members of the G20, the share of the labour force active in agriculture, hunting, fishing and forestry ranged from 1.5 % in the United Kingdom to 3.3 % in Italy — according to data from the United Nations’ Food and Agricultural Organisation.
Figure 8.3: Share of economically active population in agriculture, 2010 (1)
(%) |
|
|
|
|
|
|
|
|
|
|
|
|
|
|
|
|
|
|
70 |
|
|
|
|
|
|
|
|
|
|
|
|
|
|
|
|
|
|
60 |
|
|
|
|
|
|
|
|
|
|
|
|
|
|
|
|
|
|
50 |
|
|
|
|
|
|
|
|
|
|
|
|
|
|
|
|
|
|
40 |
|
|
|
|
|
|
|
|
|
|
|
|
|
|
|
|
|
|
30 |
|
|
|
|
|
|
|
|
|
|
|
|
|
|
|
|
|
|
20 |
|
|
|
|
|
|
|
|
|
|
|
|
|
|
|
|
|
|
10 |
|
|
|
|
|
|
|
|
|
|
|
|
|
|
|
|
|
|
0 |
India |
Indonesia |
|
|
Brazil |
|
|
|
|
ArabiaSaudi |
Australia |
Italy |
Japan |
|
Canada |
Germany |
StatesUnited |
|
China |
Turkey |
Mexico |
Russia |
Argentina |
AfricaSouth |
KoreaSouth |
France |
KingdomUnited |
(1) The economically active population in agriculture is the population engaged in or seeking work in agriculture, hunting, fishing or forestry; all values presented here are based on estimates of the FAO.
Source: the Food and Agriculture Organisation of the United Nations (FAOSTAT: Population)
Figure 8.4: Agricultural area as share of land area, 2009 (1)
(%) |
|
|
|
|
|
|
|
|
|
|
|
|
|
|
|
100 |
|
|
|
|
|
|
|
|
|
|
|
|
|
|
|
75 |
|
|
|
|
|
|
|
|
|
|
|
|
|
|
|
50 |
|
|
|
|
|
|
|
|
|
|
|
|
|
|
|
25 |
|
|
|
|
|
|
|
|
|
|
|
|
|
|
|
0 |
ArabiaSaudi |
India |
China |
Australia |
Mexico |
|
|
|
|
Brazil |
Indonesia |
KoreaSouth |
|
Japan |
Canada |
AfricaSouth |
Argentina |
Turkey |
StatesUnited |
EU-(272) |
Russia |
(1) Estimates.
(2) 2007, includes data for surface area instead of land area for some EU Member States.
Source: Eurostat (online data codes: demo_r_d3area and ef_lu_ovcropaa) and the Food and Agriculture Organisation of the United Nations (FAOSTAT: Resources)
88 |
|
The EU in the world 2013 — a statistical portrait |
|
|
|
|
|
Agriculture, forestry and fisheries |
|
8 |
|
|
The agricultural area of the EU 27 was 172.5 million hectares in 2007, approximately 10 % more than the forest area: the share of land area used for agriculture (shown in Figure 8.4) can be compared with the similar analysis for forests (see Figure 8.1). Around two fifths of the land area in the EU 27 in 2009 was used for agriculture, around half the share that was used in South Africa and Saudi Arabia. Among the G20 members the most extensive agricultural areas were recorded for China, Australia and the United States, all with more than 400 million hectares.
Around one tenth of the agricultural land in the EU 27 was equipped for irrigation in 2007. Irrigation supports the production of crops, and is essential in some areas. While irrigation may be expected to increase crop production, it can have harmful environmental impacts, for example, if the water used is not from a sustainable source. Among the G20 members the highest proportion of agricultural area equipped for irrigation was recorded in Japan, followed by South Korea and India. The EU 27, South Korea and Russia all recorded a fall in their share of agricultural area equipped for irrigation between 1999 and 2009 (2007 for the EU 27), whereas the largest increases in percentage point terms were in Japan and India.
The organic area includes land fully converted to organic farming and areas under conversion; organic farming places the highest emphasis on environmental and wildlife protection and animal welfare considerations. The organic area reached 3.1 % of the total agricultural area in the EU 27 (2007 data), a share comparable with the share recorded in 2009 for Argentina and Australia among the G20 members.
Table 8.3: Agricultural area, 1999 and 2009
|
|
|
|
|
Area equipped |
Organic area |
|
|
Agricultural area |
Agricultural area |
(% of |
||||
|
for irrigation |
||||||
|
(1 000 hectares) |
(% of land area) |
agricultural |
||||
|
(% of agricultural area) |
||||||
|
|
|
|
|
area) |
||
|
|
|
|
|
|
|
|
|
1999 |
2009 |
1999 |
2009 |
1999 |
2009 |
2009 |
EU-27 (1) |
172 794 |
172 485 |
40.1 |
40.1 |
10.6 |
9.8 |
3.1 |
Argentina |
128 680 |
140 500 |
47.0 |
51.3 |
1.2 |
1.2 |
3.1 |
Australia |
453 729 |
409 029 |
59.1 |
53.2 |
0.5 |
0.6 |
2.9 |
Brazil |
260 759 |
264 500 |
30.8 |
31.3 |
1.2 |
1.7 |
: |
Canada |
67 723 |
67 600 |
7.4 |
7.4 |
1.1 |
1.3 |
1.0 |
China |
532 267 |
524 321 |
57.1 |
56.2 |
10.1 |
12.3 |
: |
India |
180 950 |
179 963 |
60.9 |
60.5 |
32.6 |
37.1 |
0.7 |
Indonesia |
43 923 |
53 600 |
24.2 |
29.6 |
12.0 |
12.5 |
0.1 |
Japan |
5 271 |
4 609 |
14.5 |
12.6 |
50.4 |
54.4 |
0.2 |
Mexico |
106 300 |
102 833 |
54.7 |
52.9 |
5.9 |
6.1 |
0.3 |
Russia |
216 790 |
215 561 |
13.2 |
13.2 |
2.1 |
2.0 |
: |
Saudi Arabia |
173 785 |
173 435 |
80.8 |
80.7 |
1.0 |
1.0 |
0.0 |
South Africa |
99 640 |
99 228 |
82.0 |
81.7 |
1.5 |
1.5 |
0.1 |
South Korea |
1 954 |
1 854 |
19.8 |
19.1 |
44.9 |
43.5 |
: |
Turkey |
40 302 |
38 911 |
52.4 |
50.6 |
11.2 |
13.4 |
1.3 |
United States |
413 887 |
403 451 |
45.2 |
44.1 |
5.5 |
5.7 |
: |
(1) Data for 2003 instead of 1999; data for 2007 instead of 2009; includes data for surface area instead of land area for some EU Member States; area equipped for irrigation, excluding Germany and Estonia.
Source: Eurostat (online data codes: demo_r_d3area, ef_lu_ovcropaa, ef_ov_lusum and ef_mporganic) and the Food and Agriculture Organisation of the United Nations (FAOSTAT: Resources)
|
The EU in the world 2013 — a statistical portrait |
|
89 |
|
|
|
|
8 |
|
Agriculture, forestry and fisheries |
|
|
The production of a range of different vegetables across the G20 members for 2010 is presented in Table 8.4. Four G20 members together produced more than three quarters of the production of cereals among the G20 members in 2010, with production in China approaching 500 million tonnes – see Figure 8.5. More than half of the total meat production in Argentina and Australia
Table 8.4: Production of selected vegetables, 2010
(1 000 tonnes)
|
Asparagus |
Green beans |
Carrots and turnips |
Cucumbers and gherkins |
Egg-plant (aubergines) |
Lettuce and chicory |
Onions |
Peas |
Spinach |
Tomatoes |
|
|
|
|
|
|
|
|
|
|
|
EU-27 (1) |
271 |
1 006 |
5 068 |
2 484 |
754 |
3 360 |
6 137 |
658 |
550 |
15 711 |
Argentina |
9 |
4 |
224 |
: |
: |
: |
: |
26 |
: |
698 |
Australia |
7 |
28 |
267 |
12 |
: |
166 |
: |
42 |
9 |
472 |
Brazil |
: |
: |
: |
: |
: |
: |
: |
: |
: |
3 691 |
Canada |
6 |
47 |
414 |
52 |
: |
80 |
: |
43 |
6 |
493 |
China |
6 969 |
13 034 |
15 899 |
40 710 |
24 502 |
12 575 |
838 |
8 982 |
16 025 |
41 880 |
India |
: |
582 |
485 |
152 |
10 563 |
999 |
: |
3 029 |
: |
11 980 |
Indonesia |
: |
885 |
408 |
547 |
482 |
: |
: |
: |
152 |
892 |
Japan |
30 |
45 |
620 |
588 |
330 |
538 |
544 |
26 |
269 |
691 |
Mexico |
75 |
104 |
346 |
477 |
62 |
341 |
82 |
53 |
14 |
2 998 |
Russia |
: |
: |
1 303 |
1 162 |
: |
: |
: |
56 |
: |
2 000 |
Saudi Arabia |
: |
: |
47 |
381 |
56 |
: |
: |
: |
: |
490 |
South Africa |
1 |
24 |
142 |
21 |
: |
38 |
: |
12 |
: |
544 |
South Korea |
: |
: |
102 |
306 |
5 |
122 |
417 |
: |
88 |
325 |
Turkey |
0 |
588 |
533 |
1 739 |
847 |
358 |
165 |
90 |
218 |
10 052 |
United States |
36 |
53 |
1 324 |
883 |
64 |
3 955 |
: |
325 |
355 |
12 902 |
(1) Excluding Ireland; data for most EU Member States from 2011, some data from 2010 or earlier years; beans and peas, excluding the United Kingdom; gherkins, excluding Belgium; chicory, excluding Germany; onions, excluding Sweden; shallots, excluding several EU Member States; no recent data for turnips.
Source: Eurostat (online data code: apro_cpp_fruveg) and the Food and Agriculture Organisation of the United Nations (FAOSTAT: Production)
Figure 8.5: Production of cereals, 2000 and 2010(1)
(million tonnes)
500 |
|
|
|
|
|
|
|
|
|
|
|
|
|
|
|
400 |
|
|
|
|
|
|
|
|
|
|
|
|
|
|
|
300 |
|
|
|
|
|
|
|
|
|
|
|
|
|
|
|
200 |
|
|
|
|
|
|
|
|
|
|
|
|
|
|
|
100 |
|
|
|
|
|
|
|
|
|
|
|
|
|
|
|
0 |
StatesUnited |
EU-27 |
India |
Indonesia |
Brazil |
|
|
Canada |
Mexico |
Australia |
|
AfricaSouth |
Japan |
KoreaSouth |
ArabiaSaudi |
China |
Russia |
Argentina |
Turkey |
||||||||||||
|
|
|
|
|
|
2000 |
|
|
2010 |
|
|
|
|
|
|
(1) May include estimates.
Source: Eurostat (online data code: apro_cpp_crop) and the Food and Agriculture Organisation of the United Nations (FAOSTAT: Production)
90 |
|
The EU in the world 2013 — a statistical portrait |
|
|
|
|
|
Agriculture, forestry and fisheries |
|
8 |
|
|
was cattle meat, while similar levels of specialisation were recorded in China, South Korea and the EU 27 for pig meat, and in Saudi Arabia, Turkey, Indonesia, Brazil, South Africa and India for poultry meat. The EU 27 had the largest production of cows’ milk among G20 members in 2010 and the third highest ratio of production per inhabitant (see Figure 8.6).
Table 8.5: Meat and milk production, 2010
(1 000 tonnes)
|
Cattle |
Pig |
Poultry |
Sheep and |
Cows |
|
meat |
meat |
meat (1) |
goat meat (1) |
milk |
EU-27 (2) |
7 844 |
22 388 |
12 385 |
790 |
136 273 |
Argentina |
2 630 |
281 |
1 643 |
55 |
10 502 |
Australia |
2 108 |
336 |
923 |
581 |
9 023 |
Brazil |
6 977 |
3 078 |
11 142 |
111 |
31 668 |
Canada |
1 272 |
1 926 |
1 216 |
16 |
8 243 |
China |
6 236 |
51 677 |
16 987 |
3 943 |
36 036 |
India |
1 087 |
333 |
2 338 |
876 |
50 300 |
Indonesia |
421 |
637 |
1 678 |
131 |
913 |
Japan |
513 |
1 291 |
1 401 |
0 |
7 720 |
Mexico |
1 745 |
1 175 |
2 722 |
99 |
10 677 |
Russia |
1 711 |
2 308 |
2 580 |
188 |
31 895 |
Saudi Arabia |
31 |
: |
576 |
82 |
1 670 |
South Africa |
884 |
338 |
1 478 |
175 |
3 233 |
South Korea |
308 |
1 097 |
571 |
2 |
2 103 |
Turkey |
322 |
0 |
1 459 |
296 |
12 480 |
United States |
12 047 |
10 186 |
19 584 |
76 |
87 461 |
(1) May include estimates.
(2) Meat production, 2011; cows milk concerns collection and excludes data for Malta.
Source: Eurostat (online data codes: tag00044, tag00042, tag00043, tag00045 and tag00037) and the Food and Agriculture Organisation of the United Nations (FAOSTAT: Production)
Figure 8.6: Milk production per inhabitant, 2010
(kg per inhabitant)
500 |
400 |
300 |
200 |
100 |
0 |
Australia |
UnitedStates |
EU-27 (1) |
Argentina |
Canada(2) |
Russia |
Turkey |
Brazil |
Mexico |
SouthAfrica |
Japan |
SaudiArabia(2) |
SouthKorea(2) |
India(2) |
China |
Indonesia(2) |
(1) Milk collection; excluding Malta. (2) Estimates.
Source: Eurostat (online data code: tag00037) and the Food and Agriculture Organisation of the United Nations (FAOSTAT: Production and population).
|
The EU in the world 2013 — a statistical portrait |
|
91 |
|