
Transport
An efficient and well-functioning passenger and freight transport system is often viewed as being vital for business and individuals. Some of the key issues related to transport are its environmental impact, efficiency and safety. The transport statistics presented in this publication focus on the weight of freight and number of passengers that are moved, as well as providing some information on the stock of passenger cars. The level of transport, in particular international transport, can be related to a wide variety of issues, including trade liberalisation, globalisation, higher motorisation rates, and tourism.
Main findings
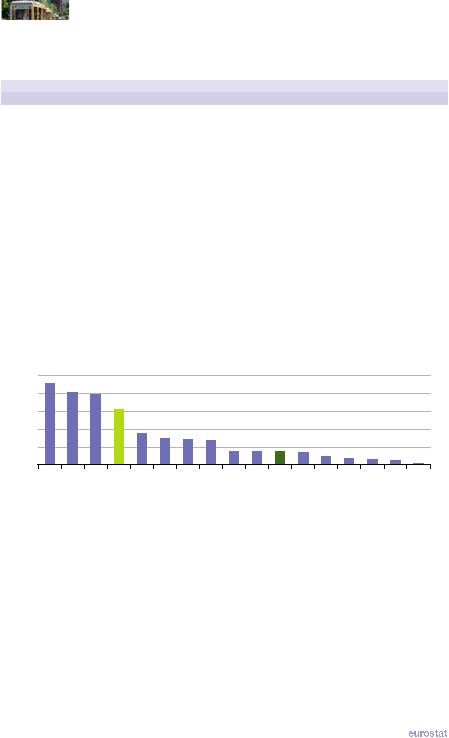
Concerning the use of rail transport (see Figure 10.1 and Table 10.1), the G20 members can be split into several groups depending on the extent to which this mode is used for passenger and/ or freight transport. Saudi Arabia, Indonesia and to a lesser extent Turkey had a relatively low use of rail transport in general. In Australia, Canada and the United States, as well as in Mexico to a lesser extent, rail transport was focused mainly on freight transport while passenger transport was dominant in India, Japan and South Korea. A relatively high use of rail transport for both freight and passengers was observed in China, Russia, South Africa and the EU 27.
Comparing 2005 with 2010, large percentage increases in passenger rail services were recorded in Mexico, China and India. Rail freight transport in 2010 was lower than it had been in 2005 in the EU 27 and several other G20 members, reflecting the impact of the financial and economic crisis, while in India and Saudi Arabia its was relatively higher.
The world’s maritime fleet (see Table 10.2) increased from 822 million DWT in 2002 to 1 534 million DWT in 2012, equivalent to average growth of 6.4 % per year. During this period the maritime fleets of South Africa, Brazil, Russia and Australia contracted while most other G20 members recorded an expansion, notably in Canada, Argentina, China and South Korea. The EU 27’s maritime fleet grew by 4.5 % per year during this ten-year period and remained the largest among the G20 members in 2012. It should be noted that there are several countries outside of the G20 that accounted for a large share of the world maritime fleet in 2012, notably Panama (21.4 %), Liberia (12.4 %) and the Marshall Islands (8.0 %) – all associated with flags of convenience.
|
The EU in the world 2013 — a statistical portrait |
|
101 |
|

10  Transport
Figure 10.1: Rail passenger transport, 2010(1)
(passenger-km per inhabitant)
2 000 |
1 500 |
1 000 |
500 |
0 |
Japan |
Russia |
EU-27(2) |
India |
SouthKorea |
China |
SouthAfrica |
Canada |
Turkey |
Australia |
Indonesia(3) |
UnitedStates |
SaudiArabia |
Mexico |
(1) Data for some countries may be limited to International Union of Railways (UIC) members; Argentina and Brazil, not available. (2) 2009, excluding Luxembourg and the Netherlands.
(3) 2008.
Source: Eurostat (online data code: rail_pa_total) and the World Bank (World Development Indicators and Global Development Finance)
Table 10.1: Rail transport indicators, 2005 and 2010(1)
|
|
Rail passenger transport |
|
Rail freight transport |
|
|||||
|
|
(passenger-km) (2) |
|
|
|
(tonne-km) (3) |
|
|||
|
|
million |
|
per |
|
million |
|
per |
||
|
|
|
inhabitant |
|
|
inhabitant |
||||
|
|
|
|
|
|
|
|
|
||
|
2005 |
|
2010 |
|
2010 |
2005 |
|
2010 |
|
2010 |
EU-27 |
357 527 |
|
388 037 |
|
803 |
399 896 |
|
389 680 |
|
777 |
Argentina |
6 979 |
|
: |
|
: |
12 628 |
|
12 025 |
|
298 |
Australia |
1 290 |
|
1 500 |
|
67 |
46 164 |
|
64 172 |
|
2 878 |
Brazil |
: |
|
: |
|
: |
221 211 |
|
267 700 |
|
1 373 |
Canada |
2 790 |
|
2 875 |
|
84 |
338 661 |
|
322 741 |
|
9 457 |
China |
583 320 |
|
791 158 |
|
591 |
1 934 612 |
|
2 451 185 |
|
1 832 |
India |
575 702 |
|
903 465 |
|
738 |
407 398 |
|
600 548 |
|
490 |
Indonesia |
25 535 |
|
14 344 |
|
61 |
4 698 |
|
4 390 |
|
19 |
Japan |
239 246 |
|
244 235 |
|
1 916 |
21 900 |
|
20 432 |
|
160 |
Mexico |
73 |
|
178 |
|
2 |
54 387 |
|
71 136 |
|
643 |
Russia |
164 262 |
|
139 028 |
|
981 |
1 801 601 |
|
2 011 308 |
|
14 189 |
Saudi Arabia |
393 |
|
337 |
|
12 |
1 192 |
|
1 748 |
|
64 |
South Africa |
: |
|
18 865 |
|
377 |
108 513 |
|
113 342 |
|
2 267 |
South Korea |
31 004 |
|
33 027 |
|
676 |
10 108 |
|
9 452 |
|
193 |
Turkey |
5 036 |
|
5 491 |
|
75 |
8 939 |
|
11 030 |
|
152 |
United States |
8 869 |
|
9 518 |
|
31 |
2 717 513 |
|
2 468 738 |
|
7 980 |
(1) Data for some countries may be limited to International Union of Railways (UIC) members.
(2) EU 27: data for 2005 excluding Bulgaria and the Netherlands; EU 27: data for 2009 instead of 2010 excluding Luxembourg and the Netherlands; Indonesia: data for 2008 instead of 2010.
(3) EU 27: data for 2005 excluding Belgium and Bulgaria; EU 27: data for 2010 excluding Luxembourg; Argentina: data for 2006 instead of 2005; Indonesia and Mexico: data for 2008 instead of 2010.
Source: Eurostat (online data codes: rail_pa_total and rail_go_typeall) and the World Bank (World Development Indicators and Global Development Finance)
102 |
|
The EU in the world 2013 — a statistical portrait |
|
|

Transport  10
10
The EU plays an important part in international maritime freight transport and this can be seen from Table 10.3. Just over one fifth of the goods loaded and unloaded worldwide in 2010 were handled in EU 27 ports. The weight of maritime freight coming into the EU 27 was around 1.6 times the weight of outward freight, reflecting in part the different types of goods entering and leaving the EU 27 by sea.
Table 10.2: Maritime fleet and ports, 2002, 2010 and 2012
|
Maritime fleet size |
Largest port (2010) |
|
|
|
(deadweight tonnage, 1 000 DWT) (1) |
Name of port and quantity of goods handled |
||
|
2002 |
2012 |
(1 000 tonnes) |
|
EU-27 |
197 032 |
307 204 |
Rotterdam |
395 763 |
Argentina |
312 |
818 |
San Lorenzo-Puerto San Martín |
42 694 |
Australia |
2 319 |
1 815 |
Port Hedland |
198 997 |
Brazil |
5 959 |
3 360 |
Tubarão |
132 031 |
Canada |
1 309 |
3 532 |
Vancouver |
118 379 |
China |
24 048 |
58 195 |
Shanghai |
534 371 |
India |
10 645 |
16 141 |
Jawaharlal Nehru (Nhava Sheva) |
64 320 |
Indonesia |
: |
13 512 |
Tanjung Priok |
39 997 |
Japan |
17 913 |
23 572 |
Nagoya |
185 703 |
Mexico |
1 180 |
2 071 |
Lázaro Cárdenas |
29 451 |
Russia |
9 564 |
7 413 |
Novorossiysk |
81 603 |
Saudi Arabia |
1 386 |
2 333 |
Jeddah |
49 164 |
South Africa |
359 |
101 |
Richards Bay |
85 148 |
South Korea (2) |
9 425 |
19 157 |
Busan |
262 963 |
Turkey |
9 270 |
9 535 |
İzmit (Kocaeli) |
37 735 |
United States |
11 699 |
11 997 |
South Louisiana |
214 337 |
World |
822 011 |
1 534 019 |
Shanghai |
534 371 |
(1) Deadweight tonnage is the weight measure of a vessel’s carrying capacity. It includes cargo, fuel and stores. (2) Largest port based on revenue tons (1 revenue ton is equal to 1 tonne or 1 cubic metre).
Source: Eurostat (online data code: mar_mg_aa_pwhd), the United Nations Conference on Trade and Development (Maritime transport indicators) and the American association of port authorities (World port rankings)
Table 10.3: Maritime freight transport handled, 2006 to 2010
|
|
|
|
Weight of goods handled |
|
|
||
|
|
|
(million tonnes) |
|
|
(tonnes per |
||
|
|
|
|
|
inhabitant) |
|||
|
|
|
|
|
|
|
|
|
|
2006 |
2007 |
|
2008 |
|
2009 |
2010 |
2010 |
EU-27 |
|
|
|
|
|
|
|
|
Total |
3 836 |
3 938 |
|
3 919 |
|
3 446 |
3 641 |
7.3 |
Inwards |
2 437 |
2 503 |
|
2 500 |
|
2 135 |
2 250 |
4.5 |
Outwards |
1 399 |
1 434 |
|
1 419 |
|
1 311 |
1 391 |
2.8 |
World |
|
|
|
|
|
|
|
|
Loaded and unloaded |
15 579 |
16 174 |
|
16 516 |
|
15 690 |
16 786 |
2.4 |
Source: Eurostat (online data code: mar_go_aa) and the United Nations Conference on Trade and Development (Review of maritime transport, 2011)
|
The EU in the world 2013 — a statistical portrait |
|
103 |
|

10  Transport
Among the G20 members, reliance on cars for passenger transport was highest in 2009 in Australia, the EU 27, Japan, the United States and Canada – all of which had more than 400 cars for every 1 000 inhabitants; the lowest ratios were recorded in Indonesia, China and India.
Figure 10.2: Number of passenger cars relative to population, 2009 (1)
(number per 1 000 inhabitants)
600 |
|
|
|
|
|
|
|
|
|
|
|
|
|
|
500 |
|
|
|
|
|
|
|
|
|
|
|
|
|
|
400 |
|
|
|
|
|
|
|
|
|
|
|
|
|
|
300 |
|
|
|
|
|
|
|
|
|
|
|
|
|
|
200 |
|
|
|
|
|
|
|
|
|
|
|
|
|
|
100 |
|
|
|
|
|
|
|
|
|
|
|
|
|
|
0 |
|
|
|
|
|
|
|
|
|
|
|
|
|
|
Australia |
EU-(272) |
Japan |
StatesUnited |
Canada |
KoreaSouth |
Russia |
Mexico |
Brazil |
World |
AfricaSouth |
Turkey |
Indonesia |
China |
India |
(1) Argentina and Saudi Arabia, not available. (2) Estimate.
Source: Eurostat (online data code: tsdpc340) and the World Bank
(World Development Indicators and Global Development Finance)
Table 10.4: Road transport indicators, 2004 and 2009
|
Passenger cars |
|
Road freight transport |
|
|||
|
|
|
(tonne-km) (1) |
|
|||
|
(number per 1 000 inhabitants) |
|
|
|
|
|
|
|
million |
|
|
|
per inhabitant |
||
|
|
|
|
|
|
||
|
2004 |
2009 |
2004 |
|
2009 |
|
2009 |
EU-27 |
448 |
473 |
1 692 670 |
|
1 755 375 |
|
3 501 |
Argentina |
: |
: |
: |
|
: |
|
: |
Australia |
528 |
550 |
162 300 |
|
189 847 |
|
8 831 |
Brazil |
136 |
178 |
: |
|
: |
|
: |
Canada |
448 |
420 |
: |
|
129 600 |
|
3 890 |
China |
12 |
34 |
784 090 |
|
3 718 882 |
|
2 793 |
India |
9 |
12 |
: |
|
: |
|
: |
Indonesia |
21 |
45 |
: |
|
: |
|
: |
Japan |
441 |
454 |
327 632 |
|
334 667 |
|
2 624 |
Mexico |
131 |
191 |
199 800 |
|
211 600 |
|
1 889 |
Russia |
168 |
233 |
194 000 |
|
180 135 |
|
1 270 |
Saudi Arabia |
442 |
: |
: |
|
: |
|
: |
South Africa |
92 |
110 |
: |
|
: |
|
: |
South Korea |
221 |
267 |
12 545 |
|
12 545 |
|
257 |
Turkey |
77 |
95 |
156 853 |
|
176 455 |
|
2 456 |
United States |
466 |
439 |
2 116 532 |
|
: |
|
: |
World |
110 |
125 |
: |
|
: |
|
: |
(1) EU 27, data for 2010 instead of 2009, 2010 data excluding Malta, 2004 data excluding Bulgaria, Romania and Malta; Australia and Canada, data for 2008 instead of 2009; Russia, data for 2005 instead of 2004.
Source: Eurostat (online data codes: tsdpc340 and road_go_ta_tott) and the World Bank (World Development Indicators and Global Development Finance)
104 |
|
The EU in the world 2013 — a statistical portrait |
|
|

Transport  10
10
Worldwide, the ratio of passenger cars to population increased from 110 cars per 1 000 inhabitants in 2004 to 125 per 1 000 inhabitants in 2009. This general upward trend was observed in all G20 members except for Canada and the United States where the ratio fell by 28 and by 27 passenger cars per 1 000 persons (-6.2 % and -5.8 % respectively) over the five-year period under consideration. In percentage terms, the fastest growth in the ratio of passenger cars to population was recorded in China and India; ratios for both of these countries more than doubled, reflecting, in part, their low rates in 2004. The number of passenger cars per 1 000 inhabitants increased between 2004 and 2009 by 65 passenger cars in Russia; the next largest absolute increases were recorded in Mexico (an extra 60 passenger cars per 1 000 persons), South Korea (46) and Brazil (42).
The amount of road freight transport was particularly high in Australia relative to the size of its population. It should be noted that the road freight transport indicators presented here are based on the combination of the weight (in tonnes) and the distance (in kilometres) that is transported: the very high figure in Australia therefore reflects not only an extensive use of road freight transport, but also the large distances involved in transporting goods around a large and sparsely populated land area. Road freight transport was notably less common in South Korea than in the other G20 members for which data are available. Comparing 2004 with 2009, the most notable development was the increase in the amount of Chinese road freight: this figure almost quintupled (see Table 10.4), increasing at an annual average rate of 36.5 %.
The data available in Tables 10.1 and 10.4 allow a comparison of the relative importance of road and rail freight transport among several G20 members. The quantity of freight (tonnekilometres) transported by road in Japan and Turkey was approximately 16 times as high as that transported by rail; in the EU 27 the level of road freight transport was about 4.5 times as high as rail freight transport, while in Russia and Canada the volume of rail freight transport exceeded that for road freight.
Figure 10.3: Road freight transport, 2009(1)
(tonne-km per inhabitant)
10 000 |
|
|
|
|
|
|
|
|
7 500 |
|
|
|
|
|
|
|
|
5 000 |
|
|
|
|
|
|
|
|
2 500 |
|
|
|
|
|
|
|
|
0 |
|
|
|
|
|
|
|
|
(Australia2) |
(Canada2) |
EU-(273) |
China |
Japan |
Turkey |
Mexico |
Russia |
KoreaSouth |
(1) Argentina, Brazil, India, Indonesia, Saudi Arabia, South Africa and the United States, not available. (2) 2008.
(3) 2010; excluding Malta.
Source: Eurostat (online data code: road_go_ta_tott) and the World Bank (World Development Indicators and Global Development Finance)
|
The EU in the world 2013 — a statistical portrait |
|
105 |
|
|
|
|
|
|
|
10 |
|
Transport |
|
|
|
|
|
|
|
|
|
Table 10.5: Number of air passengers carried, 2007 to 2010 |
|
|
|||
(million) |
|
|
|
|
|
|
|
|
|
|
|
|
|
2007 |
2008 |
2009 |
2010 |
|
EU-27 |
792.7 |
798.3 |
751.1 |
776.9 |
|
Argentina |
7.0 |
6.1 |
5.7 |
10.0 |
|
Australia |
48.7 |
51.5 |
50.0 |
45.3 |
|
Brazil |
45.3 |
58.8 |
67.9 |
77.3 |
|
Canada |
52.1 |
53.7 |
52.6 |
67.3 |
|
China |
183.6 |
191.0 |
229.1 |
267.7 |
|
India |
51.9 |
49.9 |
54.4 |
64.1 |
|
Indonesia |
30.4 |
29.8 |
27.4 |
35.3 |
|
Japan |
99.8 |
97.0 |
86.9 |
94.2 |
|
Mexico |
21.0 |
18.8 |
15.7 |
13.6 |
|
Russia |
33.2 |
37.9 |
34.4 |
56.8 |
|
Saudi Arabia |
17.1 |
16.7 |
17.5 |
19.0 |
|
South Africa |
12.9 |
13.1 |
12.5 |
16.8 |
|
South Korea |
36.7 |
36.1 |
34.2 |
42.8 |
|
Turkey |
22.9 |
25.5 |
31.3 |
51.6 |
|
United States |
744.3 |
701.8 |
679.4 |
707.4 |
|
World |
2 209.1 |
2 208.2 |
2 270.9 |
2 595.4 |
Source: Eurostat (online data code: avia_paoc) and the World Bank
(World Development Indicators and Global Development Finance)
Figure 10.4: Number of air passengers carried, 2010
(per 1 000 inhabitants)
2 500 |
|
|
|
|
|
|
|
|
|
|
|
|
|
|
|
|
2 000 |
|
|
|
|
|
|
|
|
|
|
|
|
|
|
|
|
1 500 |
|
|
|
|
|
|
|
|
|
|
|
|
|
|
|
|
1 000 |
|
|
|
|
|
|
|
|
|
|
|
|
|
|
|
|
500 |
|
|
|
|
|
|
|
|
|
|
|
|
|
|
|
|
0 |
|
|
|
|
|
|
|
|
|
|
|
|
|
|
|
|
StatesUnited |
Australia |
Canada |
EU-27 |
KoreaSouth |
Japan |
Turkey |
ArabiaSaudi |
Russia |
Brazil |
World |
AfricaSouth |
Argentina |
China |
Indonesia |
Mexico |
India |
Source: Eurostat (online data code: avia_paoc) and the World Bank
(World Development Indicators and Global Development Finance)
106 |
|
The EU in the world 2013 — a statistical portrait |
|
|

Transport  10
10
Worldwide, the number of air passengers carried in 2010 was around 2.6 billion, an increase of 14.3 % compared with 2009. In the EU 27 air passenger numbers in 2010 reached 777 million, an increase of 3.4 % compared with 2009, and equivalent to 29.9 % of the world total. The United States had 707 million passengers (27.3 % of the world total) and China 268 million (10.3 %). Several G20 members recorded a fall in their respective number of air passengers in 2008 and/or 2009, notably Mexico, Argentina and Japan – however, all of these, except Mexico, rebounded in 2010. Despite growth in 2010, the number of air passengers carried in Japan, the United States and the EU 27 in 2010 remained below its 2007 level. By contrast, the number of air passengers carried in Turkey more than doubled between 2007 and 2010.
Relative to the size of the population, the number of air passengers was highest in the United States, just ahead of Australia, Canada and the EU 27, all with more passengers carried than the overall size of their population (see Figure 10.4). By contrast, China, Indonesia, Mexico and India recorded the lowest number of air passengers relative to their overall population size.
In terms of passenger numbers, the busiest airport in the world was Hartsfield-Jackson Atlanta in the United States, with 88.0 million passengers, followed by Beijing airport in China with 73.9 million and Chicago O’Hare international airport in the United States with 67.0 million. London Heathrow in the United Kingdom was the busiest airport in the EU 27 with 65.7 million passengers, making it the fourth largest in the world.
Table 10.6: Largest airports for passengers, 2010
|
Name |
Passenger numbers |
|
(millions) |
|
|
|
|
EU-27 |
London Heathrow |
65.7 |
Argentina |
Ministro Pistarini (Buenos Aires) |
6.2 |
Australia |
Sydney |
35.7 |
Brazil |
São Paulo-Guarulhos |
26.8 |
Canada |
Toronto Pearson |
31.9 |
China |
Beijing |
73.9 |
India |
Indira Gandhi (Delhi) |
28.5 |
Indonesia |
Soekarno-Hatta (Jakarta) |
43.7 |
Japan |
Haneda (Tokyo) |
64.2 |
Mexico |
Benito Juárez ( Mexico City) |
15.6 |
Russia |
Moscow Domodedovo |
22.3 |
Saudi Arabia |
King Abdulaziz (Jeddah) |
17.9 |
South Africa |
OR Tambo (Johannesburg) |
18.4 |
South Korea |
Incheon (Seoul) |
33.5 |
Turkey |
Atatürk (Istabul) |
32.1 |
United States |
Hartsfield-Jackson (Atlanta) |
88.0 |
Source: Eurostat (online data code: avia_paoa), national civil aviation authorities and information from websites of individual airports
|
The EU in the world 2013 — a statistical portrait |
|
107 |
|