- •CONTENTS
- •Preface
- •To the Student
- •Diagnostic Tests
- •1.1 Four Ways to Represent a Function
- •1.2 Mathematical Models: A Catalog of Essential Functions
- •1.3 New Functions from Old Functions
- •1.4 Graphing Calculators and Computers
- •1.6 Inverse Functions and Logarithms
- •Review
- •2.1 The Tangent and Velocity Problems
- •2.2 The Limit of a Function
- •2.3 Calculating Limits Using the Limit Laws
- •2.4 The Precise Definition of a Limit
- •2.5 Continuity
- •2.6 Limits at Infinity; Horizontal Asymptotes
- •2.7 Derivatives and Rates of Change
- •Review
- •3.2 The Product and Quotient Rules
- •3.3 Derivatives of Trigonometric Functions
- •3.4 The Chain Rule
- •3.5 Implicit Differentiation
- •3.6 Derivatives of Logarithmic Functions
- •3.7 Rates of Change in the Natural and Social Sciences
- •3.8 Exponential Growth and Decay
- •3.9 Related Rates
- •3.10 Linear Approximations and Differentials
- •3.11 Hyperbolic Functions
- •Review
- •4.1 Maximum and Minimum Values
- •4.2 The Mean Value Theorem
- •4.3 How Derivatives Affect the Shape of a Graph
- •4.5 Summary of Curve Sketching
- •4.7 Optimization Problems
- •Review
- •5 INTEGRALS
- •5.1 Areas and Distances
- •5.2 The Definite Integral
- •5.3 The Fundamental Theorem of Calculus
- •5.4 Indefinite Integrals and the Net Change Theorem
- •5.5 The Substitution Rule
- •6.1 Areas between Curves
- •6.2 Volumes
- •6.3 Volumes by Cylindrical Shells
- •6.4 Work
- •6.5 Average Value of a Function
- •Review
- •7.1 Integration by Parts
- •7.2 Trigonometric Integrals
- •7.3 Trigonometric Substitution
- •7.4 Integration of Rational Functions by Partial Fractions
- •7.5 Strategy for Integration
- •7.6 Integration Using Tables and Computer Algebra Systems
- •7.7 Approximate Integration
- •7.8 Improper Integrals
- •Review
- •8.1 Arc Length
- •8.2 Area of a Surface of Revolution
- •8.3 Applications to Physics and Engineering
- •8.4 Applications to Economics and Biology
- •8.5 Probability
- •Review
- •9.1 Modeling with Differential Equations
- •9.2 Direction Fields and Euler’s Method
- •9.3 Separable Equations
- •9.4 Models for Population Growth
- •9.5 Linear Equations
- •9.6 Predator-Prey Systems
- •Review
- •10.1 Curves Defined by Parametric Equations
- •10.2 Calculus with Parametric Curves
- •10.3 Polar Coordinates
- •10.4 Areas and Lengths in Polar Coordinates
- •10.5 Conic Sections
- •10.6 Conic Sections in Polar Coordinates
- •Review
- •11.1 Sequences
- •11.2 Series
- •11.3 The Integral Test and Estimates of Sums
- •11.4 The Comparison Tests
- •11.5 Alternating Series
- •11.6 Absolute Convergence and the Ratio and Root Tests
- •11.7 Strategy for Testing Series
- •11.8 Power Series
- •11.9 Representations of Functions as Power Series
- •11.10 Taylor and Maclaurin Series
- •11.11 Applications of Taylor Polynomials
- •Review
- •APPENDIXES
- •A Numbers, Inequalities, and Absolute Values
- •B Coordinate Geometry and Lines
- •E Sigma Notation
- •F Proofs of Theorems
- •G The Logarithm Defined as an Integral
- •INDEX
29. The cost, in dollars, of producing x yards of a certain fabric is C# x$ ! 1200 $ 12x % 0.1x2 $ 0.0005x3
(a)Find the marginal cost function.
(b)Find C##200$ and explain its meaning. What does it predict?
(c)Compare C##200$ with the cost of manufacturing the 201st yard of fabric.
30.The cost function for production of a commodity is
C# x$ ! 339 $ 25x % 0.09x2 $ 0.0004x3
(a)Find and interpret C##100$.
(b)Compare C##100$ with the cost of producing the 101st item.
31.If p# x$ is the total value of the production when there are x workers in a plant, then the average productivity of the workforce at the plant is
A# x$ ! px# x$
(a)Find A## x$. Why does the company want to hire more workers if A## x$ ( 0?
(b)Show that A## x$ ( 0 if p## x$ is greater than the average productivity.
32.If R denotes the reaction of the body to some stimulus of strength x, the sensitivity S is defined to be the rate of change of the reaction with respect to x. A particular example is that when the brightness x of a light source is increased, the eye reacts by decreasing the area R of the pupil. The experimental formula
40 $ 24x0.4
R ! 1 $ 4x0.4
has been used to model the dependence of R on x when R is measured in square millimeters and x is measured in appropriate units of brightness.
(a)Find the sensitivity.
;(b) Illustrate part (a) by graphing both R and S as functions of x. Comment on the values of R and S at low levels of brightness. Is this what you would expect?
SECTION 3.8 EXPONENTIAL GROWTH AND DECAY |||| 233
33. The gas law for an ideal gas at absolute temperature T (in kelvins), pressure P (in atmospheres), and volume V (in liters) is PV ! nRT, where n is the number of moles of the gas and R ! 0.0821 is the gas constant. Suppose that, at a certain instant, P ! 8.0 atm and is increasing at a rate of 0.10 atm"min and V ! 10 L and is decreasing at a rate of 0.15 L"min. Find the rate of change of T with respect to time at that instant if n ! 10 mol.
34. In a fish farm, a population of fish is introduced into a pond and harvested regularly. A model for the rate of change of the fish population is given by the equation
dP |
! r0'1 % |
P#t$ |
(P#t$ % 'P#t$ |
dt |
Pc |
where r0 is the birth rate of the fish, Pc is the maximum population that the pond can sustain (called the carrying capacity), and ' is the percentage of the population that is harvested.
(a)What value of dP"dt corresponds to a stable population?
(b)If the pond can sustain 10,000 fish, the birth rate is 5%, and the harvesting rate is 4%, find the stable population level.
(c) What happens if ' is raised to 5%?
35.In the study of ecosystems, predator-prey models are often used to study the interaction between species. Consider populations of tundra wolves, given by W#t$, and caribou, given by C#t$, in northern Canada. The interaction has been modeled by the equations
dC |
! aC % bCW |
dW |
! %cW $ dCW |
dt |
dt |
(a)What values of dC"dt and dW"dt correspond to stable populations?
(b)How would the statement “The caribou go extinct” be represented mathematically?
(c)Suppose that a ! 0.05, b ! 0.001, c ! 0.05, and
d ! 0.0001. Find all population pairs #C, W$ that lead to stable populations. According to this model, is it possible for the two species to live in balance or will one or both species become extinct?
3.8 EXPONENTIAL GROWTH AND DECAY
In many natural phenomena, quantities grow or decay at a rate proportional to their size. For instance, if y ! f # t$ is the number of individuals in a population of animals or bacteria at time t, then it seems reasonable to expect that the rate of growth f ## t$ is proportional to the population f # t$; that is, f ## t$ ! kf # t$ for some constant k. Indeed, under ideal conditions (unlimited environment, adequate nutrition, immunity to disease) the mathematical model given by the equation f ## t$ ! kf # t$ predicts what actually happens fairly accurately. Another example occurs in nuclear physics where the mass of a radioactive substance decays at a rate proportional to the mass. In chemistry, the rate of a unimolecular first-order reaction is proportional to the concentration of the substance. In finance, the
234 |||| CHAPTER 3 DIFFERENTIATION RULES
value of a savings account with continuously compounded interest increases at a rate proportional to that value.
In general, if y#t$ is the value of a quantity y at time t and if the rate of change of y with respect to t is proportional to its size y#t$ at any time, then
1 |
dy |
! ky |
dt |
||
|
|
|
where k is a constant. Equation 1 is sometimes called the law of natural growth (if k ( 0) or the law of natural decay (if k ) 0). It is called a differential equation because it involves an unknown function y and its derivative dy"dt .
It’s not hard to think of a solution of Equation 1. This equation asks us to find a function whose derivative is a constant multiple of itself. We have met such functions in this chapter. Any exponential function of the form y# t$ ! Cekt, where C is a constant, satisfies
y## t$ ! C#kekt $ ! k#Cekt $ ! ky# t$
We will see in Section 9.4 that any function that satsifies dy"dt ! ky must be of the form y ! Cekt. To see the significance of the constant C, we observe that
y#0$ ! Cek!0 ! C
Therefore C is the initial value of the function.
2 THEOREM The only solutions of the differential equation dy"dt ! ky are the exponential functions
y# t$ ! y#0$ ekt
POPULATION GROWTH
What is the significance of the proportionality constant k? In the context of population growth, where P#t$ is the size of a population at time t, we can write
3 |
dP |
! kP |
or |
1 |
dP |
! k |
dt |
P |
dt |
The quantity
1 dP
P dt
is the growth rate divided by the population size; it is called the relative growth rate. According to (3), instead of saying “the growth rate is proportional to population size” we could say “the relative growth rate is constant.” Then (2) says that a population with constant relative growth rate must grow exponentially. Notice that the relative growth rate k appears as the coefficient of t in the exponential function Cekt. For instance, if
dPdt ! 0.02P
and t is measured in years, then the relative growth rate is k ! 0.02 and the population
SECTION 3.8 EXPONENTIAL GROWTH AND DECAY |||| 235
FIGURE 1
A model for world population growth in the second half of the 20th century
grows at a relative rate of 2% per year. If the population at time 0 is P0, then the expression for the population is
P#t$ ! P0e0.02t
V EXAMPLE 1 Use the fact that the world population was 2560 million in 1950 and 3040 million in 1960 to model the population of the world in the second half of the 20th century. (Assume that the growth rate is proportional to the population size.) What is the relative growth rate? Use the model to estimate the world population in 1993 and to predict the population in the year 2020.
SOLUTION We measure the time t in years and let t ! 0 in the year 1950. We measure the population P#t$ in millions of people. Then P#0$ ! 2560 and P#10) ! 3040. Since we are assuming that dP"dt ! kP, Theorem 2 gives
P#t$ ! P#0$ekt ! 2560ekt
P#10$ ! 2560e10k ! 3040
k ! 101 ln 30402560 ) 0.017185
The relative growth rate is about 1.7% per year and the model is
P#t$ ! 2560e0.017185t
We estimate that the world population in 1993 was
P#43$ ! 2560e0.017185#43$ ) 5360 million
The model predicts that the population in 2020 will be
P#70$ ! 2560e0.017185#70$ ) 8524 million
The graph in Figure 1 shows that the model is fairly accurate to the end of the 20th century (the dots represent the actual population), so the estimate for 1993 is quite reliable. But the prediction for 2020 is riskier.
P |
|
|
6000 |
|
|
Population |
P=2560e0.017185t |
|
|
|
|
(in millions) |
|
|
20 |
40 |
t |
Years since 1950 |
M |
|
|
|
RADIOACTIVE DECAY
Radioactive substances decay by spontaneously emitting radiation. If m#t$ is the mass remaining from an initial mass m0 of the substance after time t, then the relative decay rate
1dm
%m dt
236 |||| CHAPTER 3 DIFFERENTIATION RULES
has been found experimentally to be constant. (Since dm"dt is negative, the relative decay rate is positive.) It follows that
dmdt ! km
where k is a negative constant. In other words, radioactive substances decay at a rate proportional to the remaining mass. This means that we can use (2) to show that the mass decays exponentially:
m#t$ ! m0ekt
Physicists express the rate of decay in terms of half-life, the time required for half of any given quantity to decay.
V EXAMPLE 2 The half-life of radium-226 is 1590 years.
(a)A sample of radium-226 has a mass of 100 mg. Find a formula for the mass of the sample that remains after t years.
(b)Find the mass after 1000 years correct to the nearest milligram.
(c)When will the mass be reduced to 30 mg?
SOLUTION
(a) Let m#t$ be the mass of radium-226 (in milligrams) that remains after t years. Then dm"dt ! km and y#0$ ! 100, so (2) gives
m#t$ ! m#0$ekt ! 100ekt
In order to determine the value of k, we use the fact that y#1590$ ! 12 #100$. Thus
|
100e1590k ! 50 |
so e1590k ! 21 |
|
and |
1590k ! ln 21 ! %ln 2 |
||
|
k ! % |
ln 2 |
|
|
|
|
|
|
1590 |
|
|
Therefore |
m#t$ ! 100e%#ln 2$t"1590 |
We could use the fact that eln 2 ! 2 to write the expression for m#t$ in the alternative form
|
m#t$ ! 100 * 2%t"1590 |
||
(b) |
The mass after 1000 years is |
|
|
|
m#1000$ ! 100e%#ln 2$1000"1590 ) 65 mg |
||
(c) |
We want to find the value of t such that m#t$ ! 30, that is, |
||
|
100e%#ln 2$t"1590 ! 30 |
or |
e%#ln 2$t"1590 ! 0.3 |
We solve this equation for t by taking the natural logarithm of both sides:
% 1590ln 2 t ! ln 0.3
Thus |
t ! %1590 |
ln 0.3 |
) 2762 years |
|
ln 2 |
||||
|
|
|
M
SECTION 3.8 EXPONENTIAL GROWTH AND DECAY |||| 237
150 |
|
|
As a check on our work in Example 2, we use a graphing device to draw the graph of |
|||||||
|
|
|
m#t$ in Figure 2 together with the horizontal line m ! 30. These curves intersect when |
|||||||
|
m=100e_(ln!2)t/1590 |
|
t ) 2800, and this agrees with the answer to part (c). |
|||||||
|
|
|
|
|
|
|
|
|
||
|
m=30 |
|
NEWTON’S LAW OF COOLING |
|
||||||
0 |
4000 |
Newton’s Law of Cooling states that the rate of cooling of an object is proportional to |
||||||||
|
||||||||||
|
the temperature difference between the object and its surroundings, provided that this |
|||||||||
FIGURE 2 |
|
difference is not too large. (This law also applies to warming.) If we let T# t$ be the tem- |
||||||||
|
perature of the object at time t and Ts be the temperature of the surroundings, then we |
|||||||||
|
|
|
||||||||
|
|
|
can formulate Newton’s Law of Cooling as a differential equation: |
|||||||
|
|
|
|
|
|
|
dT ! k# T % Ts$ |
|||
|
|
|
|
|
|
|
dt |
|
||
|
|
|
where k is a constant. This equation is not quite the same as Equation 1, so we make |
|||||||
|
|
|
the change of variable y#t$ ! T# t$ % Ts. Because Ts is constant, we have y## t$ ! T## t$ |
|||||||
|
|
|
and so the equation becomes |
|
|
|
||||
|
|
|
|
|
|
|
|
dy |
! ky |
|
|
|
|
|
|
|
|
|
|
||
|
|
|
|
|
|
|
|
dt |
||
|
|
|
We can then use (2) to find an expression for y, from which we can find T. |
|||||||
|
|
|
EXAMPLE 3 A bottle of soda pop at room temperature (72+F) is placed in a refrigerator |
|||||||
|
|
|
where the temperature is 44+F. After half an hour the soda pop has cooled to 61+F. |
|||||||
|
|
|
(a) |
What is the temperature of the soda pop after another half hour? |
||||||
|
|
|
(b) |
How long does it take for the soda pop to cool to 50+F? |
||||||
|
|
|
SOLUTION |
|
|
|
||||
|
|
|
(a) |
Let T# t$ be the temperature of the soda after t minutes. The surrounding temperature |
||||||
|
|
|
is Ts ! 44+F, so Newton’s Law of Cooling states that |
|||||||
|
|
|
|
|
|
|
dT ! k# T % 44) |
|||
|
|
|
|
|
|
|
dt |
|
||
|
|
|
If we let y ! T % 44, then y#0$ ! T# 0$ % 44 ! 72 % 44 ! 28, so y satisfies |
|||||||
|
|
|
|
|
dy |
|
! ky |
y# 0$ ! 28 |
||
|
|
|
|
|
dt |
|||||
|
|
|
|
|
|
|
|
|||
|
|
|
and by (2) we have |
|
|
|
||||
|
|
|
|
|
y# t$ ! y#0$ekt ! 28ekt |
|||||
|
|
|
We are given that T# 30$ ! 61, so y# 30$ ! 61 % 44 ! 17 and |
|||||||
|
|
|
|
28e30k ! 17 |
e30k ! 2817 |
|||||
|
|
|
Taking logarithms, we have |
ln(2817 ) |
|
|||||
|
|
|
|
k ! |
) %0.01663 |
|||||
|
|
|
|
30 |
||||||
|
|
|
|
|
|
|
|
238 |||| CHAPTER 3 DIFFERENTIATION RULES
Thus
|
|
|
|
|
|
|
|
|
|
|
|
|
|
y# t$ ! 28e%0.01663t |
|
|
|
|
|
||||
|
|
|
|
|
|
|
|
|
|
|
|
|
|
T# t$ ! 44 |
$ 28e%0.01663t |
|
|||||||
|
|
|
|
|
|
|
|
|
|
|
|
|
T# 60$ ! 44 |
$ 28e%0.01663#60$ ) 54.3 |
|||||||||
|
|
|
|
|
|
|
|
|
|
|
|
|
So after another half hour the pop has cooled to about 54+F. |
||||||||||
|
|
|
|
|
|
|
|
|
|
|
|
|
(b) We have T#t$ ! 50 when |
|
|
|
|
|
|
|
|
|
|
|
|
|
|
|
|
|
|
|
|
|
|
|
44 |
$ 28e%0.01663t ! 50 |
|
|
|
|
|
||||
|
|
|
|
|
|
|
|
|
|
|
|
|
|
e%0.01663t ! |
6 |
|
|
|
|
|
|
||
|
|
|
|
|
|
|
|
|
|
|
|
|
|
28 |
|
|
|
|
|
||||
T |
|
|
|
|
|
|
|
|
|
|
|
|
|
|
|
|
|
6 |
|
|
|
||
72 |
|
|
|
|
|
|
|
|
|
|
|
|
|
|
t ! |
|
|
ln( |
28 |
) |
|
) 92.6 |
|
|
|
|
|
|
|
|
|
|
|
|
|
|
%0.01663 |
|
|||||||||
|
|
|
|
|
|
|
|
|
|
|
|
|
|
|
|
|
|
|
|||||
44 |
|
|
|
|
|
|
|
|
|
|
|
|
The pop cools to 50+F after about 1 hour 33 minutes. |
M |
|||||||||
|
|
|
|
|
|
|
|
|
|
|
|
|
Notice that in Example 3, we have |
|
|
|
|
|
|
|
|
|
|
|
|
|
|
|
|
|
|
|
|
|
|
|
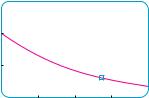
lim T# t$ ! lim #44 $ 28e%0.01663t$ ! 44 |
$ 28 ! 0 ! 44 |
|||||||||
0 |
|
30 |
60 |
90 |
t |
||||||||||||||||||
|
t l& |
t l& |
|
|
|
|
|
|
|
|
|
||||||||||||
FIGURE 3 |
|
|
|
|
|
|
|
|
|
|
|
which is to be expected. The graph of the temperature function is shown in Figure 3. |
CONTINUOUSLY COMPOUNDED INTEREST
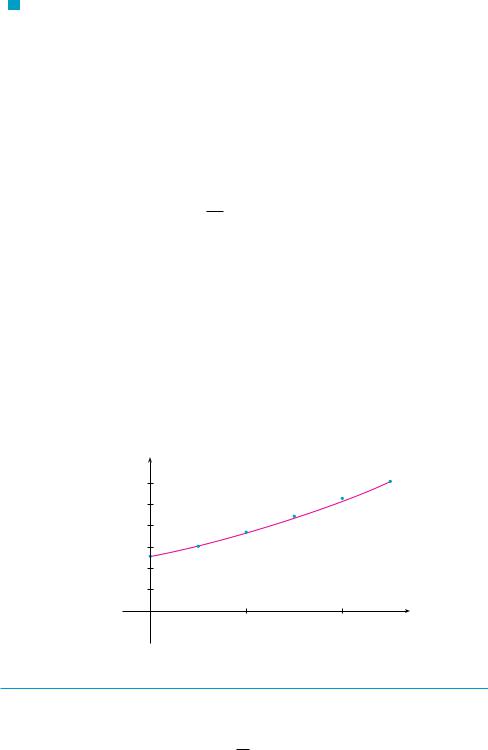
EXAMPLE 4 If $1000 is invested at 6% interest, compounded annually, then after 1 year the investment is worth $1000#1.06$ ! $1060, after 2 years it’s worth
$&1000#1.06$%1.06 ! $1123.60, and after t years it’s worth $1000#1.06$t. In general, if an amount A0 is invested at an interest rate r #r ! 0.06 in this example), then after
t years it’s worth A0#1 $ r$ t. Usually, however, interest is compounded more frequently, say, n times a year. Then in each compounding period the interest rate is r"n and there are nt compounding periods in t years, so the value of the investment is
' r (nt
A0 1 $ n
For instance, after 3 years at 6% interest a $1000 investment will be worth
|
$1000#1.06$3 ! $1191.02 |
with annual compounding |
||||
|
$1000#1.03$6 ! $1194.05 |
with semiannual compounding |
||||
$1000#1.015$12 |
! $1195.62 |
with quarterly compounding |
||||
$1000#1.005$36 |
! $1196.68 |
with monthly compounding |
||||
$1000'1 |
0.06 |
( |
365 ! 3 |
! $1197.20 |
with daily compounding |
|
$ |
|
|
||||
365 |
|
SECTION 3.8 EXPONENTIAL GROWTH AND DECAY |||| 239
You can see that the interest paid increases as the number of compounding periods #n$ increases. If we let n l &, then we will be compounding the interest continuously and the value of the investment will be
A#t$ ! lim A0 |
|
1 |
$ |
|
r |
|
nt |
! lim A0 |
|
1 |
$ |
r |
n"r rt |
|
||||||||
' |
|
n |
( |
|
*' |
n |
( + |
|
||||||||||||||
n l& |
|
|
|
|
|
|
|
|
n l& |
|
|
|
||||||||||
! A0 |
|
lim |
|
1 |
$ |
|
r |
n"r |
|
rt |
|
|
|
|
|
|
||||||
|
|
|
|
|
|
|
|
|
|
|
|
|
|
|
||||||||
|
' |
|
n ( |
|
+ |
|
|
|
|
|
|
|||||||||||
|
*n l& |
|
|
|
|
|
|
|
|
|
|
|
|
|
||||||||
! A0 |
|
lim |
|
|
1 |
$ |
|
1 |
|
m |
|
rt |
(where m ! n"r) |
|
||||||||
|
' |
|
m ( + |
|
|
|||||||||||||||||
|
*m l& |
|
|
|
|
|
|
|
|
|
|
|
|
|||||||||
But the limit in this expression is equal to the number e. (See Equation 3.6.6). So with |
|
|||||||||||||||||||||
continuous compounding of interest at interest rate r, the amount after t years is |
|
|||||||||||||||||||||
|
|
|
|
|
|
|
|
A#t$ ! A0ert |
|
|
|
|
|
|
||||||||
If we differentiate this function, we get |
|
|
|
|
|
|
|
|
|
|
|
|
|
|||||||||
|
|
|
|
dA |
|
! rA0ert ! rA#t$ |
|
|
|
|
|
|||||||||||
|
|
|
|
dt |
|
|
|
|
|
|
|
|
|
|
|
|
|
|
|
|
||
which says that, with continuous compounding of interest, the rate of increase of an |
|
|||||||||||||||||||||
investment is proportional to its size. |
|
|
|
|
|
|
|
|
|
|
|
|
|
|
|
|
||||||
Returning to the example of $1000 invested for 3 years at 6% interest, we see that |
|
|||||||||||||||||||||
with continuous compounding of interest the value of the investment will be |
|
|||||||||||||||||||||
|
A#3$ ! $1000e#0.06$3 ! $1197.22 |
|
|
|
||||||||||||||||||
Notice how close this is to the amount we calculated for daily compounding, $1197.20. |
|
|||||||||||||||||||||
But the amount is easier to compute if we use continuous compounding. |
M |
3.8EXERCISES
1.A population of protozoa develops with a constant relative growth rate of 0.7944 per member per day. On day zero the population consists of two members. Find the population size after six days.
2.A common inhabitant of human intestines is the bacterium Escherichia coli. A cell of this bacterium in a nutrient-broth medium divides into two cells every 20 minutes. The initial population of a culture is 60 cells.
(a)Find the relative growth rate.
(b)Find an expression for the number of cells after t hours.
(c)Find the number of cells after 8 hours.
(d)Find the rate of growth after 8 hours.
(e)When will the population reach 20,000 cells?
3.A bacteria culture initially contains 100 cells and grows at a rate proportional to its size. After an hour the population has increased to 420.
(a)Find an expression for the number of bacteria after t hours.
(b)Find the number of bacteria after 3 hours.
(c)Find the rate of growth after 3 hours.
(d)When will the population reach 10,000?
4.A bacteria culture grows with constant relative growth rate. After 2 hours there are 600 bacteria and after 8 hours the count is 75,000.
(a)Find the initial population.
(b)Find an expression for the population after t hours.
240 |||| CHAPTER 3 DIFFERENTIATION RULES
(c) Find the number of cells after 5 hours.
(d) Find the rate of growth after 5 hours.
(e) When will the population reach 200,000?
5. The table gives estimates of the world population, in millions, from 1750 to 2000:
Year |
Population |
Year |
Population |
|
|
|
|
1750 |
790 |
1900 |
1650 |
1800 |
980 |
1950 |
2560 |
1850 |
1260 |
2000 |
6080 |
|
|
|
|
(a) Use the exponential model and the population figures for 1750 and 1800 to predict the world population in 1900 and 1950. Compare with the actual figures.
(b) Use the exponential model and the population figures for 1850 and 1900 to predict the world population in 1950. Compare with the actual population.
(c) Use the exponential model and the population figures for 1900 and 1950 to predict the world population in 2000. Compare with the actual population and try to explain the discrepancy.
6. The table gives the population of the United States, in millions, for the years 1900–2000.
Year |
Population |
Year |
Population |
|
|
|
|
1900 |
76 |
1960 |
179 |
1910 |
92 |
1970 |
203 |
1920 |
106 |
1980 |
227 |
1930 |
123 |
1990 |
250 |
1940 |
131 |
2000 |
275 |
1950 |
150 |
|
|
|
|
|
|
(a)Use the exponential model and the census figures for 1900 and 1910 to predict the population in 2000. Compare with the actual figure and try to explain the discrepancy.
(b)Use the exponential model and the census figures for 1980 and 1990 to predict the population in 2000. Compare with the actual population. Then use this model to predict the population in the years 2010 and 2020.
;(c) Graph both of the exponential functions in parts (a)
and (b) together with a plot of the actual population. Are these models reasonable ones?
7. Experiments show that if the chemical reaction
N2O5 l2NO2 $ 12 O2
takes place at 45+C, the rate of reaction of dinitrogen pentoxide is proportional to its concentration as follows:
% d&N2O5% ! 0.0005&N2O5% dt
(a)Find an expression for the concentration &N2O5% after t seconds if the initial concentration is C.
(b)How long will the reaction take to reduce the concentration of N2O5 to 90% of its original value?
8.Bismuth-210 has a half-life of 5.0 days.
(a)A sample originally has a mass of 800 mg. Find a formula for the mass remaining after t days.
(b)Find the mass remaining after 30 days.
(c)When is the mass reduced to 1 mg?
(d)Sketch the graph of the mass function.
9.The half-life of cesium-137 is 30 years. Suppose we have a 100-mg sample.
(a)Find the mass that remains after t years.
(b)How much of the sample remains after 100 years?
(c)After how long will only 1 mg remain?
10.A sample of tritium-3 decayed to 94.5% of its original amount after a year.
(a)What is the half-life of tritium-3?
(b)How long would it take the sample to decay to 20% of its original amount?
11.Scientists can determine the age of ancient objects by the method of radiocarbon dating. The bombardment of the upper atmosphere by cosmic rays converts nitrogen to a radioactive isotope of carbon, 14 C, with a half-life of about 5730 years. Vegetation absorbs carbon dioxide through the atmosphere and animal life assimilates 14 C through food chains. When a plant or animal dies, it stops replacing its carbon and the amount of 14 C begins to decrease through radioactive decay. Therefore the level of radioactivity must also decay exponentially.
A parchment fragment was discovered that had about 74% as much 14 C radioactivity as does plant material on the earth today. Estimate the age of the parchment.
12.A curve passes through the point #0, 5$ and has the property that the slope of the curve at every point P is twice the y-coordinate of P. What is the equation of the curve?
13.A roast turkey is taken from an oven when its temperature has reached 185+F and is placed on a table in a room where the temperature is 75+F.
(a)If the temperature of the turkey is 150+F after half an hour, what is the temperature after 45 minutes?
(b)When will the turkey have cooled to 100+F?
14.A thermometer is taken from a room where the temperature is 20+C to the outdoors, where the temperature is 5+C. After one minute the thermometer reads 12+C.
(a)What will the reading on the thermometer be after one more minute?
(b)When will the thermometer read 6+C?
15.When a cold drink is taken from a refrigerator, its temperature is 5+C. After 25 minutes in a 20+C room its temperature has increased to 10+C.
(a)What is the temperature of the drink after 50 minutes?
(b)When will its temperature be 15+C?