


|
|
|
|
|
Digestion |
267 |
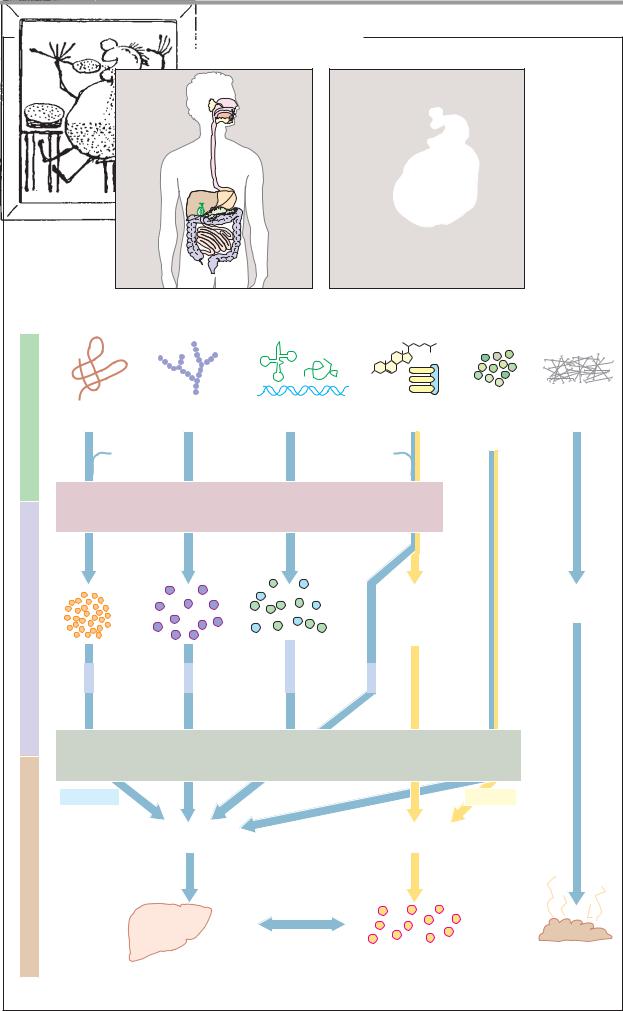
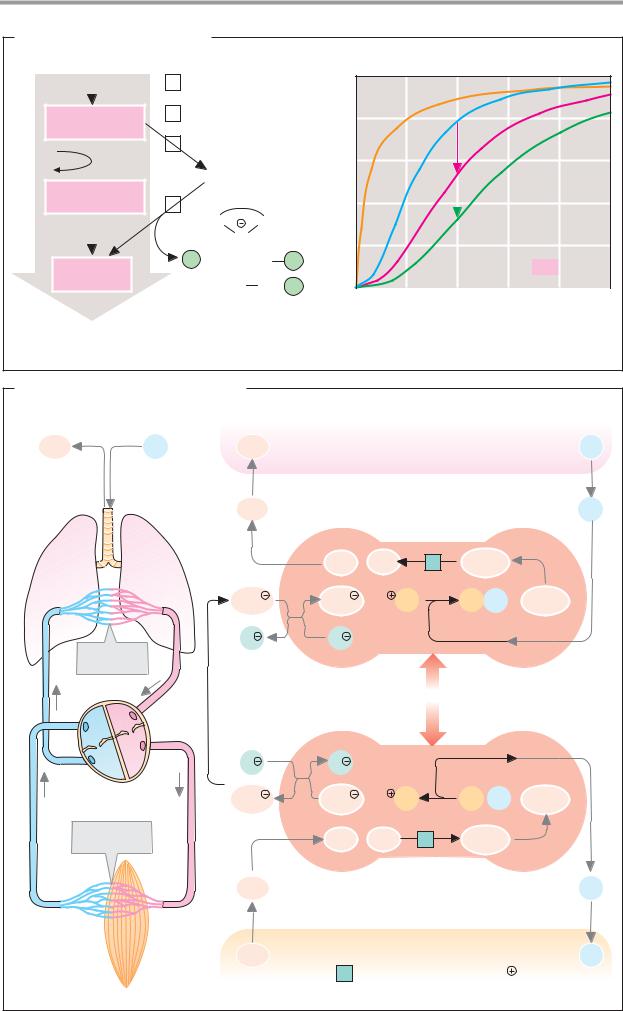
A. Hydrolysis and resorption of dietary constituents |
|
|
||||
|
|
|
|
|
Wilhelm Busch |
|
Nutrients |
Proteins |
Carbohydrates |
Nucleic acids |
Lipids |
Vitamins |
Fiber |
|
|
|
|
Inorganic |
|
|
|
|
Bile salts |
substances |
|
||
HCl |
|
Phospholipids |
|
|
||
|
|
|
|
|
|
|
|
E n z y m a t i c h y d r o l y s i s |
|
|
|||
products |
|
|
|
2-Monoacyl- |
Cellulose |
|
Cleavage |
|
|
|
glycerol |
Lignin |
|
|
|
|
Fatty acids |
|
|
|
|
|
Nucleobases |
Cholesterol |
|
|
|
|
|
Pentoses |
|
|
|
|
Amino |
Mono- |
Phosphate |
Glycerol |
|
|
|
|
|
|
||||
|
acids |
saccharides |
Nucleosides |
phosphate |
|
|
|
|
Glucose |
|
|
|
|
|
* |
Galactose * |
|
|
|
|
|
|
* |
|
|
|
|
|
|
R e s o r p t i o n |
|
|
||
|
Hydrophilic |
|
|
|
Lipophilic |
|
Transport |
|
Portal vessel |
|
Lymph system |
|
|
|
|
|
|
|
|
|
|
|
Liver |
|
Blood |
Feces |
|
|
|
|
|
*Resorption by active transport |
||


|
|
|
|
|
|
|
|
Digestion |
271 |
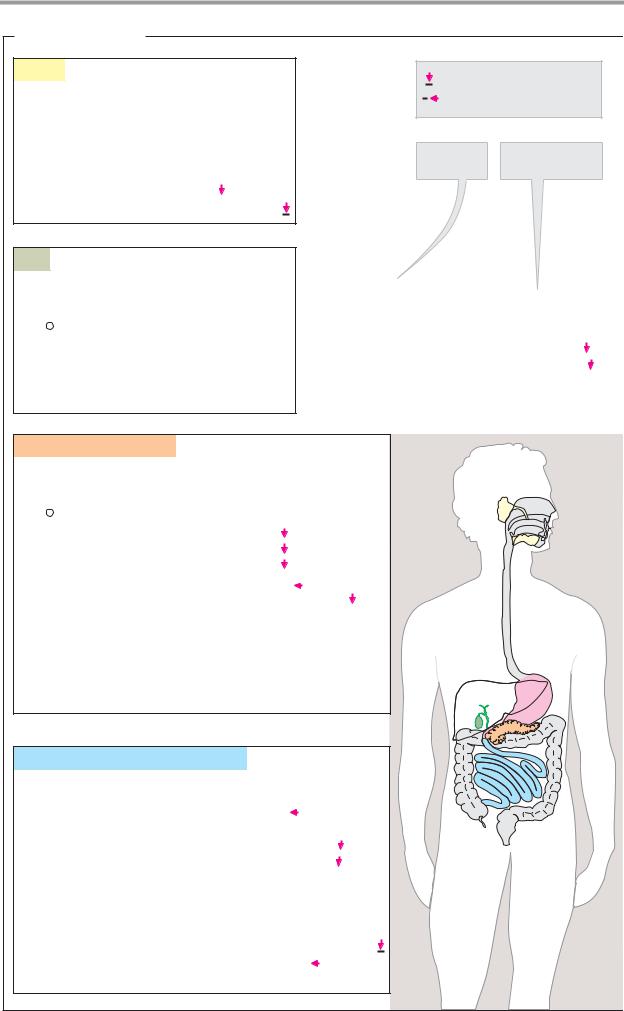
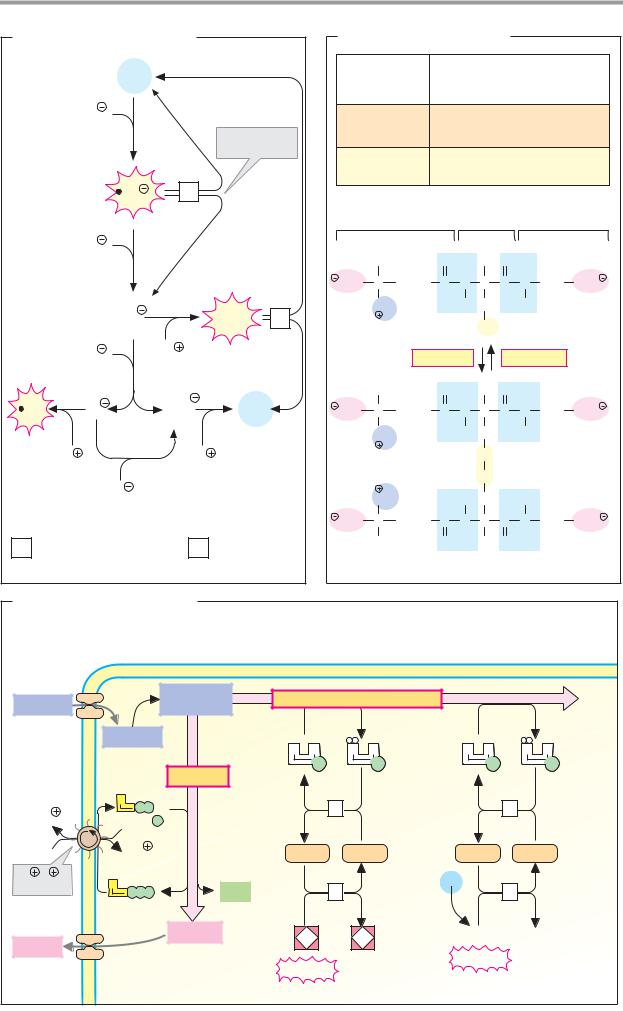
A. Formation of hydrochloric acid |
|
|
|
|
|
|
|
||
Interstitial |
|
Parietal cell |
|
|
|
|
|
Lumen of the stomach |
|
fluid |
|
|
|
|
|
|
Peptides |
|
|
|
H2O |
|
|
|
P |
|
|
|
|
|
|
|
A |
|
Pepsino- |
Pepsins |
|
||
|
|
|
|
|
|
||||
CO2 |
CO2 |
1 |
|
P |
P |
|
gens |
3.4.23.1-3 |
Native |
|
|
|
|
|
|
||||
|
|
|
|
|
|
protein |
|||
|
|
|
|
K |
|
|
K |
|
|
Anion |
|
|
|
H |
|
2 |
H |
|
|
exchanger |
|
|
|
|
|
|
|||
|
|
|
|
|
|
|
|
||
|
|
|
|
A |
|
|
H |
Cl |
|
|
HCO3 |
|
P |
P |
P |
≈ 0.1 mol · l-1 |
|
||
HCO3 |
|
|
|
|
|
|
|
||
|
|
|
|
|
|
|
|
|
|
Cl |
Cl |
|
|
|
|
|
Cl |
Denatured |
|
|
|
|
|
|
|
|
|||
|
|
Chloride channel |
|
protein |
|||||
|
|
|
|
||||||
|
|
|
|
|
|
|
Micro-organism |
|
|
1 Carbonate dehydratase 4.2.1.1 [Zn2 |
] |
2 |
H |
/K |
-exchanging ATPase 3.6.1.36 |
|
|||
B. Zymogen activation |
|
|
||
Small bowel |
Mucosal cell |
Entero- |
Pancreatic secretion |
|
|
|
peptidase |
|
|
|
|
3.4.21.9 |
|
|
Trypsin |
|
|
|
|
3.4.21.4 |
|
|
Various |
|
|
|
|
zymogens |
|
|
|
Trypsinogen |
||
|
|
|
Trypsin inhibitor |
|
Activated digestive |
Zymogens: |
Premature |
||
trypsin |
||||
enzymes |
Procarboxypeptidases |
|||
activation |
||||
|
Proelastase |
|
||
|
Chymotrypsinogen |
|
||
Digestion |
Prophospholipase A2 |
Blocked trypsin |
||
|
Trypsinogen |
|||
C. Fat digestion |
|
|
1 |
Triacylglycerol lipase 3.1.1.3 |
Enterocyte |
1 |
|
|
|
Micelle |
Resorption |
C-terminal |
|
|
domain |
1 |
|
Colipase |
|
Monoacyl- |
|
glycerol |
|
|
|
|
|
|
Bile salt |
|
|
Phospholipid |
|
|
Triacylglycerol |
|
|
|
|
|
Digestion |
273 |
|
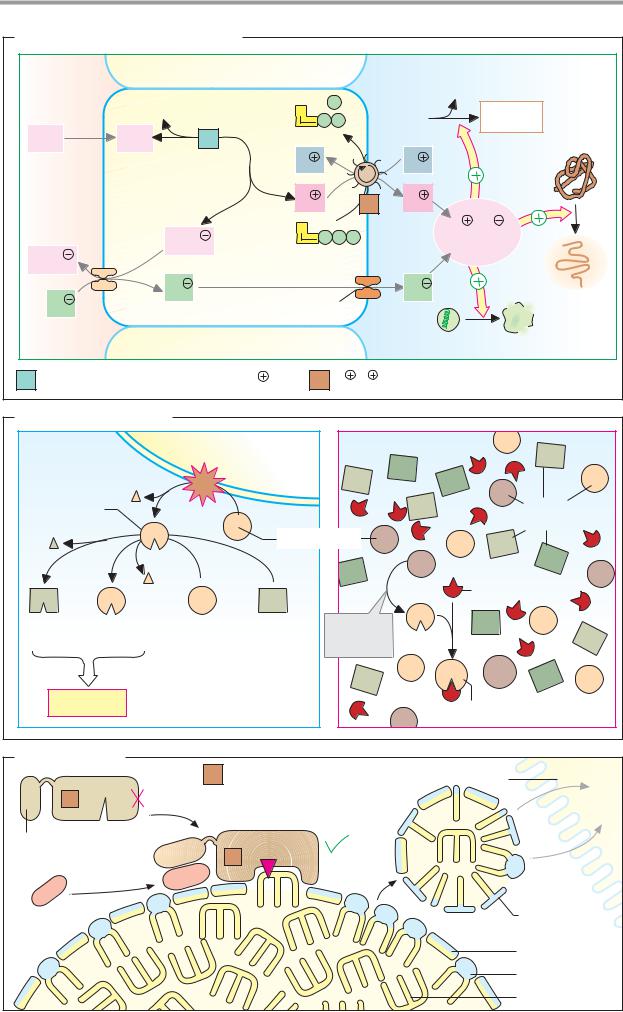
A. Monosaccharides |
|
|
|
|
|
|
|
|
|
|
|
|
|
2 K |
|
Poly- |
|
|
|
|
|
3 Na |
|
|
|
|
|
|
|
|
|
saccharides |
Na glucose |
2 K |
3 |
|
|
Glucose |
|
|
symporter |
ATP |
ADP |
transporter |
|||
|
|
||||||
|
Na |
Na |
|
Pi |
|
|
|
|
|
|
|
|
|
||
Glucose |
Glucose |
|
|
|
|
|
|
Galactose |
Galactose |
|
|
|
|
|
|
1 |
|
* |
|
|
|
|
Portal |
|
|
|
|
|
|
|
vein |
α-Amylase |
Fructose |
Fructose |
|
|
|
|
|
|
Other mono- |
Other mono- |
|
|
|
|
|
|
saccharides |
saccharides |
|
|
|
|
|
|
|
|
|
1 |
α-Amylase 3.2.1.1 |
Liver |
|
|
|
|
|
|
|
||
|
|
|
|
2 |
Disaccharidases |
|
|
|
|
2 |
|
|
Oligosaccharidases |
|
|
|
|
|
|
Na /K -exchanging |
|
||
|
|
|
|
3 |
|
||
|
Oligo- |
|
|
|
ATPase 3.6.1.37 |
|
|
|
|
|
|
|
|
|
|
|
saccharides |
Intestinal |
|
|
Secondary-active transport |
|
|
|
|
|
|
|
|||
|
|
epithelial cell |
|
*Facilitated diffusion |
|
|
|
B. Lipids |
|
|
|
|
|
|
|
Triacyl- |
Intestinal |
|
|
|
|
|
|
lumen |
|
|
|
|
|
|
|
glycerol |
|
|
Fat |
|
|
|
|
|
|
|
|
|
Lymph |
||
|
|
|
|
synthesis |
|
|
|
|
|
|
|
|
|
|
|
|
|
P |
|
|
|
|
|
|
4 |
Glyco- |
|
|
|
|
Thoracic |
|
|
|
|
|
Fat |
duct |
|
|
|
lysis |
|
|
|
|
|
|
|
3x |
|
|
synthesis |
|
|
|
|
|
|
|
|
||
Diacyl- |
|
|
|
S |
A |
|
|
glycerol |
|
|
|
|
2x |
Blood |
|
|
A |
|
|
|
|||
|
|
P |
P |
P |
|
|
|
|
|
|
|
|
|||
|
|
|
|
5 |
|
Short-chain |
|
|
4 |
A |
|
S |
|
fatty acids |
|
|
P P |
P |
A |
|
|
||
|
|
|
|
|
|
|
|
|
|
|
|
|
|
|
Portal |
|
Fatty acids |
|
|
|
|
|
vein |
|
|
|
|
|
|
|
|
2-Mono- |
|
|
|
|
|
|
|
acyl- |
80% |
|
|
|
|
|
|
glycerol |
|
|
|
|
|
|
|
|
Resorption |
|
|
|
|
||
|
|
|
|
|
|
||
|
4 |
|
|
|
|
|
Liver |
|
|
|
|
|
|
|
|
Glycerol |
20% |
|
|
4 |
Triacylglycerol lipase 3.1.1.3 |
||
|
Intestinal |
||||||
|
|
epithelial cell |
5 Fatty acid-CoA ligase 6.2.1.3 |
||||
|
|
|
|
||||
|
|
|
|
|
Stimulated by bile salts, |
|
|
|
|
|
|
|
phospholipids, colipase and Ca2 |
||

|
|
|
|
|
|
|
|
|
|
Blood |
275 |
|
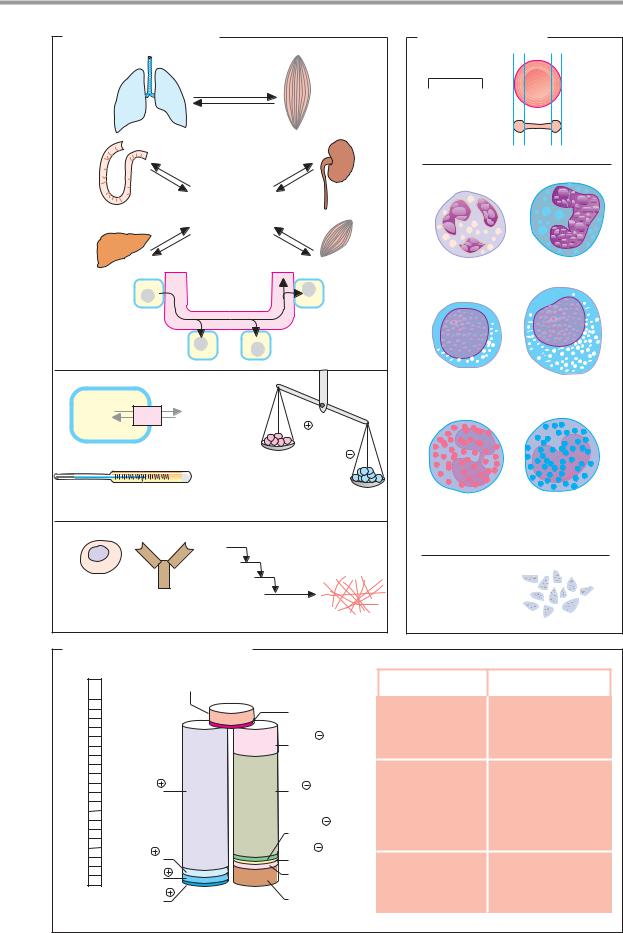
A. Functions of the blood |
|
|
|
B. Cellular elements |
|
|||||||
|
|
|
|
Blood gases: |
|
|
|
|
|
|
|
|
|
|
|
|
O2 |
|
|
10 m |
|
|
|
|
|
|
|
|
|
CO2 |
|
|
|
|
|
|
|
|
|
|
|
|
|
|
|
|
Erythrocyte |
|
5000 · 109 · l-1 |
|
|
|
|
|
|
Nutrients |
|
|
59% |
|
6.5% |
|
||
|
|
|
|
Metabolites |
|
|
|
|
|
|
|
|
|
|
|
|
Metabolic |
|
|
|
|
|
|
|
|
|
|
|
|
wastes |
|
|
|
|
|
|
|
|
|
|
|
|
Hormones |
|
|
Neutrophilic |
|
Monocyte |
|
||
|
|
|
|
|
|
granulocyte |
|
|
|
|||
|
|
|
|
|
|
|
|
|
|
31% |
|
|
Transport |
|
|
|
|
|
|
|
|
|
|
|
|
|
|
|
|
|
|
|
|
Small |
|
|
Large |
|
Cell |
H2O |
Extracellular |
|
|
lymphocyte |
|
||||||
|
|
|
2.4% |
|
|
|
|
|||||
|
space |
|
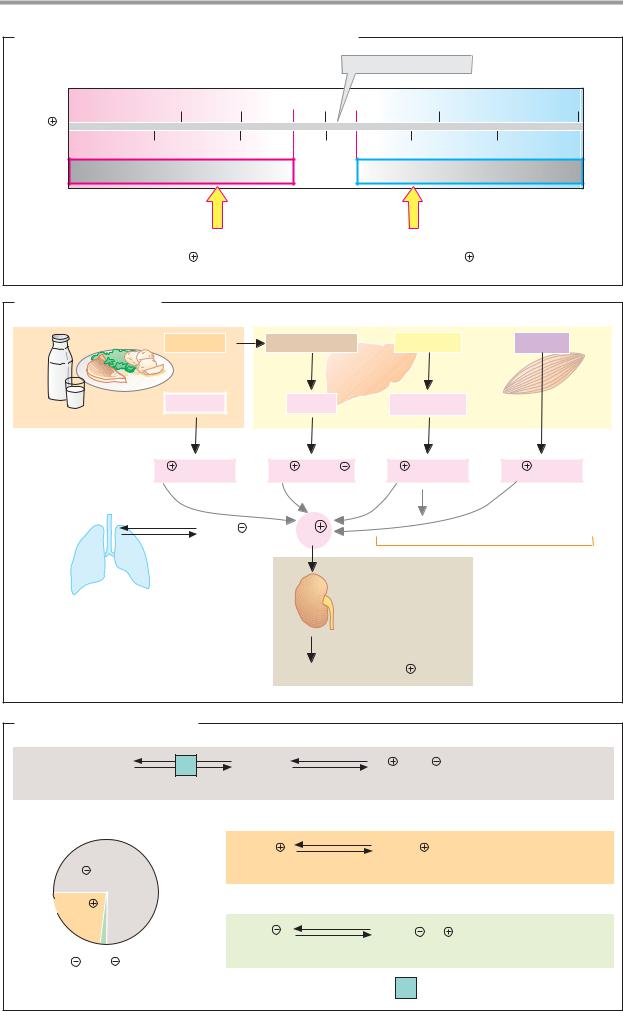
H |
|
|
0.6% |
|
|||||
|
|
|
|
|
|
|
|
|
|
|
|
|
|
Water balance |
|
|
|
OH |
|
|
|
|
|
||
|
|
|
|
|
|
|
|
|
|
|
||
|
1 2 3 4 5 6 |
6 5 4 3 2 1 |
|
Body |
|
Acid-base |
|
|
|
|
|
|
Homeostasis |
|
|
temperature |
balance |
|
|
|
|
|
|
||
|
|
|
|
|
|
Eosinophilic |
|
Basophilic |
|
|||
|
|
|
|
|
|
|
|
granulocyte |
|
|||
|
|
|
|
|
|
Blood clotting |
Leukocytes |
|
|
7 · 109 · l-1 |
|
|
|
|
|
|
|
|
and fibrinolysis |
|
|
|
|
|
|
Immune cells |
|
Antibodies |
|
|
|
250 · 109 · l-1 |
|
|
|
|
||
|
|
|
|
|
|
|
|
|
||||
Defense |
|
|
Self defense |
|
Thrombocytes |
|
|
|||||
C. Blood plasma: composition |
|
|
|
|
|
|
|
|||||
mM |
Non-electrolytes |
Uncharged |
Concentration |
Metabolite |
Concentration (mM) |
|||||||
|
||||||||||||
200 |
|
|
|
molecules |
|
|
|
|
|
|
|
|
|
|
|
|
|
H2CO3 1.2 |
Glucose |
|
3.6 |
– 6.1 |
|
||
|
|
|
|
|
|
|
|
|||||
|
|
|
|
|
|
HCO3 |
24-28 |
Lactate |
|
0.4 |
– 1.8 |
|
150 |
|
|
|
|
|
Pyruvate |
|
0.07 – 0.11 |
|
|||
|
|
|
|
|
|
|
|
|||||
|
|
|
|
|
|
|
|
Urea |
|
3.5 |
– 9.0 |
|
100 |
136-145 |
Na |
|
|
|
Cl |
100-110 |
Uric acid |
|
0.18 – 0.54 |
|
|
|
|
|
|
|
|
|||||||
|
|
|
|
|
|
|
|
Creatinin |
|
0.06 – 0.13 |
|
|
|
|
|
|
|
|
2 |
1.1-1.5 |
Amino acids |
|
2.3 |
– 4.0 |
|
50 |
|
|
|
|
|
HPO4 |
Ammonia |
|
0.02 – 0.06 |
|
||
|
|
|
|
|
|
|
|
|||||
|
|
|
|
|
SO 2 |
|
|
|
||||
|
3.5-5.0 |
K |
|
|
|
0.3-0.6 |
|
|
|
|
|
|
|
|
|
|
|
|
4 |
|
Lipids (total) |
|
5.5 – 6.0 g · l-1 |
|
|
|
2.1-2.6 Ca2 |
|
|
|
Organic |
|
|
|
||||
0 |
|
|
|
|
Triacylglycerols |
|
1.0 – 1.3 g · l-1 |
|
||||
|
Mg2 |
|
|
|
acids |
|
|
|
||||
|
0.6-1.0 |
Cations |
Anions |
Proteins |
|
Cholesterol |
|
1.7 |
– 2.1 g · l-1 |
|
||
|
|
|
|
|
|
|
|
|
|
|||
276 |
Tissues and organs |
|
|
Plasma proteins |
as plasma cells (see p. 302) and peptide hor- |
||
|
|
mones, which derive from endocrine gland |
|
Quantitatively, proteins are the most impor- |
cells. |
||
tant part of the soluble components of the |
With the exception of albumin, almost all |
||
blood plasma. With concentrations of be- |
plasma proteins are glycoproteins. They carry |
||
tween 60 and 80 g L–1, they constitute ap- |
oligosaccharides in N-and O-glycosidic bonds |
||
proximately 4% of the body’s total protein. |
(see p. 44). N-acetylneuraminic acid (sialic |
||
Their tasks include transport, regulation of |
acid; see p. 38) often occurs as a terminal |
||
the water balance, hemostasis, and defense |
carbohydrate among sugar residues. |
||
against pathogens. |
Neuraminidases (sialidases) on the surface of |
||
|
|
the vascular endothelia gradually cleave the |
|
A. Plasma proteins |
sialic acid residues and thereby release ga- |
||
lactose units on the surfaces of the proteins. |
|||
|
|
||
Some 100 different proteins occur in human |
These asialoglycoproteins (“asialo-” = without |
||
blood plasma. Based on their behavior during |
sialic acid) are recognized and bound by gal- |
||
electrophoresis (see below), they are broadly |
actose receptors on hepatocytes. In this way, |
||
divided into five fractions: albumins and α1–, |
the liver takes up aged plasma proteins by |
||
α2–, β– and γ-globulins. Historically, the dis- |
endocytosis and breaks them down. The oli- |
||
tinction between the albumins and globulins |
gosaccharides on the protein surfaces thus |
||
was based on differences in the proteins’ |
determine the half-life of plasma proteins, |
||
solubility –albumins are soluble in pure |
which is a period of days to weeks. |
||
water, whereas globulins only dissolve in |
In healthy individuals, the concentration of |
||
the presence of salts. |
plasma proteins is constant. Diseases in or- |
||
The most frequent protein in the plasma, at |
gans that are involved in protein synthesis |
||
around 45 g L–1, is albumin. Due to its high |
and breakdown can shift the protein pattern. |
||
concentration, it plays a crucial role in main- |
For example, via cytokines (see p. 392), se- |
||
taining the blood’s colloid osmotic pressure |
vere injuries trigger increased synthesis of |
||
and represents an important amino acid re- |
acute-phase proteins, which include C-reac- |
||
serve for the body. Albumin has binding sites |
tive protein, haptoglobin, fibrinogen, comple- |
||
for apolar substances and therefore functions |
ment factor C-3, and others. The concentra- |
||
as a transport protein for long-chain fatty |
tions of individual proteins are altered in |
||
acids, bilirubin, drugs, and some steroid hor- |
some diseases (known as dysproteinemias). |
||
mones and vitamins. In addition, serum albu- |
|
||
min binds Ca2+ and Mg2+ ions. It is the only |
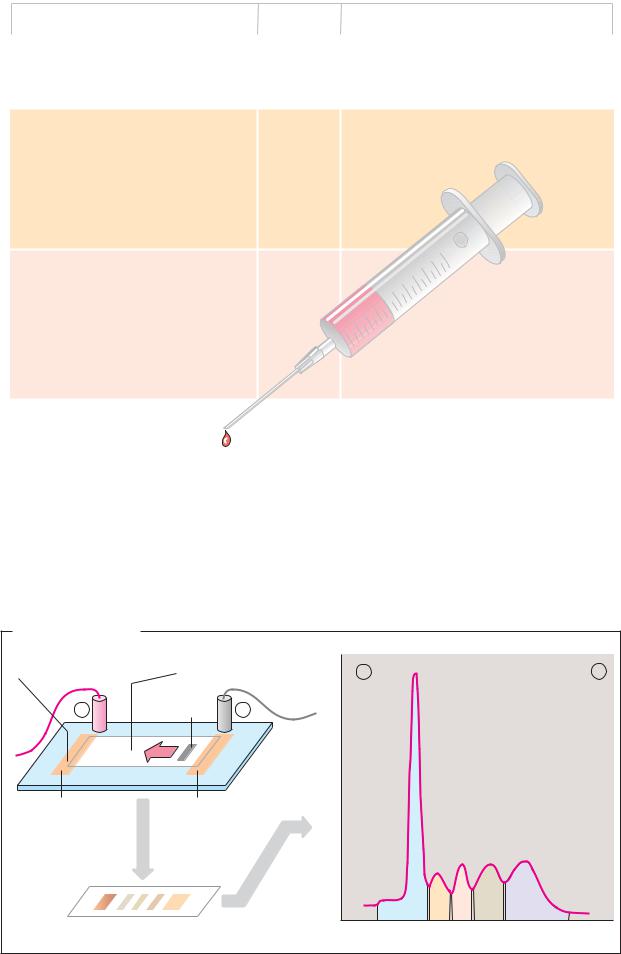
B. Carrier electrophoresis |
||
important plasma protein that is not glycosy- |
|
||
lated. |
|
Proteins and other electrically charged mac- |
|
The albumin fraction also includes trans- |
romolecules can be separated using electro- |
||
thyretin (prealbumin), which together with |
phoresis (see also pp. 78, 262). Among the |
||
other proteins transports the hormone thy- |
various procedures used, carrier electropho- |
||
roxine and its metabolites. |
resis on cellulose acetate foil (CAF) is partic- |
||
The table also lists important globulins in |
ularly simple. Using this method, serum pro- |
||
blood plasma, with their mass and function. |
teins—which at slightly alkaline pH values all |
||
The α- and β-globulins are involved in the |
move towards the anode, due to their excess |
||
transport of lipids (lipoproteins; see p. 278), |
of negative charges—can be separated into |
||
hormones, vitamins, and metal ions. In addi- |
the five fractions mentioned. After the pro- |
||
tion, they provide coagulation factors, pro- |
teins have been stained with dyes, the result- |
||
tease inhibitors, and the proteins of the com- |
ing bands can be quantitatively assessed us- |
||
plement system(see p. 298). Soluble antibod- |
ing densitometry. |
||
ies (immunoglobulins; see p. 300) make up |
|
||
the γ-globulin fraction. |
|
||
Synthesis and degradation. Most plasma proteins are synthesized by the liver. Exceptions to this include the immunoglobulins, which are secreted by B lymphocytes known
|
|
|
|
|
|
|
Blood |
277 |
|
|
|
A. Plasma proteins |
|
|
|
|
|
|
|
|
|
|
Mr in kDa |
|
Function |
|
|
||
|
|
Group |
Protein |
|
|
|
|||
|
|
|
|
|
|
|
|
||
|
|
Albumins: |
Transthyretin |
50-66 |
Transport of thyroxin and triiodothyronin |
|
|
||
|
|
|
Albumin: 45 g · l-1 |
67 |
Maintenance of osmotic pressure; transport of |
|
|
||
|
|
|
|
|
|
fatty acids, bilirubin, bile acids, steroid hor- |
|
|
|
|
|
|
|
|
|
mones, pharmaceuticals and inorganic ions. |
|
|
|
|
|
|
|
|
|
|
|||
|
|
α1-Globulins: Antitrypsin |
51 |
Inhibition of trypsin and other proteases |
|
|
|||
|
|
|
Antichymotrypsin |
58-68 |
Inhibition of chymotrypsin |
|
|
||
|
|
|
Lipoprotein (HDL) |
200-400 |
Transport of lipids |
|
|
||
|
|
|
Prothrombin |
72 |
Coagulation factor II, thrombin precursor |
|
|
||
|
|
|
|
|
|
(3.4.21.5) |
|
|
|
|
|
|
Transcortin |
51 |
Transport of cortisol, corticosterone and |
|
|
||
|
|
|
|
|
|
progesterone |
|
|
|
|
|
|
Acid glycoprotein |
44 |
Transport of progesterone |
|
|
||
|
|
|
Thyroxin-binding globulin |
54 |
Transport of iodothyronins |
|
|
||
|
|
|
|
|
|
|
10m |
|
|
|
|
α2-Globulins: Ceruloplasmin |
135 |
|
8 |
|
|
||
|
|
Transport of copper ions |
|
|
|||||
|
|
|
Antithrombin III |
58 |
Inhibition of blood clotting |
|
|
||
|
|
|
|
|
|
6 |
|
|
|
|
|
|
Haptoglobin |
100 |
Binding4 of hemoglobin |
|
|
||
|
|
|
Cholinesterase (3.1.1.8) |
ca. 350 |
Cleavage2 |
of choline esters |
|
|
|
|
|
|
Plasminogen |
90 |
Precursor of plasmin (3.4.21.7), breakdown |
|
|
||
|
|
|
Macroglobulin |
725 |
of blood clots |
|
|
||
|
|
|
Binding of proteases, transport of zinc ions |
|
|
||||
|
|
|
Retinol-binding protein |
21 |
Transport of vitamin A |
|
|
||
|
|
|
Vitamin D-binding protein |
52 |
Transport of calciols |
|
|
||
|
|
|
|
|
|
|
|
||
|
|
β-Globulins: |
Lipoprotein (LDL) |
2.000-4.500 |
Transport of lipids |
|
|
||
|
|
|
Transferrin |
80 |
Transport of iron ions |
|
|
||
|
|
|
Fibrinogen |
340 |
Coagulation factor I |
|
|
||
|
|
|
Sex hormone- |
|
Transport of testosterone and estradiol |
|
|
||
|
|
|
binding globulin |
65 |
|
|
|||
|
|
|
Transcobalamin |
38 |
Transport of vitamin B12 |
|
|
||
|
|
|
C-reactive protein |
110 |
Complement activation |
|
|
||
|
|
|
|
|
|
|
|
||
|
|
γ-Globulins: |
IgG |
150 |
Late antibodies |
|
|
||
|
|
|
IgA |
162 |
Mucosa-protecting antibodies |
|
|
||
|
|
|
IgM |
900 |
Early antibodies |
|
|
||
|
|
|
IgD |
172 |
B-lymphocyte receptors |
|
|
||
|
|
|
IgE |
196 |
Reagins |
|
|
|
|
|
|
|
|
|
|
|
|
|
|
|
|
|
|
|
|
|
|
|
|
B. Electrophoresis |
|
|
|
|
|
Buffer-saturated strip |
Cellulose-acetate sheet |
+ |
|
– |
|
of filter paper |
soaked with buffer |
52-58% |
|||
|
|
|
|
|
|
+ |
Serum |
– |
|
|
|
sample |
absorption |
|
|
||
|
|
|
|
|
|
|
|
|
Light |
2.4-4.4% |
|
Anode |
Cathode |
|
6.1-10.1% |
|
|
|
|
|
|||
Electro- |
|
|
|
|
|
phoresis |
|
|
|
8.5-14.5% |
|
Staining |
|
Densitometry |
|
|
10-21% |
|
|
|
|
||
Cellulose-acetate sheet |
|
Albumins |
α1- α2- β- |
γ-Globulins |
|
|
|
|
|||


 , pH
, pH


|
|
|
Blood |
287 |
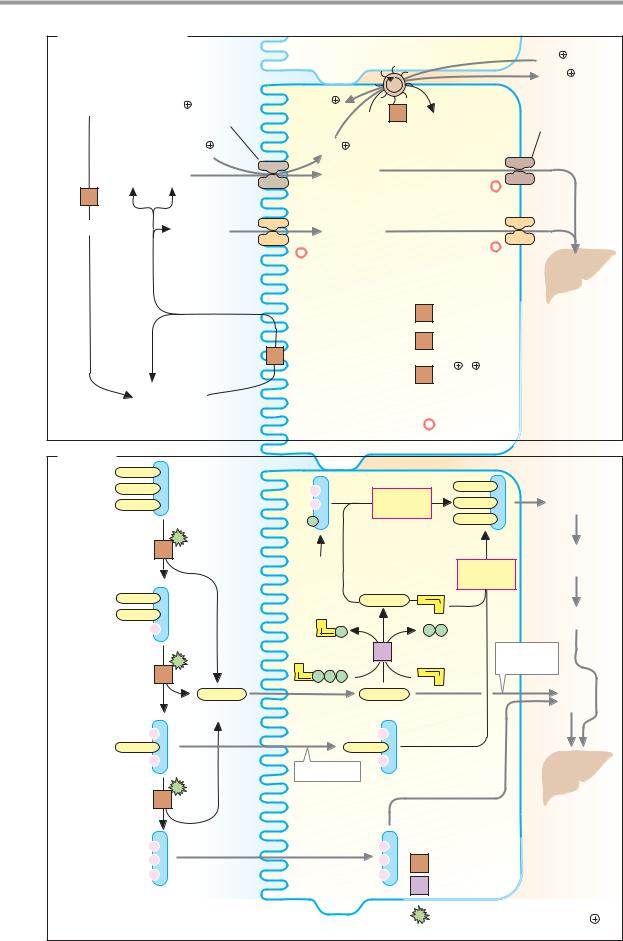
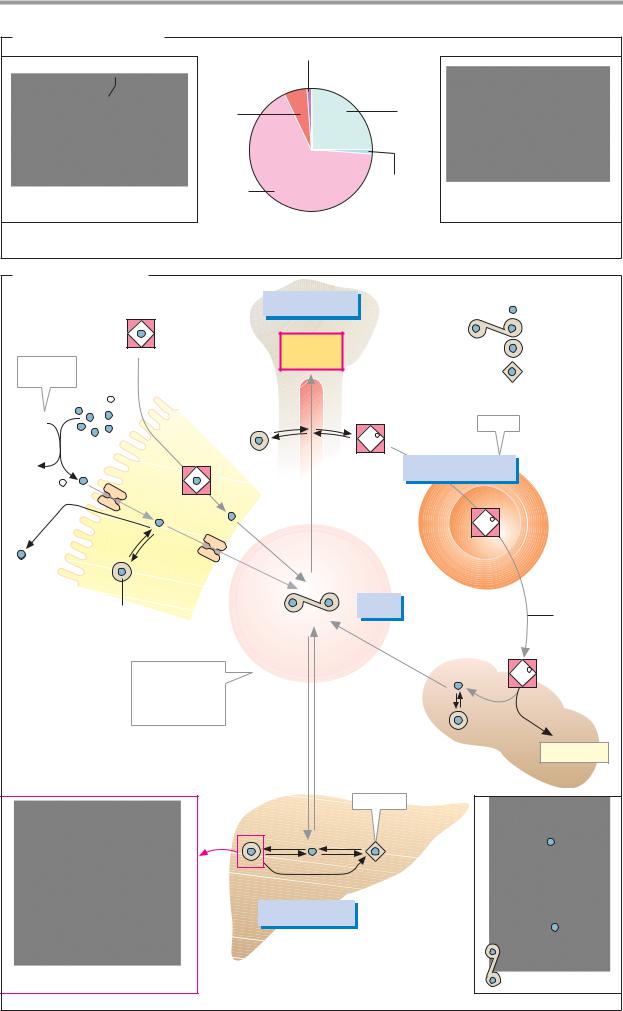
A. Distribution of iron |
Heme enzyme (<1%) |
|
|
|
|
|
|
|
|
O2 |
Myo- |
Transport and |
|
|
|
globin |
storage forms |
|
|
|
(6%) |
(26%) |
|
|
Oxygenated heme |
Hemo- |
Iron–sulfur |
Fe4S4-Cluster |
|
globin |
clusters |
|
||
|
(66%) |
(< 1%) |
|
|
1. Heme iron |
|
|
2. Non-heme iron |
|
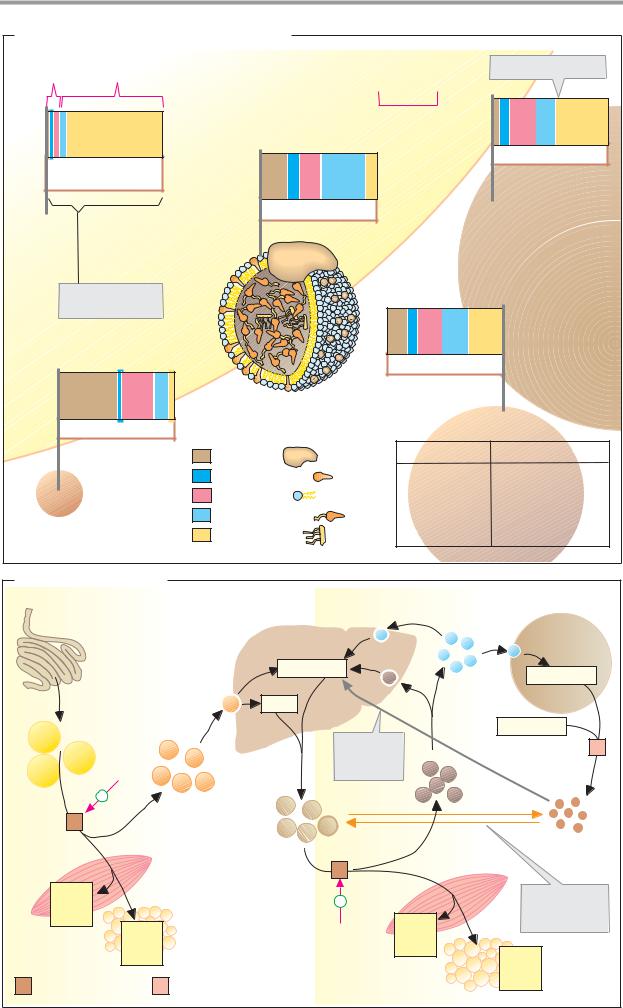
B. Iron metabolism |
|
|
|
|
|
|
|
|
|
|
|
|
|
|
|
|
|
|
|
|
|
|
120 – 150 mg |
|
|
|
Free iron |
||
|
|
|
|
|
|
|
|
|
|
|
|
|
||
|
|
Heme |
|
|
|
|
Erythro- |
|
|
|
Transferrin |
|||
|
|
|
|
|
|
|
|
|
|
|
Ferritin |
|||
E.g., |
|
|
|
|
|
|
|
poiesis |
|
|
|
|||
|
|
|
|
|
|
|
|
|
|
|
|
Hemosiderin |
||
ascorbate |
|
|
|
|
|
|
|
Bone |
|
|
|
|||
|
Fe3+ |
|
|
|
|
|
|
|
|
|
|
|
|
|
|
|
|
|
|
|
|
|
marrow |
|
|
|
|
|
|
XH2 |
|
|
|
|
|
|
|
|
|
|
|
Store |
|
|
|
|
|
|
|
|
|
|
|
Fe2+ |
|
|
|
|
|
X |
|
|
|
|
|
|
|
|
1 |
|
2500 – 3000 mg |
|
||
|
|
|
|
|
|
|
|
|
- |
|
|
|
|
|
Fe |
2+ |
|
|
|
|
|
|
|
d |
|
|
|
|
|
|
|
|
|
|
|
|
. |
|
|
|
|
|
||
|
|
|
|
|
|
|
|
30mg |
|
|
|
|
|
|
|
1 |
|
|
|
|
|
|
|
|
|
|
|
Erythro- |
|
|
- |
|
|
|
|
|
|
|
|
|
Fe2+ |
Heme |
||
. d |
|
|
|
|
|
|
|
|
|
|||||
|
|
|
|
|
|
|
|
|
|
|
|
cytes |
||
1mg |
|
|
|
|
1 |
|
|
|
|
|
|
|
||
|
|
|
|
|
|
|
|
|
|
|
|
|||
|
|
|
|
- |
|
|
|
|
|
|
|
|||
|
|
|
|
|
2 |
mg . |
|
|
|
|
|
|
||
|
|
|
|
|
|
|
|
|
|
|
|
|||
|
|
|
|
|
|
|
|
d- |
|
|
|
|
|
|
|
|
|
|
|
|
|
|
1 |
|
|
|
|
|
|
Intestine |
|
|
|
|
|
|
Trans- |
|
|
|
|
|
|
|
|
Ferritin |
|
|
|
|
|
|
4 mg |
|
|
|
|
||
|
|
|
|
|
|
|
ferrin |
|
|
|
Erythro- |
|||
|
|
|
|
|
|
|
|
|
|
|
|
|||
|
|
|
|
|
|
|
|
|
30 |
|
|
|
|
cyte |
|
|
|
|
|
|
|
|
|
mg . |
|
|
degra- |
||
|
|
|
|
|
|
|
|
|
|
|
|
dation |
||
|
|
|
|
|
|
|
|
|
|
|
d- |
|
|
|
|
Concentration |
|
|
|
Blood |
|
1 |
|
Fe2+ |
|
||||
|
of free iron in |
|
|
|
|
serum |
|
|
|
|
|
|||
|
|
|
|
|
|
|
|
|
|
|
||||
|
the blood |
|
|
|
|
1 |
1 |
|
|
|
|
|
||
|
|
-10 |
|
. |
|
-1 |
|
- |
- |
|
|
|
|
|
|
< 10 |
mol |
l |
|
d |
d |
|
|
|
|
|
|||
|
|
|
|
|
. . |
|
|
|
|
|
||||
|
|
|
|
|
|
|
|
5 mg |
5 mg |
|
|
|
|
Bilirubin |
|
|
|
|
|
|
|
|
|
|
|
|
|
|
|
|
|
|
|
|
|
|
|
|
|
|
|
|
|
Spleen |
|
|
|
|
|
|
|
|
|
Insoluble |
|
|
|
|
|
|
|
|
|
|
|
Ferritin |
Hemosiderin |
|
|
|
||||
|
|
|
|
|
|
|
|
150 – 200 mg |
|
|
|
|
|
|
Apoferritin (section) |
|
|
|
Storage tissue |
|
|
|
|
Lactoferrin |
|||||
|
|
|
|
|
|
(liver, etc.) |
|
|
|
|
|
|
||


|
|
|
|
|
|
|
|
Blood |
291 |
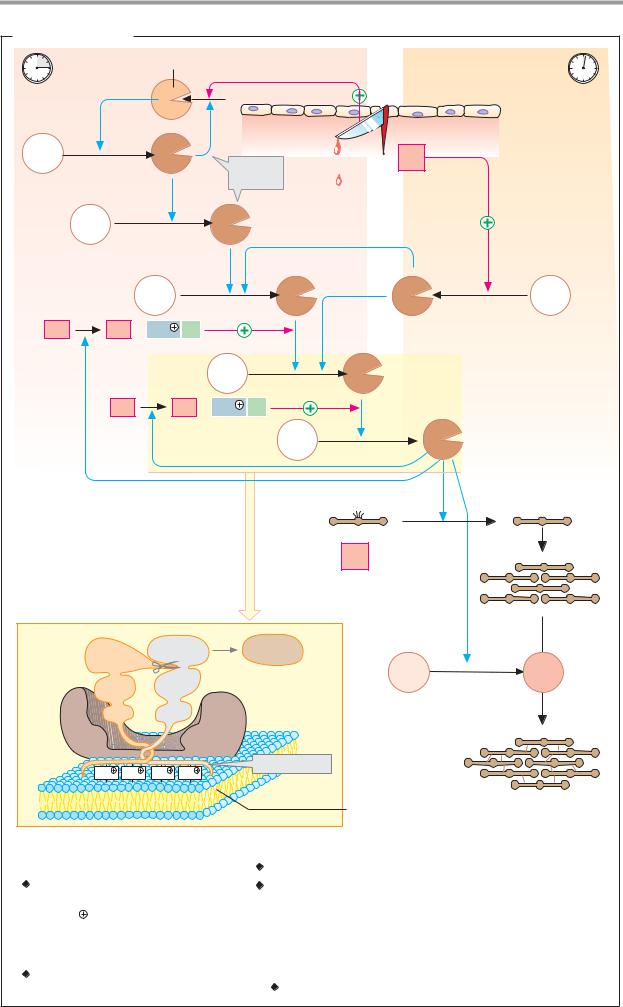
A. Blood clotting |
|
|
|
|
|
|
|
||
|
|
|
Kallikrein |
Intravascular pathway |
Extravascular pathway |
|
|||
~3 min |
|
|
|
|
? |
|
|
|
~10 s |
|
|
|
|
|
|
|
|
||
|
|
|
|
|
|
|
|
Endothelium |
|
|
|
|
|
|
|
|
|
Deeper |
|
XII |
|
|
XIIa |
|
|
|
wall |
|
|
|
|
Function |
|
III |
layers |
|
|||
|
|
|
|
|
|
Thromboplastin |
|
||
|
|
|
|
|
unclear |
|
|
||
|
XI |
|
|
XIa |
|
|
|
|
|
|
|
|
IX |
|
|
IXa |
VIIa |
VII |
|
VIII |
VIIIa + Ca2 |
PL |
|
|
|
|
|
||
|
|
|
|
X |
|
Xa |
|
|
|
|
V |
|
Va + Ca2 |
PL |
|
|
|
|
|
|
|
|
|
|
|
II |
IIa |
Thrombin |
|
|
|
|
|
|
|
Fibrinogen |
|
|
Fibrin |
|
|
|
|
|
|
I |
|
|
|
Prothrombinase complex |
|
|
|
|
Fibrin |
||||
|
|
|
|
|
|
|
|
|
|
|
|
|
|
|
|
|
|
|
polymer |
|
Xa |
|
|
II |
Thrombin |
|
|
|
|
|
|
|
|
IIa |
|
XIII |
XIIIa |
|
|
|
|
|
|
K2 |
|
|
|
||
|
EGF2 |
|
|
|
|
|
|
|
|
|
|
|
|
|
|
|
|
|
|
|
EGF1 |
|
K1 |
|
|
|
|
|
|
|
|
|
|
Va |
|
|
|
|
|
|
Ca2 |
Ca2 |
Ca2 |
Ca2 |
Gla domain |
|
|
|
|
|
|
|
|
|
|
||||
|
|
|
|
|
|
Thrombocyte |
Polymeric |
|
|
|
|
|
|
|
|
membrane |
fibrin network |
||
Coagulation factors |
|
|
|
|
|
|
|||
l Fibrinogen |
|
|
|
lX |
Christmas factor* 3.4.21.22 |
|
|
||
ll Prothrombin* 3.4.21.5 |
X |
Stuart–Prower factor* 3.4.21.6 |
|
||||||
lll Tissue factor/thromboplastin |
Xl |
Plasma thromboplastin antecedent* (PTA) 3.4.21.27 |
|||||||
lV Ca2 |
|
|
|
|
Xll Hageman factor* 3.4.21.38 |
|
|
||
V Proaccelerin |
|
|
Xlll Fibrin-stabilizing factor* 2.3.2.13 |
|
|||||
Vl Synonym for Va |
|
|
|
|
|
|
|||
Vll Proconvertin* 3.4.21.21 |
* |
Proenzyme |
|
|
|
||||
Vlll Antihemophilic factor A |
|
Contains γ-carboxyglutamate |
|
||||||
|
|
Blood |
293 |
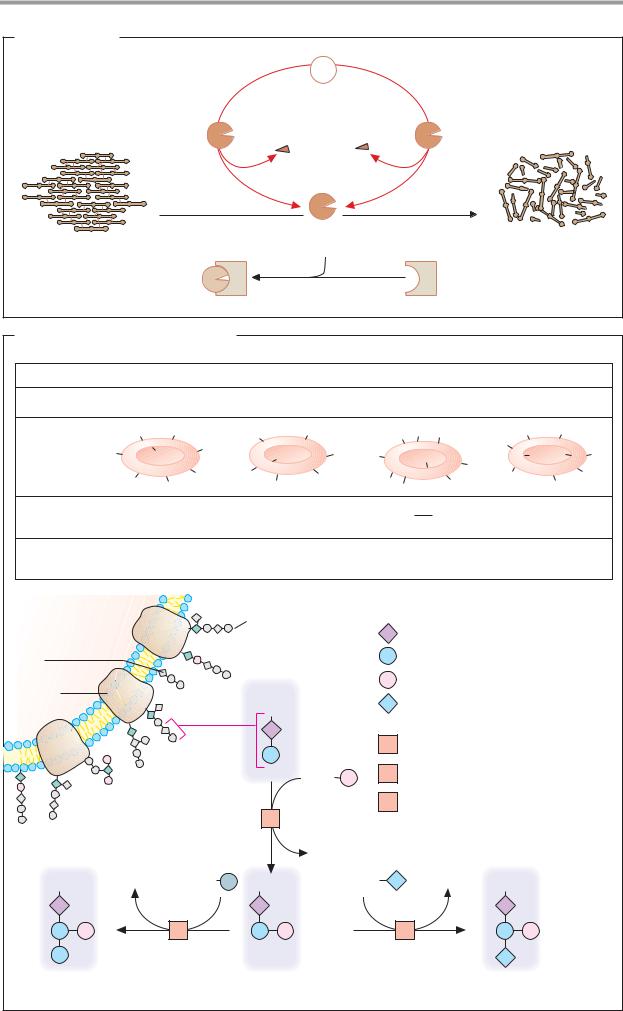
A. Fibrinolysis |
|
|
|
|
Plasminogen |
|
|
Plasminogen |
|
Tissue |
|
activator |
|
plasminogen |
|
3.4.21.73 |
|
activator |
|
|
|
3.4.21.68 |
|
|
Plasmin |
Soluble |
|
Fibrin |
3.4.21.7 |
|
|
proteins |
|
||
thrombus |
|
|
|
|
|
|
|
Inactive plasmin |
|
α2-antiplasmin |
|
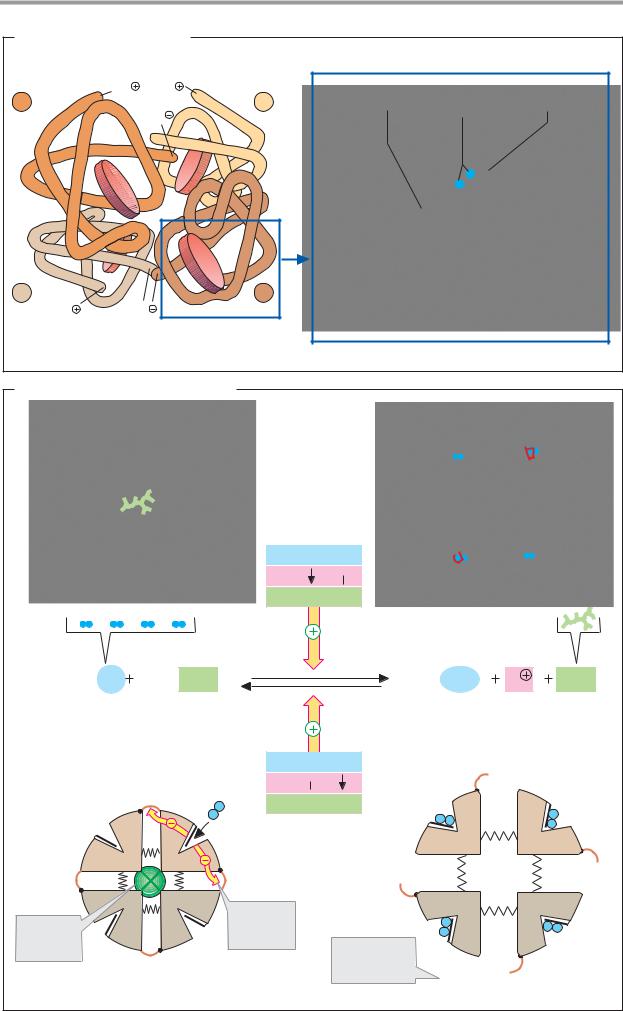
B. Blood groups: the AB0 system
Blood group |
|
|
A |
|
B |
|
|
AB |
|
0 |
|
|
Genotypes |
|
AA and A0 |
BB and B0 |
|
AB |
|
00 |
|
|
|||
|
|
A |
A |
|
B |
B |
|
A A |
B |
H |
H |
|
Antigens |
|
|
A |
A |
|
|
|
|
|
H |
|
|
A |
|
B |
B |
B |
B |
|
H |
H |
H |
|||
|
|
B |
||||||||||
|
|
|
|
A |
B |
B |
|
|
H |
H |
|
|
|
|
A |
A |
B |
A |
A |
|
|||||
|
|
|
B |
|
H |
|
||||||
Antibodies |
|
anti-B |
|
anti-A |
|
|
|
anti-A |
|
|
||
in blood |
|
|
|
|
|
|
|
|
|
anti-B |
|
|
Frequency in |
|
40% |
|
16% |
|
|
4% |
|
40% |
|
||
central Europe |
|
|
|
|
|
|
|
|
|
|
|
|
Erythrocyte |
|
|
|
|
Oligosaccharide |
GP |
Glycoprotein with oligosaccharide |
|||||
Glyco- |
|
|
|
|
|
|
|
N-acetyl-D-glucosamine |
|
|
||
|
|
|
|
|
|
|
|
|
|
|
|
|
lipid |
|
|
|
|
|
|
|
D-Galactose |
|
|
|
|
Membrane |
|
|
|
|
|
|
|
D-Fucose |
|
|
|
|
protein |
|
|
|
|
GP |
|
|
N-acetyl-D-galactosamine |
|
|||
|
|
|
|
|
|
|
|
|||||
|
|
|
|
|
|
|
1 |
Fucosyltransferase 2.4.1.69/152 |
||||
|
|
|
|
|
|
GDP |
2 |
N-acetyl-galactosaminyl |
|
|
||
|
|
|
|
|
|
|
transferase 2.4.1.40 |
|
|
|||
|
|
|
|
|
1 |
|
3 |
Galactosyltransferase 2.4.1.37 |
|
|||
|
|
|
|
|
|
|
|
|
|
|
|
|
|
|
|
|
|
|
GDP |
|
|
|
|
|
|
GP |
|
UDP |
|
UDP |
GP |
|
UDP |
|
UDP |
GP |
|
|
|
|
|
3 |
|
|
|
|
2 |
|
|
|
|
B antigen |
|
|
H antigen (blood group 0) |
|
|
|
A antigen |
|
|
|||