


88 Metabolism
Enzymes: basics
Enzymes are biological catalysts—i.e., substances of biological origin that accelerate chemical reactions (see p.24). The orderly course of metabolic processes is only possible because each cell is equipped with its own genetically determined set of enzymes. It is only this that allows coordinated sequences of reactions (metabolic pathways; see p.112). Enzymes are also involved in many regulatory mechanisms that allow the metabolism to adapt to changing conditions (see p.114). Almost all enzymes are proteins. However, there are also catalytically active ribonucleic acids, the “ribozymes” (see pp.246, 252).
A. Enzymatic activity
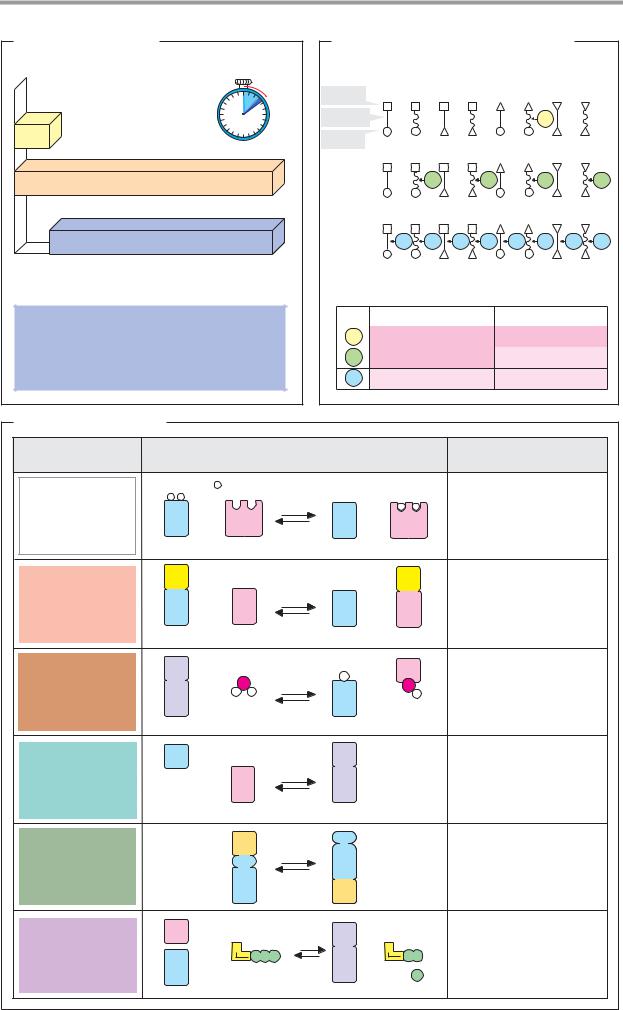
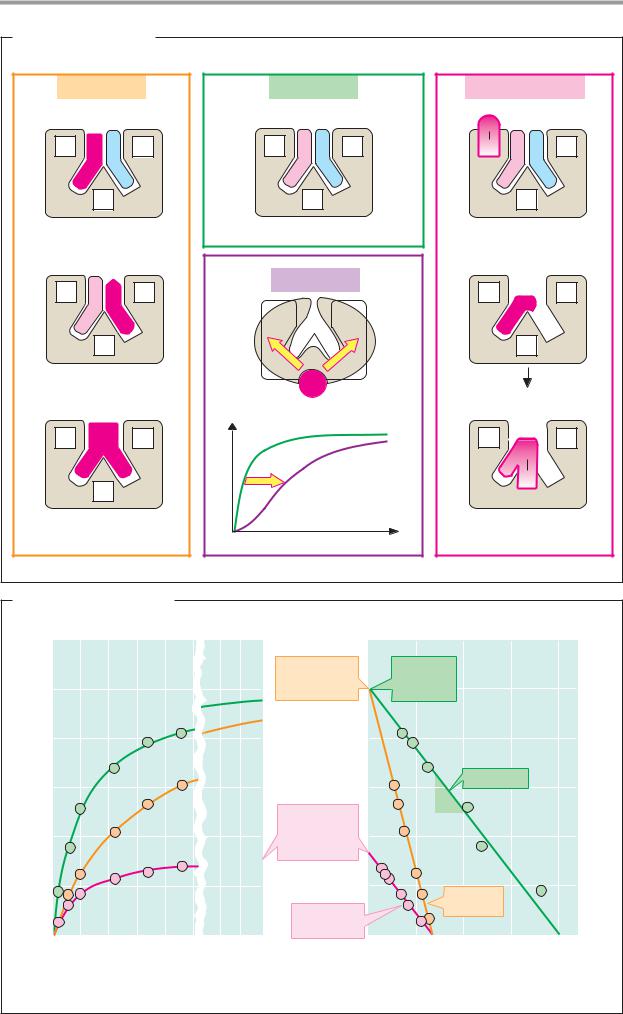
The catalytic action of an enzyme, its activity, is measured by determining the increase in the reaction rate under precisely defined con- ditions—i.e., the difference between the turnover (violet) of the catalyzed reaction (orange) and uncatalyzed reaction (yellow) in a specific time interval. Normally, reaction rates
are expressed as the change in concentration per unit of time (mol 1–1 s–1; see p.22).
Since the catalytic activity of an enzyme is independent of the volume, the unit used for enzymes is usually turnover per unit time, expressed in katal (kat, mol s–1). However, the international unit U is still more commonly used ( mol turnover min–1; 1 U = 16.7 nkat).
B. Reaction and substrate specificity
The action of enzymes is usually very specific. This applies not only to the type of reaction being catalyzed (reaction specificity), but also to the nature of the reactants (“substrates”) that are involved (substrate specificity; see p.94). In Fig. B, this is illustrated schematically using a bond-breaking enzyme as an example. Highly specific enzymes (type A, top) catalyze the cleavage of only one type of bond, and only when the structure of the substrate is the correct one. Other enzymes (type B, middle) have narrow reaction specificity, but broad substrate specificity. Type C enzymes (with low reaction specificity and low substrate specificity, bottom) are very rare.
C. Enzyme classes
More than 2000 different enzymes are currently known. A system of classification has been developed that takes into account both their reaction specificity and their substrate specificity. Each enzyme is entered in the Enzyme Catalogue with a four-digit Enzyme Commission number (EC number). The first digit indicates membership of one of the six major classes. The next two indicate subclasses and subsubclasses. The last digit indicates where the enzyme belongs in the subsubclass. For example, lactate dehydrogenase (see pp.98–101) has the EC number 1.1.1.27 (class 1, oxidoreductases; subclass 1.1, CH–OH group as electron donor; sub-subclass 1.1.1, NAD(P)+ as electron acceptor).
Enzymes with similar reaction specificities are grouped into each of the six major classes:
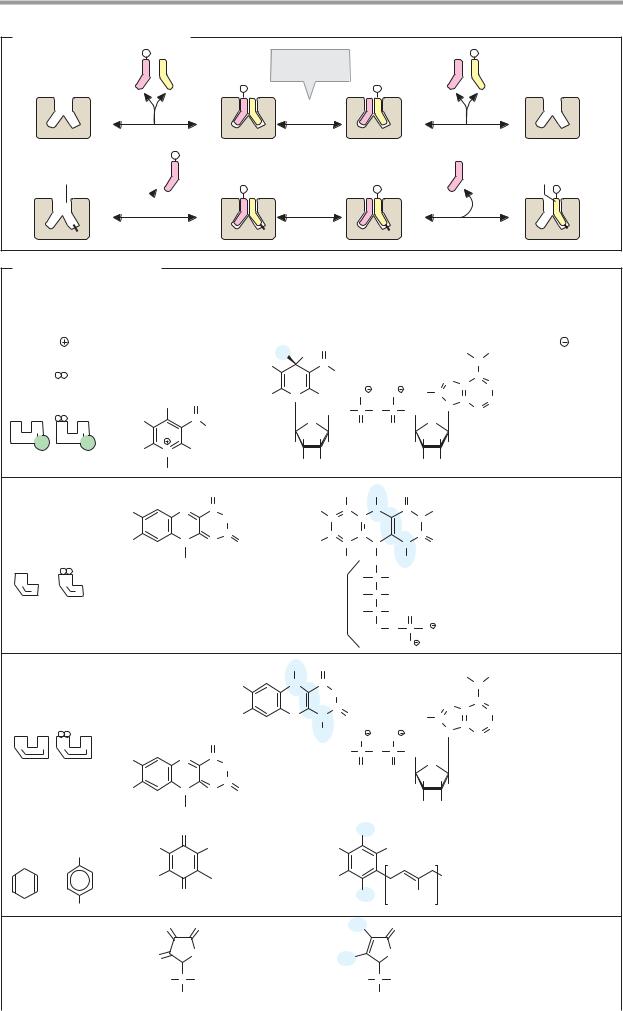
The oxidoreductases (class 1) catalyze the transfer of reducing equivalents from one redox system to another.
The transferases (class 2) catalyze the transfer of other groups from one molecule to another. Oxidoreductases and transferases generally require coenzymes (see pp.104ff.).
The hydrolases (class 3) are also involved in group transfer, but the acceptor is always a water molecule.
Lyases (class 4, often also referred to as “synthases”) catalyze reactions involving either the cleavage or formation of chemical bonds, with double bonds either arising or disappearing.
The isomerases (class 5) move groups within a molecule, without changing the gross composition of the substrate.
The ligation reactions catalyzed by ligases (“synthetases,” class 6) are energy-dependent and are therefore always coupled to the hydrolysis of nucleoside triphosphates.
In addition to the enzyme name, we also usually give its EC number. The annotated enzyme list (pp.420ff.) includes all of the enzymes mentioned in this book, classified according to the Enzyme Catalog system.
|
|
|
Enzymes |
89 |
A. Enzymatic activity |
B. Reaction and substrate specificity |
|
||
|
Group |
|
|
|
Turnover (mol product.s–1) |
Bond |
|
A |
|
|
|
|
|
|
without enzyme |
Group |
|
|
|
Turnover (mol product.s–1) with enzyme |
B |
B |
B |
B |
Enzyme activity (mol.s–1 = kat) |
C C |
C C |
C C C |
C |
|
|
Reaction specificity |
Substrate specificity |
1 Katal (kat): Amount of enzyme |
A |
High |
High |
which increases |
|
|
|
|
|
|
|
turnover by 1 mol.s–1 |
B |
High |
Low |
|
|
|
C |
Low |
Low |
C. The enzyme classes |
|
|
|
|
|
Class |
|
Reaction type |
|
Important subclasses |
|
|
|
= Reduction equivalent |
|
Dehydrogenases |
|
|
|
|
|
|
|
1 Oxidoreductases |
+ |
|
|
|
Oxidases, peroxidases |
|
|
+ |
|
Reductases |
|
|
|
|
|
Monooxygenases |
|
|
|
|
|
|
|
Ared |
|
Box |
Aox |
Bred |
Dioxygenases |
|
|
||||
|
|
|
|
|
C1-Transferases |
2 Transferases |
+ |
|
|
|
Glycosyltransferases |
|
+ |
|
Aminotransferases |
||
|
|
|
|
||
|
|
|
|
|
Phosphotransferases |
A–B |
|
C |
A |
B–C |
|
|
|
|
|
|
Esterases |
3 Hydrolases |
+ |
|
|
|
Glycosidases |
|
|
|
|
Peptidases |
|
|
|
|
|
|
Amidases |
A–B |
|
H2O |
A–H |
B–OH |
|
|
|
|
|
|
C-C-Lyases |
4 Lyases |
+ |
|
|
|
C-O-Lyases |
|
+ |
|
C-N-Lyases |
||
(“synthases”) |
|
|
|
||
|
|
|
|
C-S-Lyases |
|
A |
|
B |
A–B |
|
|
|
|
|
|
|
Epimerases |
5 Isomerases |
|
|
|
|
cis trans Isomerases |
|
|
|
|
Intramolecular |
|
|
|
|
|
|
|
|
|
|
|
|
transferases |
|
|
A |
Iso-A |
|
|
B |
|
X=A,G,U,C |
|
XDP |
C-C-Ligases |
|
|
|
|||
6 Ligases |
+ |
X |
+ |
X |
C-O-Ligases |
P P P |
P P |
C-N-Ligases |
|||
(“synthetases”) |
|
|
|
|
|
|
XTP |
|
P |
C-S-Ligases |
|
A |
|
|
|||
|
|
|
|||
|
A–B |
|
|
||
|
|
|
|
|
|

90 Metabolism
Enzyme catalysis
Enzymes are extremely effective catalysts. They can increase the rate of a catalyzed reaction by a factor of 1012 or more. To grasp the mechanisms involved in enzyme catalysis, we can start by looking at the course of an uncatalyzed reaction more closely.
A. Uncatalyzed reaction
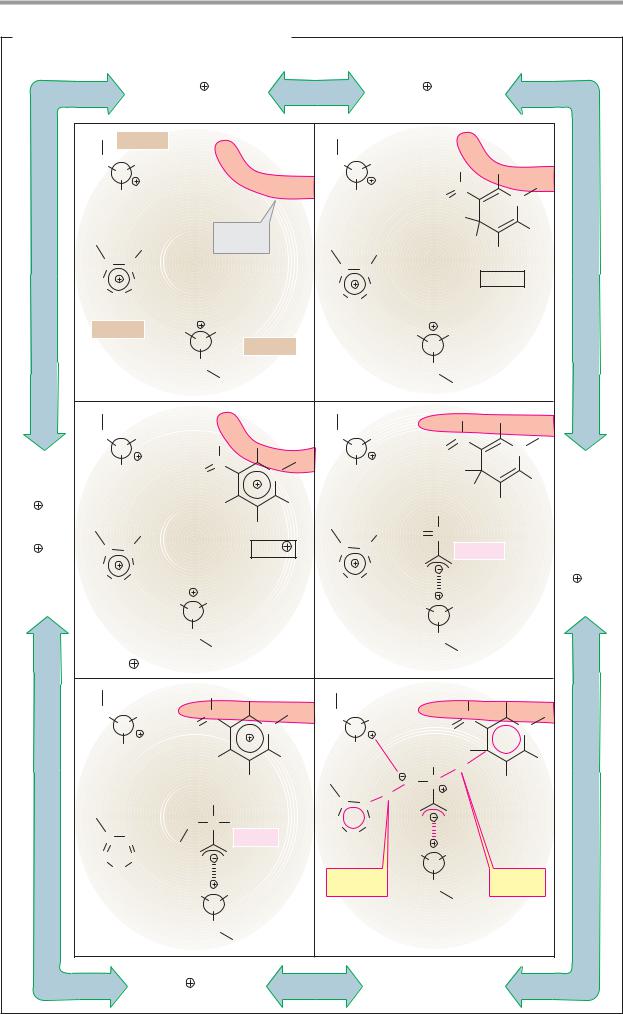
The reaction A + B C + D is used as an example. In solution, reactants A and B are surrounded by a shell of water molecules (the hydration shell), and they move in random directions due to thermal agitation. They can only react with each other if they collide in a favorable orientation. This is not very probable, and therefore only occurs rarely. Before conversion into the products C + D, the collision complex A-B has to pass through a transition state, the formation of which usually requires a large amount of activation energy, Ea (see p.22). Since only a few A–B complexes can produce this amount of energy, a productive transition state arises even less often than a collision complex. In solution, a large proportion of the activation energy is required for the removal of the hydration shells between A and B. However, charge displacements and other chemical processes within the reactants also play a role. As a result of these limitations, conversion only happens occasionally in the absence of a catalyst, and the reaction rate v is low, evenwhen the reaction is thermodynamically possible—i.e., when ∆G < 0 (see p.18).
B. Enzyme-catalyzed reaction
Shown here is a sequential mechanism in which substrates A and B are bound and products C and D are released, in that order. Another possible reaction sequence, known as the “ping-pong mechanism,” is discussed on p.94.
Enzymes are able to bind the reactants (their substrates) specifically at the active center. In the process, the substrates are oriented in relation to each other in such a way that they take on the optimal orientation for the formation of the transition state (1–3). The proximity and orientation of the substrates therefore strongly increase the likelihood
that productive A–B complexes will arise. In addition, binding of the substrates results in removal of their hydration shells. As a result of the exclusion of water, very different conditions apply in the active center of the enzyme during catalysis than in solution (3–5). A third important factor is the stabilization of the transition state as a result of interactions between the amino acid residues of the protein and the substrate (4). This further reduces the activation energy needed to create the transition state. Many enzymes also take up groups from the substrates or transfer them to the substrates during catalysis.
Proton transfers are particularly common. This acid–base catalysis by enzymes is much more effective than the exchange of protons between acids and bases in solution. In many cases, chemical groups are temporarily bound covalently to the amino acid residues of the enzyme or to coenzymes during the catalytic cycle. This effect is referred to as covalent catalysis (see the transaminases, for example; p.178). The principles of enzyme catalysis sketched out here are discussed in greater detail on p.100 using the example of lactate dehydrogenase.
C. Principles of enzyme catalysis
Although it is dif cult to provide quantitative estimates of the contributions made by individual catalytic effects, it is now thought that the enzyme’s stabilization of the transition state is the most important factor. It is not tight binding of the substrate that is important, therefore—this would increase the activation energy required by the reaction, rather thanreducing it—butrather thebinding of the transition state. This conclusion is supported by the very high af nity of many enzymes for analogues of the transition state (see p.96). A simple mechanical analogy may help clarify this (right). To transfer the metal balls (the reactants) from location EA (the substrate state) via the higher-energy transition state to EP (the product state), the magnet (the catalyst) has to be orientated in such a way that its attractive force acts on the transition state (bottom) rather than on EA (top).

|
|
|
|
|
Enzymes |
91 |
A. Uncatalyzed reaction |
|
|
|
|
|
|
Reactants |
Collision |
Transition |
Collision |
Products |
|
|
|
|
complex 1 |
state |
complex 2 |
|
|
|
|
|
|
|
C |
|
A |
+ |
|
|
C |
+ |
|
|
A B |
|
D |
|
||
|
B |
|
|
D |
|
|
|
|
|
|
|
||
B. Enzyme-catalyzed reaction
A |
|
B |
|
X |
Y |
X |
Y |
|
Z |
|
Z |
|
2. E.A-complex |
3. E.A.B-complex |
|
X |
Y |
X |
Y |
Z |
Active site |
|
Z |
1. Freeenzyme E |
4.Transition state E |
X |
Y |
X |
Y |
|
Z |
|
Z |
D
6. E.D-complex
C5. E.C.D-complex
C. Principles of enzyme catalysis |
|
|
|
|||
a |
Approximation and orientation |
|
|
|
||
|
of the substrates |
|
|
Transition |
|
|
|
|
|
|
|
|
|
b |
Exclusion of water |
|
|
state |
|
|
|
|
|
|
|||
c |
Stabilization of the |
|
|
|
|
|
|
transition state |
|
EA |
Ea |
EP |
|
|
|
|
|
|
|
|
d |
Group transfer |
|
|
|
|
|
|
c |
a |
c |
Stabilization |
|
G |
|
of the EA complex |
|
||||
X 


 Y b
Y b 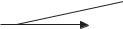
EA |
EP |
d |
|
Z
Stabilization of the transition state
92 Metabolism
Enzyme kinetics I
The kinetics of enzyme-catalyzed reactions (i.e., the dependence of the reaction rate on the reaction conditions) is mainly determined by the properties of the catalyst. It is therefore more complex than the kinetics of an uncatalyzed reaction (see p.22). Here we discuss these issues using the example of a simple first-order reaction (see p.22)
A. Michaelis–Menten kinetics
In the absence of an enzyme, the reaction rate v is proportional to the concentration of substance A (top). The constant k is the rate constant of the uncatalyzed reaction. Like all catalysts, the enzyme E (total concentration [E]t) creates a new reaction pathway. Initially, A is bound to E (partial reaction 1, left). If this reaction is in chemical equilibrium, then with the help of the law of mass action—and taking into account the fact that [E]t = [E] + [EA]—one can express the concentration [EA] of the enzyme–substrate complex as a function of [A] (left). The Michaelis constant Km thus describes the state of equilibrium of the reaction. In addition, we know that kcat > k—in other words, enzyme-bound substrate reacts to B much faster than A alone (partial reaction 2, right). kcat, the enzyme’s turnover number, corresponds to the number of substrate molecules converted by one enzyme molecule per second. Like the conversion A B, the formation of B from EA is a first-order reaction—i.e., v = k [EA] applies. When this equation is combined with the expression already derived for EA, the result is the Michaelis–
Menten equation.
In addition to the variables v and [A], the equationalsocontainstwo parameters thatdo not depend on the substrate concentration [A], but describe properties of the enzyme
itself: the product kcat [E]g is the limiting value for the reaction rate at a very high [A],
the maximum velocity Vmax of the reaction (recommended abbreviation: V). The Michaelis constant Km characterizesthe af nity of the enzyme for a substrate. It corresponds to the substrate concentration at which v reaches
half of Vmax (if v = Vmax/2, then [A]/(Km + [A]) = 1/2, i.e. [A] is then = Km). A high af nity
of the enzyme for a substrate therefore leads to a low Km value, and vice versa. Of the two
enzymes whose substrate saturation curves
are shown in diagram 1, enzyme 2 has the higher af nity for A [Km = 1 mmol l–1);
Vmax, by contrast, is much lower than with enzyme 1.
Since v approaches V asymptotically with increasing values of [A], it is dif cult to obtain reliable values for Vmax—and thus for Km as well—from diagrams plotting v against [A]. To get around this, the Michaelis–Menten equation can be arranged in such a way that the measured points lie on a straight line. In the
Lineweaver–Burk plot (2), 1/v is plotted against 1/[A]. The intersections of the line of best fit with the axes then produce 1/Vmax and—1/Km. This type of diagram is very clear, but for practical purposes it is less suitable for determining Vmax and Km. Calculation methods using personal computers are faster and more objective.
B. Isosteric and allosteric enzymes
Manyenzymescanoccurinvarious conformations (see p.72), whichhave differentcatalytic properties and whose proportion of the total number of enzyme moleculesis influenced by substrates and other ligands (see pp.116 and 280, for example). Allosteric enzymes of this type, which are usually present in oligomeric form, can be recognized by their S-shaped (sigmoidal) saturation curves, which cannot be described using the Michaelis model. In the case of isosteric enzymes (with only one enzyme conformation, 1), the ef ciency of substrate binding (dashed curve) declines constantly with increasing [A], because the number of free binding sites is constantly decreasing. In most allosteric enzymes (2), the binding ef ciency initially rises with increasing [A], because the free enzyme is present in a low-af nity conformation (square symbols), which is gradually con- vertedintoahigher-af nityform(roundsymbols) as a result of binding with A. It is only at high [A] values that a lack of free binding sites becomes noticeable and the binding strength decreasesagain. In other words, the af nityof allosteric enzymes is not constant, but depends on the type and concentration of the ligand.
Enzymes 93
A. Michaelis Menten kinetics
Enzyme-catalyzed reaction |
|
|
Uncatalyzed reaction |
|
A |
|
|
|
|
|
|
|
||
|
v = k · [A] |
|||
|
|
|
||
Partial reaction 1: |
|
|
|
|
formation and decay |
|
|
|
|
of enzyme–substrate |
|
|
E |
|
complex EA |
|
|
||
|
|
|
|
|
BEnzyme-catalyzed reaction
Partial reaction 2: formation of the product of EA
|
E + A |
|
Km |
|
|
Km |
|
EA |
|
kcat |
|
|
[EA] |
|
kcat |
|
E + B |
|
||||
|
|
EA |
|
|
|
|
|
|
|
|
|
|
|
|
||||||||
|
|
|
|
|
[A] |
|
|
|
A |
|
|
|
|
|
|
|
|
|
|
|
|
|
|
[EA] = [E]g · |
|
|
|
|
|
|
|
|
|
v = kcat · [EA] |
|
|
|
||||||||
|
|
|
|
|
Km + [A] |
|
|
|
E |
|
|
|
|
|
|
|
||||||
|
Michaelis constant |
|
|
|
|
|
|
|
Maximum velocity |
-1 |
-1 |
|
||||||||||
|
|
K |
|
(mol·l-1) |
|
|
|
|
|
|
|
V |
|
= k |
|
· [E] |
|
|
) |
|||
|
|
m |
|
|
|
|
kcat [E]g |
· [A] |
|
|
g |
(mol · l |
· s |
|||||||||
|
|
|
|
|
|
|
v = |
max |
cat |
|
|
|
|
|
||||||||
|
|
|
|
|
|
|
|
Km |
+ |
[A] |
|
|
|
|
|
|
|
|
|
|
||
|
|
|
|
|
|
|
|
|
|
|
|
|
|
|
|
|
|
|
|
|||
|
10 |
|
|
|
|
|
|
|
|
|
1/v |
1.0 |
|
|
|
|
|
|
|
|
|
|
|
8 |
|
|
|
|
Enzyme 1 |
|
|
|
0.8 |
|
|
|
|
|
|
|
|
|
|
||
|
|
|
|
|
|
|
|
Reciprocal velocity |
|
|
|
|
|
|
|
|
|
|
||||
|
|
|
|
|
|
|
|
|
|
|
|
|
|
|
|
|
|
|
|
|||
Velocity v |
6 |
|
|
|
|
|
|
|
|
|
0.6 |
-1/Km |
|
|
|
|
|
|
|
|||
|
|
|
|
|
|
|
|
|
|
|
|
|
|
|
|
|
|
|||||
4 |
|
|
|
|
|
|
|
|
|
0.4 |
-1/Km |
|
|
|
|
|
|
|
|
|
||
|
|
|
|
|
|
|
|
|
|
|
|
|
|
|
|
|
|
|
|
|||
2 |
|
|
|
|
Enzyme 2 |
|
|
|
|
0.2 |
|
|
|
|
|
|
|
|
|
|
||
|
|
|
|
|
|
|
|
|
|
|
|
1/Vmax |
|
|
|
|
||||||
0 |
|
|
|
|
|
|
Vmax |
Vmax |
0.0 |
|
|
|
|
1/Vmax |
|
|||||||
|
Km 2 |
4 Km 6 |
|
|
|
|
|
|
|
|
|
|
|
|||||||||
|
|
|
|
|
|
|
|
|
|
|
|
|
|
|
|
|
||||||
|
0 |
8 |
10 |
90 |
95 |
100 |
|
-1.0 |
-0.5 |
0.0 |
0.5 |
1.0 |
1.5 |
2.0 |
||||||||
Concentration [A] (mM) |
Reciprocal concentration 1/[A] (mM–1) |
1. Hyperbolic plot |
2. Lineweaver–Burk plot |
B. Isosteric and allosteric enzymes |
|
|
|
|
|
||||
|
|
Isosteric |
|
|
|
|
Allosteric |
|
|
|
|
(n=1) |
|
|
|
|
(n=3) |
|
|
|
Vmax |
|
|
|
|
Vmax |
|
|
|
Velocity v |
|
|
|
|
Velocity v |
|
|
Bonding |
|
|
|
|
|
|
|
|
|
strenght |
|
|
|
Bonding |
|
|
|
|
|
|
|
|
|
strenght |
|
|
|
|
|
|
|
|
|
Km |
|
|
|
|
[A]O.5 |
|
|
0 |
5 |
10 |
15 |
20 |
0 |
5 |
10 |
15 |
20 |
|
[A] (mmol · l–1) |
|
|
[A] (mmol · l–1) |
|
||||

94 Metabolism
Enzyme kinetics II
The catalytic properties of enzymes, and consequently their activity (see p.90), are influenced by numerous factors, which all have to be optimized and controlled if activity measurements are to be carried out in a useful and reproducible fashion. These factors include physical quantities (temperature, pressure), the chemical properties of the solution (pH value, ionic strength), and the concentrations of the relevant substrates, cofactors, and inhibitors.
A. pH and temperature dependency of enzyme activity
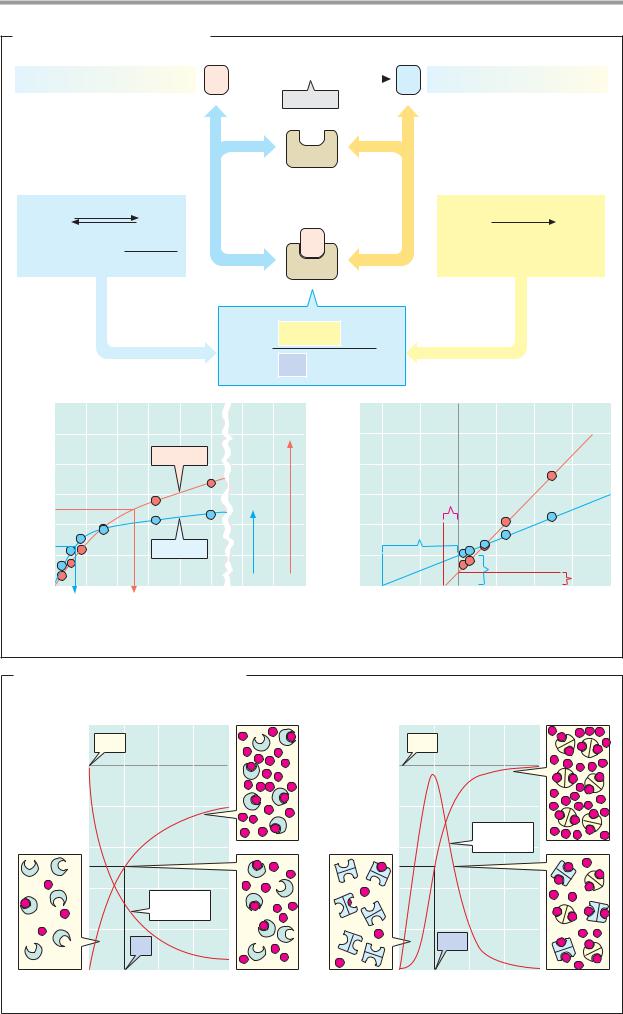
The effect of enzymes is strongly dependent on the pH value (see p.30). When the activity is plotted against pH, a bell-shaped curve is usually obtained (1). With animal enzymes, the pH optimum—i.e., the pH value at which enzyme activity is at its maximum—is often close to the pH value of the cells (i.e., pH 7). However, there are also exceptions to this. For example, the proteinase pepsin (see p.270), which is active in the acidic gastric lumen, has a pH optimum of 2, while other enzymes (at least in the test tube) are at their most active at pH values higher than 9. The bell shape of the activity–pH profile results from the fact that amino acid residues with ionizable groups in the side chain are essential for catalysis. In example (1), these are a basic group B (pKa = 8), which has to be protonated in order to become active, and a second acidic amino acid AH (pKa = 6), which is only active in a dissociated state. At the optimum pH of 7, around 90% of both groups are present in the active form; at higher and lower values, one or the other of the groups increasingly passes into the inactive state.
The temperature dependency of enzymatic activity is usually asymmetric. With increasing temperature, the increased thermal movement of the molecules initially leads to a rate acceleration (see p.22). At a certain temperature, the enzyme then becomes unstable, and its activity is lost within a narrow temperature difference as a result of denaturation (see p.74). The optimal temperatures of the enzymes in higher organisms rarely exceed 50 °C, while enzymes from thermophilic bacteria found in hot springs, for instance, may still be active at 100 °C.
B. Substrate specificity
Enzymes “recognize” their substrates in a highly specific way (see p.88). It is only the marked substrate specificity of the enzymes that makes a regulated metabolism possible. This principle can be illustrated using the example of the two closely related proteinases trypsin and chymotrypsin. Both belong to the group of serine proteinases and contain the same “triad” of catalytically active residues (Asp–His–Ser, shown here in green; see p.176). Trypsin selectively cleaves peptide bonds on the C-terminal side of basic amino acids (lysine and arginine), while chymotrypsin is specific for hydrophobic residues. The substrate binding “pockets” of both enzymes have a similar structure, but their amino acid sequences differ slightly. In trypsin, a negatively charged aspartate residue (Asp-189, red) is arranged in such a way that it can bind and fix the basic group in the side chain of the substrate. In chymotrypsin, the “binding pocket” is slightly narrower, and it is lined with neutral and hydrophobic residues that stabilize the side chains of apolar substrate amino acids through hydrophobic interactions (see p.28).
C. Bisubstrate kinetics
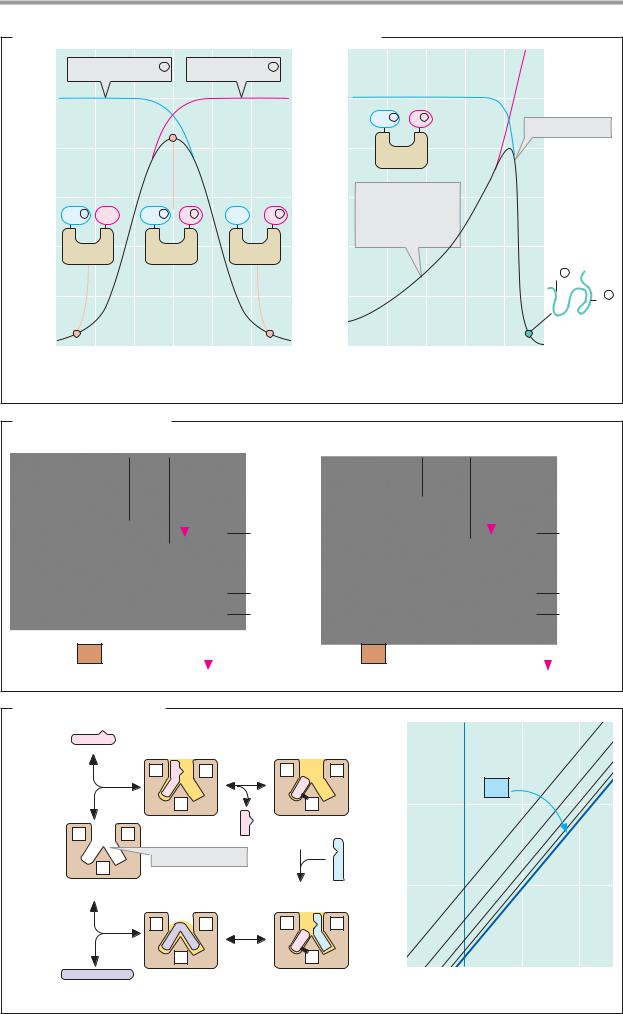
Almost all enzymes—in contrast to the simplified description given on p.92—have more than one substrate or product. On the other hand, it is rare for more than two substrates to be bound simultaneously. In bisubstrate reactions of the type A + B C + D, a number of reaction sequences are possible. In addition to the sequential mechanisms (see p.90), in which all substrates are bound in a specific sequence before the product is released, there are also mechanisms in which the first substrate A is bound and immediately cleaved. A part of this substrate remains bound to the enzyme, and is then transferred to the second substrate B after the first product C has been released. This is known as the ping-pong mechanism, and it is used by transaminases, for example (see p.178). In the Lineweaver— Burk plot (right; see p.92), it can be recognized in the parallel shifting of the lines when [B] is varied.
Enzymes 95
A. pH and temperature dependency of enzyme activity
Proportion BH + |
Proportion A - |
1.0 |
1.0 |
BH + A- Denaturation
0.8 |
0.8 |
Enzyme |
|
active |
|||
|
|
Activity |
0.6 |
|
|
|
Activity |
0.6 |
Increased |
BH + A- |
|
A- |
activity due |
||||
|
|
|
|||||
|
BH + AH |
B |
|
|
|||
|
|
|
to temperature |
||||
|
0.4 |
|
|
|
|
0.4 |
increase |
|
|
|
|
|
|
BH +
0.2 |
|
|
|
|
|
|
0.2 |
|
|
|
|
A- |
|
|
|
|
|
|
|
|
|
|
|
|
Enzyme |
0.0 |
|
|
|
|
|
|
0.0 |
|
|
|
|
denatured |
4 |
5 |
6 |
7 |
8 |
9 |
10 |
0 |
10 |
20 |
30 |
40 |
50 |
|
|
|
pH |
|
|
|
|
|
Temperature (°C) |
|
||
B. Substrate specificity |
|
|
|
|
|
|
|
|
|
|||
|
|
Asp-189 |
Substrate (-X-Arg-Y-) |
Ser-189 |
Substrate (-X-Phe-Y-) |
|||||||
|
|
|
|
|
Ser-195 |
|
|
|
|
|
Ser-195 |
|
|
|
|
|
|
His-57 |
|
|
|
|
|
His-57 |
|
|
|
|
|
|
Asp-102 |
|
|
|
|
|
Asp-102 |
|
|
1 |
Trypsin (3.4.21.4) |
|
|
2 |
Chymotrypsin (3.4.21.1) |
||||||
|
|
–X–Y–Arg (Lys)–Z– |
|
|
|
–X–Y–Tyr (Trp, Phe, Leu)–Z– |
||||||
C. Bisubstrate kinetics |
3. Covalent |
|
|
|
||||
|
|
|
|
|
|
|
||
|
A |
2. EA complex |
intermediate |
|
|
|
||
|
|
product E' |
|
|
|
|||
|
|
|
|
|
|
|
||
|
|
X |
Y |
X |
Y |
|
|
|
|
|
|
|
|
|
|
{B} |
|
|
|
|
Z |
|
Z |
1/velocity |
|
|
X |
|
Y |
|
P1 |
|
|
|
|
|
Z |
|
Active center |
|
B |
|
|
|
|
|
|
|
|
|
|
||
|
|
|
|
|
|
|
|
|
1. Free enzyme E |
|
|
|
|
|
|
||
|
|
X |
Y |
X |
Y |
|
|
|
|
|
|
Z |
|
Z |
|
|
|
|
P2 |
5. EP2 complex |
4. E'B complex |
0 |
2 |
4 |
||
|
|
|
1/{A}(mM-1) |
|
||||
|
|
|
|
|
|
|
|
|

96 Metabolism
Inhibitors
Many substances can affect metabolic processes by influencing the activity of enzymes. Enzyme inhibitors are particularly important here. A large proportion of medicines act as enzyme inhibitors. Enzymekinetic experiments are therefore an important aspect of drug development and testing procedures. Natural metabolites are also involved in regulatory processes as inhibitors (see p.114).
A. Types of inhibitor
Most enzyme inhibitors act reversibly—i.e., they do not cause any permanent changes in the enzyme. However, there are also irreversible inhibitors that permanently modify the target enzyme. The mechanism of action of an inhibitor—its inhibition type—can be determined by comparing the kinetics (see p.92) of the inhibited and uninhibited reactions (B). This makes it possible to distinguish competitive inhibitors (left) from noncompetitive inhibitors (right), for example. Allosteric inhibition is particularly important for metabolic regulation (see below).
Substrate analogs (2) have properties similar to those of one of the substrates of the target enzyme. They are bound by the enzyme, but cannot be converted further and therefore reversibly block some of the enzyme molecules present. A higher substrate concentration is therefore needed to achieve a halfmaximum rate; the Michaelis constant Km increases (B). High concentrations of the substrate displace the inhibitor again. The maximum rate Vmax is therefore not influenced by this type of inhibition. Because the substrate and the inhibitor compete with one another for the same binding site on the enzyme, this type of inhibition is referred to as competitive. Analogs of the transition state (3) usually also act competitively.
When an inhibitor interacts with a group that is important for enzyme activity, but does not affect binding of the substrate, the inhibition is non-competitive (right). In this case, Km remains unchanged, but the concentration of functional enzyme [E]t, and thus Vmax, decrease. Non-competitive inhibitors generally act irreversibly, by modifying functional groups of the target enzyme (4).
“Suicide substrates” (5) are substrate analogs that also contain a reactive group. Initially, they bind reversibly, and then they form a covalent bond with the active center of the enzyme. Their effect is therefore also non-competitive. A well-known example of this is the antibiotic penicillin (see p.254).
Allosteric inhibitors bind to a separate binding site outside the active center (6). This results in a conformational change in the enzyme protein that indirectly reduces its activity (see p.116). Allosteric effects practically only occur in oligomeric enzymes. The kinetics of this type of system can no longer be described using the simple Micha- elis–Menten model.
B. Inhibition kinetics
In addition to the Lineweaver–Burk plot (see p.92), the Eadie–Hofstee plot is also commonly used. In this case, the velocity v is plotted against v /[A]. In this type of plot,
Vmax corresponds to the intersection of the approximation lines with the v axis, while
Km is derived from the gradient of the lines. Competitive and non-competitive inhibitors are also easily distinguishable in the Eadie— Hofstee plot. As mentioned earlier, competitive inhibitors only influence Km, and not
Vmax. The lines obtained in the absence and presence of an inhibitor therefore intersect on
the ordinate. Non-competitive inhibitors produce lines that have the same slope (Km unchanged) but intersect with the ordinate at a lower level. Another type of inhibitor, not
shown here, in which Vmax and Km are reduced by the same factor, is referred to as
uncompetitive. Inhibitors with purely uncompetitive effects are rare. A possible explanation for this type of inhibition is selective binding of the inhibitor to the EA complex.
Allosteric enzymes shift the target enzyme’s saturation curve to the left (see p.92). In Eadie–Hofstee and Lineweaver–Burk plots (see p.92), allosteric enzymes are recognizable because they produce curved lines (not shown).
Enzymes 97
A. Types of inhibitor
Competitive |
1. |
Uninhibited |
|
Noncompetitive |
|||
|
|
|
|
|
|
I |
|
C |
I |
C |
|
C |
C |
C |
C |
C |
C |
C |
a
4. Modifying reagent
C |
|
|
Allosteric |
|
I |
C |
C |
C |
|
|
|
|
|
I |
b |
C |
C |
|
a |
|
|
|
|
2. Substrate analogs |
I |
|
|
|
|
C |
I |
C |
v |
C |
C |
|
|||||
|
|
|
|
|
I |
C |
|
C |
|
b |
|
|
|
|
3. Transition state |
6. |
[A] |
5. “Suicide substrate” |
||
analog |
|
|
B. Kinetics of inhibition |
|
|
|
|
|
|
|
|||
|
|
|
|
|
Competitive |
Maximal |
|
|
|
|
|
|
|
|
|
inhibition: |
|
|
|
|
|
|
10 |
|
|
|
velocity V |
|
10 |
|
||
|
|
|
|
V unchanged |
|
|
||||
v (nkat) |
8 |
|
|
|
|
|
|
|
8 |
v (nkat) |
6 |
|
|
|
|
|
Slope = Km |
6 |
|||
Velocity |
|
|
|
|
|
|
|
Velocity |
||
|
|
|
|
Non- |
|
|
|
|
||
4 |
|
|
|
competitive |
|
|
|
4 |
||
|
|
|
inhibition: |
|
|
|
||||
|
|
|
|
|
|
|
|
|||
|
|
|
|
|
V reduced |
|
|
|
|
|
|
2 |
|
|
|
|
|
Km |
|
2 |
|
|
|
|
|
|
|
|
|
|
|
|
|
|
|
|
|
Km |
|
increased |
|
|
|
|
|
|
|
|
|
|
|
|
|
|
|
0 |
|
|
|
unchanged |
|
|
|
0 |
|
|
|
|
|
|
|
|
|
|
||
|
0 |
10 |
20 |
80 90 100 |
0.0 |
0.5 |
1.0 |
1.5 |
2.0 |
|
|
Substrate concentration [A] (mM) |
|
v/[A] (nkat · mM –o) |
|
|
|||||
1. Hyperbolic plot |
|
|
2. Eadie Hofstee plot |
|
|
|
||||

98 Metabolism
Lactate dehydrogenase: structure
Lactate dehydrogenase (LDH, EC 1.1.1.27) is discussed in some detail here and on the next page as an example of the structure and function of an enzyme.
A. Lactate dehydrogenase: structure
The active form of lactate dehydrogenase (mass 144 kDa) is a tetramer consisting of four subunits (1). Each monomer is formed by a peptide chain of 334 amino acids (36 kDa). In the tetramer, the subunits occupy equivalent positions (1); each monomer has an active center. Depending on metabolic conditions, LDH catalyzes NADH-de- pendent reduction of pyruvate to lactate, or NAD+-dependent oxidation of lactate to pyruvate (see p.18).
The active center of an LDH subunit is shown schematically in Fig. 2. The peptide backbone is shown as a light blue tube. Also shown are the substrate lactate (red), the coenzyme NAD+ (yellow), and three amino acid side chains (Arg-109, Arg-171, and His195; green), which are directly involved in the catalysis. A peptide loop (pink) formed by amino acid residues 98–111 is also shown. In the absence of substrate and coenzyme, this partial structure is open and allows access to the substrate binding site (not shown). In the enzyme lactate NAD+ complex shown, the peptide loop closes the active center. The catalytic cycle of lactate dehydrogenase is discussed on the next page.
B. Isoenzymes
There are two different LDH subunits in the organism—M and H—which have a slightly different amino acid sequence and consequentlydifferentcatalyticproperties. Asthese two subunits can associate to form tetramers randomly, a total of five different isoenzymes of LDH are found in the body.
Fig. 1 shows sections from the amino acid sequences of the two subunits, using the sin- gle-letter notation (see p.60). A common precursor gene was probably duplicated at some point in evolution. The two genes then continued to develop further independently of each other through mutation and selection.
The differences in sequence between the M and H subunits are mainly conservative—i.e., both residues are of the same type, e.g. glycine (G) and alanine (A), or arginine (R) and lysine (K). Non-conservative exchanges are less frequent—e.g., lysine (K) for glutamine (Q), or threonine (T) for glutamic acid (E). Overall, the H subunit contains more acidic and fewer basicresiduesthanthe Mform, and it therefore has a more strongly negative charge. This fact is exploited to separate the isoenzymes using electrophoresis (2; see pp.78, 276). The isoenzyme LDH-1, consisting of four H subunits, migrates fastest, and the M4 isoenzyme is slowest.
The separation and analysis of isoenzymes in blood samplesisimportant in the diagnosis of certain diseases. Normally, only small amounts of enzyme activity are found in serum. When an organ is damaged, intracellular enzymes enter the blood and can be demonstrated in it (serum enzyme diagnosis). The total activity of an enzyme reflects the severity of the damage, while the type of isoenzyme found in the blood provides evidence of the site of cellular injury, since each of the genes is expressed in the various organs at different levels. For example, the liver and skeletal muscles mainly produce M subunits of lactate dehydrogenase (M for muscle), while the brain and cardiac muscle mainly express H subunits (H for heart). In consequence, each organ has a characteristic isoenzyme pattern (3). Following cardiac infarction, for example, there is a strong increase in the amount of LDH-1 in the blood, while the concentration of LDH-5 hardly changes. The isoenzymes of creatine kinase (see p.336) are also of diagnostic importance.

|
|
|
|
|
Enzymes |
99 |
A. Lactate dehydrogenase: structure |
|
|
|
|
|
|
|
|
Pyruvate |
|
Lactate |
|
Lactate |
|
|
|
dehydrogenase |
|||
|
|
|
|
1.1.1.27 |
|
|
|
|
NADH + H |
|
NAD |
||
|
|
N |
A |
|
N |
A |
1. Tetramer 144 kDa |
|
|
|
|
|
|
2. Active center |
Substrate |
Mobile |
Coenzyme |
|
||
|
|
|||||
Essential |
(lactate) |
loop |
|
(NAD |
) |
|
amino |
|
|
|
|
Enzyme |
|
acids |
|
|
|
|
protein |
|
Arg-109 |
|
|
|
|
|
|
His-195 |
|
|
|
|
|
|
Arg-171 |
|
|
|
|
|
|
B. Isoenzymes
Lactate dehydrogenase M RYLMGERLGVHPLSCHGWVLGEHGDSSVPVWSGMNVAGCSLKTLHPDL GTD..
1. Gene
RYLMAEKLG I HPSSCHGW I LGEHGDSSVAVWSGV NVAGVSLQELNPEMGTD.. Lactate dehydrogenase H
LDH1 |
(H4) |
Skeletal muscle |
|
|
|
|
|
|
|
|
|
|
|
LDH2 (M1H3) |
Liver |
|
|
|
|
|
|
|
|
|
|
|
|
LDH3 (M2H2) |
Brain |
|
|
|
|
|
|
|
|
|
|
|
|
LDH4 (M3H1) |
|
|
|
|
|
|
|
|
Cardiac muscle |
|
|
|
|
LDH5 |
(M4) |
LDH5 |
LDH4 |
LDH3 |
LDH2 |
LDH1 |
|
|
|||||
2. Forms |
3. Separation by gel electrophoresis |
|
|
|
||

100 Metabolism
Lactate dehydrogenase: mechanism
The principles of enzyme catalysis discussed on p.90 can be illustrated using the reaction mechanism of lactate dehydrogenase (LDH) as an example.
A. Lactate dehydrogenase: catalytic cycle
LDH catalyzes the transfer ofhydride ions (see p.32) from lactate to NAD+ or from NADH to pyruvate.
L-lactate + NAD+ ↔pyruvate + NADH + H+
The equilibrium of the reaction strongly favors lactate formation. At high concentrations of lactate and NAD+, however, oxidation of lactate to pyruvate is also possible (see p.18). LDH catalyzes the reaction in both directions, but—like all enzymes—it has no effect on chemical equilibrium.
As the reaction is reversible, the catalytic process can be represented as a closed loop. The catalytic cycle of LDH is reduced to six “snapshots” here. Intermediate steps in catalysis such as those shown here are extremely short-lived and therefore dif cult to detect. Their existence wasdeduced indirectly froma large number of experimental findings—e.g., kinetic and binding measurements.
Manyamino acid residues playa role in the active center of LDH. They can mediate the binding of the substrate and coenzyme, or take part in one of the steps in the catalytic cycle directly. Only the side chains of three particularly important residues are shown here. The positively charged guanidinium group of arginine-171 binds the carboxylate group of the substrate by electrostatic interaction. The imidazole group of histidine-195 is involved in acid–base catalysis, and the side chain of arginine-109 is important for the stabilization of the transition state. In contrast to His-195, which changes its charge during catalysis, the two essential arginine residues are constantly protonated. In addition to these three residues, the peptide loop 98–111 mentioned on p.98 is also shown here schematically (red). Its function consists of closing the active center after binding of the substrate
and coenzyme, so that water molecules are largely excluded during the electron transfer.
We can now look at the partial reactions involved in LDH-catalyzed pyruvate reduction.
In the free enzyme, His195 is protonated (1). This form of the enzyme is therefore described as E H+. The coenzyme NADH is bound first (2), followed by pyruvate (3). It is important that the carbonyl group of the pyruvate in the enzyme and the active site in the nicotinamide ring ofthecoenzyme should have a fairly optimal position in relation to each other, and that this orientation should become fixed (proximity and orientation of the substrates). The 98–111 loop now closes over the active center. This produces a marked decrease in polarity, which makes it easier to achieve the transition state (4; water exclusion). In the transition state, a hydride ion, H– (see p.32), is transferred from the coenzyme to the carbonyl carbon (group transfer). The transient—and energetically unfavora- ble—negative charge on the oxygen that occurs here is stabilized by electrostatic interaction with Arg-109 (stabilization of the transition state). At the same time, a proton from His-195 is transferred to this oxygen atom (group transfer), giving rise to the enzymebound products lactate and NAD+ (5). After the loop opens, lactate dissociates from the enzyme, and the temporarily uncharged imidazole group in His-195 again binds a proton from the surrounding water (6). Finally, the oxidized coenzyme NAD+ is released, and the initial state (1) is restored. As the diagram shows, the proton thatappearsinthereaction equation (NADH + H+) is not bound together with NADH, but after release of the lacta- te—i.e., between steps (5) and (6) of the previous cycle.
Exactly the same steps occur during the oxidation of lactate to pyruvate, but in the opposite direction. As mentioned earlier, the direction which the reaction takes depends not on the enzyme, but on the equilibrium state—i.e., on the concentrations of all the reactants and the pH value (see p.18).
|
|
|
|
|
|
|
|
|
|
|
|
|
|
|
Enzymes |
101 |
A. Lactate dehydrogenase: catalytic cycle |
|
|
|
|
|
|
|
|
|
|||||||
|
|
|
|
E . H |
|
|
|
|
E . H |
. NADH |
|
|
||||
|
|
Arg-109 |
|
|
|
|
|
|
|
|
|
|
|
|
||
|
HN |
C |
NH2 |
|
|
|
|
HN |
NH2 |
|
|
NH2 |
H |
|
||
|
|
|
|
|
|
|
C |
|
|
|
|
|
|
|
|
|
|
H2N |
|
|
|
|
|
H2N |
|
|
O |
C |
|
|
N |
|
|
|
|
|
|
|
|
|
|
|
|
|
|
|||||
|
|
|
|
|
|
|
|
|
|
|
|
H |
|
|
|
|
|
|
|
H |
|
|
Loop |
|
|
|
|
H |
H |
|
|||
|
|
|
|
|
98-111 |
|
H |
|
|
H |
|
|||||
|
C |
N |
|
|
|
|
|
|
|
|
|
|
|
|||
|
|
|
|
|
C |
N |
|
|
|
|
|
|
||||
|
|
|
|
|
|
|
|
|
|
|
|
|||||
|
|
|
|
|
|
|
|
|
|
|
|
NADH |
|
|||
|
HC |
|
CH |
|
|
|
|
HC |
CH |
|
|
|
|
|
||
|
N |
|
|
|
|
|
|
|
|
|
|
|
||||
|
|
|
|
|
|
|
|
|
|
|
|
|
|
|||
|
|
|
|
|
|
|
N |
|
|
|
|
|
|
|
|
|
|
|
H |
|
|
|
|
|
|
|
|
|
|
|
|
|
|
|
|
|
|
|
|
|
H |
|
|
|
|
|
|
|
|
|
|
His-195 |
H2N |
NH2 |
|
|
|
|
|
|
|
|
|
||||
|
|
|
H N |
|
NH |
2 |
|
|
||||||||
|
|
|
|
C |
|
|
Arg-171 |
|
2 |
|
C |
|
|
|
||
|
|
|
|
|
|
|
|
|
|
|
|
|
|
|||
|
|
|
|
HN |
|
|
|
|
|
HN |
|
|
|
|
|
|
|
|
|
|
|
|
|
|
|
|
|
|
|
|
|
||
|
1. Free enzyme |
|
|
|
2. NADH bound |
|
|
|
|
|
|
|||||
|
|
|
|
|
|
|
|
|
|
|
|
NH2 |
H |
|
||
|
HN |
C |
NH2 |
|
NH2 |
H |
HN |
NH2 |
|
O |
C |
|
|
N |
|
|
|
|
|
|
C |
|
C |
|
|
|
|
|
|
||||
|
H2N |
|
O |
N |
H2N |
|
|
|
H |
|
|
|
Pyruvat |
|||
|
|
|
|
|
|
|
|
|
H |
|||||||
|
|
|
|
|
|
|
|
|
|
|
|
H |
||||
|
|
|
|
|
|
|
|
|
|
|
|
H |
||||
NAD |
|
|
|
|
H |
H |
|
|
H3C |
|
|
|
||||
|
|
|
|
|
|
|
|
|
|
|||||||
|
|
H |
|
|
|
H |
|
H |
O |
C |
|
|
|
|
. |
|
. |
C |
N |
|
|
|
NAD |
C |
N |
|
|
Pyruvat |
NADH |
||||
H |
|
|
|
|
|
|||||||||||
|
|
|
|
|
|
|
HC |
|
O |
|
O |
|
|
|
||
. |
HC |
|
CH |
|
|
|
|
CH |
|
|
|
|
||||
E |
N |
|
|
|
|
|
|
|
|
. |
||||||
|
|
|
|
|
|
|
N |
|
|
|
|
|
|
|
H |
|
|
|
H |
H2N |
NH2 |
|
H |
|
|
|
|
|
|
|
|||
|
|
|
H |
N |
|
NH |
|
|
. |
|||||||
|
|
|
|
|
2 |
|
E |
|||||||||
|
|
|
|
C |
|
|
|
|
2 |
C |
|
|
|
|
||
|
|
|
|
|
|
|
|
|
|
|
|
|
|
|
||
|
|
|
|
HN |
|
|
|
|
|
|
HN |
|
|
|
|
|
|
6. NAD |
bound |
|
|
|
3. Pyruvate bound |
|
|
|
|
|
|||||
|
|
|
|
|
NH2 |
H |
|
|
|
|
NH2 |
H |
|
|||
|
HN |
C |
NH2 |
C |
|
N |
HN |
NH2 |
|
|
C |
N |
|
|||
|
|
|
O |
|
|
C |
|
|
O |
|
|
|
||||
|
H N |
|
|
|
|
|
H2N |
|
|
|
H |
|
|
|
|
|
|
|
2 |
|
|
H |
|
H |
|
|
H3C |
H |
|
|
H |
|
|
|
|
|
|
|
|
|
|
|
|
|
||||||
|
|
|
|
|
|
|
|
|
|
|
|
|
|
|
|
|
|
|
|
|
|
|
|
H |
|
O |
C |
|
|
|
H |
|
|
|
|
|
|
H3C |
|
|
C |
H |
|
|
|
|
|
|
|
|
|
|
|
|
|
|
N |
|
|
O |
|
|
|
|
|||
|
|
|
|
O |
C |
H |
|
HC |
O |
|
|
|
|
|
||
|
|
|
|
|
CH |
|
|
|
|
|
|
|
||||
|
C |
N |
H O |
|
Lactate |
N |
|
|
|
|
|
|
|
|
||
|
HC |
N |
CH |
|
O |
|
H |
H2N |
C |
NH2 |
|
|
||||
|
|
|
|
|
|
|
Proton |
|
|
|
|
Hydride |
|
|||
|
|
|
|
|
|
|
|
|
|
|
|
|
||||
|
|
H |
|
|
|
|
|
HN |
|
|
|
|
||||
|
|
|
H2N |
|
NH2 |
transfer |
|
|
|
transfer |
|
|||||
|
|
|
|
|
|
|
|
|
||||||||
|
|
|
|
C |
|
|
|
|
|
|
|
|
|
|||
|
|
|
|
|
|
|
|
|
|
|
|
|
|
|
|
|
|
|
|
|
HN |
|
|
|
|
|
|
|
|
|
|
|
|
|
5. Lactate bound |
|
|
|
4. Redox reaction |
|
|
|
|
|
||||||
|
|
|
E . NAD . Lactate |
|
Transition state |
|
|
|||||||||
102 Metabolism
Enzymatic analysis
Enzymes play an important role in biochemical analysis. In biological material—e.g., in body fluids—even tiny quantities of an enzyme can be detected by measuring its catalytic activity. However, enzymes are also used as reagents to determine the concentrations of metabolites—e.g., the blood glucose level (C). Most enzymatic analysis procedures use the method of spectrophotometry (A).
A. Principle of spectrophotometry
absorption is recorded at a constant wavelength of 340 nm. The uncatalyzed LDH reaction is very slow. It is only after addition of the enzyme that measurable quantities of NADH are formed and absorption increases. Since according to the Beer–Lambert law the rate of the increase in absorption ∆A/∆t is proportional to the reaction rate ∆c/∆t. The absorption coef cient ε at 340 nm or comparison with a standard solution can be used to calculate LDH activity.
C. Enzymatic determination of glucose
Many substances absorb light in the visible or |
Most biomolecules do not show any absorp- |
|
ultraviolet region of the spectrum. This prop- |
tion in the visible or ultraviolet spectrum. In |
|
erty can be used to determine the concentra- |
addition, they are usually present in the form |
|
tion of such a substance. The extent of light |
of mixtures with other—similar—compounds |
|
absorption depends on the type and concen- |
that would also react to a chemical test pro- |
|
tration of the substance and on the wave- |
cedure. These two problems can be avoided |
|
length of the light used. Monochromatic |
by using an appropriate enzyme to produce a |
|
light—i.e., light with a defined wavelength |
colored dye selectively from the metabolite |
|
isolated fromwhite light using a monochrom- |
that is being analyzed. The absorption of the |
|
ator—is therefore used. Monochromatic light |
dye can then be measured. |
|
with an intensity of I0 is passed through a |
A procedure (1) that is often used to mea- |
|
rectangular vessel made of glass or quartz (a |
sure glucose when monitoring blood glucose |
|
cuvet), which contains a solution of the ab- |
levels (see p. 160) involves two successive re- |
|
sorbing substance. The absorption A of the |
actions. The glucose-specific enzyme glucose |
|
solution (often also referred to as its extinc- |
oxidase (obtained from fungi) first produces |
|
tion) is defined as the negative decadic loga- |
||
hydrogenperoxide,H2O2, whichinthesecond |
||
rithm of the quotient I/I0. The Beer–Lambert |
step—catalyzed by a peroxidase—oxidizes a |
|
law states that A is proportional to the con- |
colorless precursor into a green dye (2). |
|
centration c of the absorbing substance and |
When all of the glucose in the sample has |
|
the thickness d of the solution it passes |
been used up, the amount of dye formed— |
|
through. As mentioned earlier, the absorption |
which can be measured on the basis of its |
|
coef•cient ε depends on the type of substance |
light absorption—is equivalent to the quantity |
|
and the wavelength. |
of glucose originally present. |
|
|
||
B. Measurement of lactate dehydrogenase |
|
|
activity |
|
|
Measurement of lactate dehydrogenase (LDH) |
|
|
activity takes advantage of the fact that while |
|
|
the reduced coenzyme NADH + H+ absorbs |
|
|
light at 340 nm, oxidized NAD+ does not. Ab- |
|
|
sorption spectra (i.e., plots of A against the |
|
|
wavelength) for the substrates and the coen- |
|
|
zymes of the LDH reaction are shown in Fig.1. |
|
|
Differences in absorption behavior between |
|
|
NAD+ and NADH between 300 and 400 nm |
|
|
result from changes in the nicotinamide ring |
|
|
during oxidation or reduction (see p. 32). To |
|
|
measure the activity, a solution containing |
|
|
lactate and NAD+ is placed in a cuvet, and |
|

|
|
|
|
|
|
Enzymes |
103 |
A. Principle of spectrophotometry |
|
|
|
|
|
||
White light |
|
Monochroma- |
Monochroma- |
|
|
||
|
tic light, |
|
tic light, |
|
|
|
|
|
|
intensity |
0 |
intensity |
|
|
|
|
|
|
|
d |
|
|
|
|
|
|
|
|
|
Absorption |
|
Light source |
Monochromator |
|
|
Detector |
Instrument |
|
|
|
|
Light |
|
Sample solution, |
|
|
|
|
|
absorption |
concentration c |
|
|
||
|
Absorption |
A = –log |
I |
= ε .c.d |
Beer Lambert |
|
|
|
|
|
I0 |
|
law |
|
|
B. Assay of lactate dehydrogenase activity |
|
|
|
|
|
|
|
|
|
|||||
|
2.0 |
|
|
|
|
|
∆A |
= ∆c |
∆A |
= |
∆c |
= v |
; |
v ≈ Activity |
|
|
|
Lactate |
|
|
ε |
; |
∆t · ε |
|
∆t |
|
|
||
|
|
|
|
|
|
|
|
|
|
|
|
|
||
|
|
|
Pyruvate |
0.1 mM |
|
|
|
|
|
|
|
|
|
|
|
1.5 |
|
NAD |
|
each |
|
|
|
|
|
|
|
|
|
Absorption |
|
NADH |
|
|
|
|
|
|
|
|
|
|
|
|
1.0 |
|
|
|
|
(340 nm) |
|
|
Addition |
3 nkat |
|
2 nkat |
|||
|
|
NADH |
|
|
|
of LDH |
|
|
|
|||||
|
|
|
|
|
|
|
|
|
|
|
||||
|
0.5 |
|
|
|
|
Absorption |
Lactate; NAD |
|
|
|
|
|
1 nkat |
|
|
|
|
|
Lactate |
|
|
|
|
|
|
|
|
||
|
|
|
|
|
|
|
|
|
|
∆A |
|
|
||
|
|
|
NAD |
|
Pyruvate |
|
|
|
|
|
|
|
||
|
0 |
|
|
|
|
0 |
|
|
|
|
|
|
|
|
|
|
|
|
|
|
|
|
∆t |
|
|
|
|
|
|
1. |
240 |
280 |
320 |
360 |
400 |
|
2. |
|
|
|
|
|
Time |
|
|
|
Wavelength (nm) |
|
|
|
|
|
|
|
|
|
|
||
C. Enzymatic determination of glucose |
|
|
|
|
||
|
O2 |
|
|
|
Glucose-containing |
|
|
|
|
|
|
||
|
|
|
|
|
sample solution |
|
Glucose |
Glucose |
Glucono- |
|
|
|
|
oxidase |
|
|
|
|
||
lactone |
|
|
|
|
||
|
1.1.3.4 [FAD] |
|
|
|
|
|
|
|
nm) |
|
|
|
|
|
|
|
|
|
|
|
|
|
|
(440 |
Enzymes |
|
|
|
|
|
|
|
|
|
2 H2O |
|
H2O2 |
Absorption |
Colorless |
|
|
|
|
|
precursor |
|
∆A |
|
|
|
|
|
|
||
|
|
|
|
[Green dye] |
∆A |
|
|
|
|
|
— |
||
|
Peroxidase |
|
|
|
|
∞ = ε |
Green |
Colorless |
|
|
[Green dye]∞ = [Glucose]0 |
||
1.11.1.7 |
|
|
||||
dye |
precursor |
|
|
|
|
|
[Heme] |
|
|
|
|
||
|
|
|
|
|
|
|
|
|
|
|
0 |
10 |
20 |
1. Reaction |
|
|
2. Procedure |
Time (min) |
||
|
|
|
|
|||

104 Metabolism
Coenzymes 1
A. Coenzymes: definitions
In many enzyme-catalyzed reactions, electrons or groups of atoms are transferred from one substrate to another. This type of reaction always also involves additional molecules, which temporarily accept the group being transferred. Helper molecules of this type are called coenzymes. As they are not catalytically active themselves, the less frequently used term “cosubstrate” would be more appropriate. In contrast to substrates for which a given enzyme is usually specific (see p. 88), coenzymes cooperate with many enzymes of varying substrate specificity. We have rather arbitrarily divided the coenzymes here into group-transferring and redox coenzymes. Strictly speaking, redox coenzymes also transfer groups—namely, reducing equivalents (see p. 32).
Depending on the type of interaction with the enzyme, a distinction is made between soluble coenzymes and prosthetic groups.
Soluble coenzymes (1) are bound like substrates during a reaction, undergo a chemical change, and are then released again. The original form of the coenzyme is regenerated by a second, independent reaction. Prosthetic groups (2), on the other hand, are coenzymes that are tightly bound to the enzyme and remain associated with it during the reaction. The part of the substrate bound by the coenzyme is later transferred to another substrate or coenzyme of the same enzyme (not shown in Fig. 2).
B. Redox coenzymes 1
All oxidoreductases (see p. 88) require coenzymes. The most important of these redox coenzymes are shown here. They can act in soluble form (S) or prosthetically (P). Their normal potentials E0 are shown in addition to the type of reducing equivalent that they transfer (see p. 18).
The pyridine nucleotides NAD+ and NADP+ (1) are widely distributed as coenzymes of dehydrogenases. They transport hydride ions (2e– and 1 H+; see p. 32) and always act in soluble form. NAD+ transfers reducing equivalents from catabolic pathways to the respiratory chain and thus contributes to energy
metabolism. In contrast, reduced NADP+ is the most important reductant involved in biosynthesis (see p. 112).
The flavin coenzymes FMN and FAD (2, 3) contain flavin (isoalloxazine) as a redox-active group. This is a three-membered, N-contain- ing ring system that can accept a maximum of two electrons and two protons during reduction. FMN carries the phosphorylated sugar alcohol ribitol at the flavin ring. FAD arises from FMN through bonding with AMP. The two coenzymes are functionally similar. They are found in dehydrogenases, oxidases, and monooxygenases. In contrast to the pyridine nucleotides, flavin reactions give rise to radical intermediates (see p. 32). To prevent damage to cell components, the flavins always remain bound as prosthetic groups in the enzyme protein.
The role of ubiquinone (coenzyme Q, 4) in transferring reducing equivalents in the respiratory chain is discussed on p. 140. During reduction, the quinone is converted into the hydroquinone (ubiquinol). The isoprenoid side chain of ubiquinone can have various lengths. It holds the molecule in the membrane, where it is freely mobile. Similar coenzymes are also found in photosynthesis (plastoquinone; see p. 132). Vitamins E and K (see p. 52) also belong to the quinone/hydroquinone systems.
L-Ascorbic acid (vitamin C, 5) is a powerful reducing agent. As an antioxidant, it provides nonspecific protection against oxidative damage (see p. 284), but it is also an essential cofactor for various monooxygenases and dioxygenases. Ascorbic acid is involved in the hydroxylation of proline and lysine residues during the biosynthesis of collagen (see p. 344), in the synthesis of catecholamines (see p. 352) and bile acids (see p. 314), as well as in the breakdown of tyrosine (see p. 415). The reduced form of the coenzyme is a relatively strong acid and forms salts, the ascorbates. The oxidized form is known as dehydroascorbic acid. The stimulation of the immune system caused by ascorbic acid has not yet been fully explained.
Enzymes 105
A. Coenzymes: definitions
1. |
Substrate 1 |
Coenzyme |
Group |
Substrate 2 |
Coenzyme |
|
(form 1) |
transfer |
|
(form 2) |
|
|
|
|
a |
b |
c |
|
d |
Prosthetic |
|
|
|
Prosthetic |
group (form1) |
Substrate 1 |
|
Substrate 2 |
group (form 2) |
2.

B. Redox coenzymes
|
Coenzyme |
|
|
|
|
Oxidized form |
|
Reduced form |
|
|
|
|
|
|
|
|
Type |
Trans- |
Eol |
||||||||||||||||||||
|
|
|
|
|
|
|
|
|
|
|
|
|
|
|
|
|
|
|
|
|
|
|
|
|
|
|
|
|
|
|
|
|
|
|
|
|
|
ferred |
(V) |
1. NAD(P) |
|
|
|
|
|
|
|
|
|
|
|
|
|
H |
|
H |
O |
|
|
|
|
|
|
H |
H |
L |
H |
–0.32 |
|||||||||||
|
|
|
|
|
|
|
|
|
|
|
|
|
|
|
|
|
|
|
|
|
|
|
|
|
|
|
|
|
|
|
|
|
|
|
|||||
|
|
|
|
|
|
|
|
|
|
|
|
|
|
|
|
|
|
|
|
|
|
|
H |
|
|
|
|
C |
|
|
|
|
|
|
|
N |
|
|
|
|
|
|
|
|
|
|
|
|
|
|
|
|
|
|
|
|
|
|
|
|
|
|
|
|
|
|
|
NH2 |
|
|
|
|
N |
C |
C |
|
|
|
|
|
N |
|
A |
|
N |
|
A |
|
|
|
|
|
|
|
|
|
|
|
|
|
|
|
|
O |
|
O |
|
N |
|
|
|
||||||||
|
|
|
|
|
|
|
|
|
|
|
|
|
|
|
|
|
|
|
|
|
|
|
|
|
|
|
|
|
|
|
H |
C |
|
|
|
|
|
||
|
|
|
|
|
|
|
|
|
|
|
|
|
|
|
|
H |
|
|
|
O |
|
|
H |
N |
|
|
H |
|
|
C |
C |
|
|
|
|||||
|
|
|
|
|
|
|
|
|
|
|
|
|
|
|
|
|
|
|
|
|
|
|
|
|
|
|
|
||||||||||||
|
|
|
|
|
|
|
|
|
|
|
|
|
|
|
|
|
|
|
|
|
|
|
|
|
|
|
|
N |
|
|
|
||||||||
|
|
|
|
|
|
|
|
|
|
|
|
|
|
|
|
|
|
|
|
|
|
|
|
|
|
|
|
|
|
|
|
|
|
|
|||||
|
|
|
|
|
|
|
|
|
|
|
|
|
|
|
H |
|
|
|
|
C |
|
|
|
|
|
|
|
CH2O |
P |
O |
P |
OCH2 |
|
N |
|
|
|
||
|
|
|
|
|
|
|
|
|
|
|
|
|
|
|
|
|
|
|
|
|
|
|
|
|
O |
|
O |
|
O |
O |
|
|
|
|
|
||||
|
N |
|
A |
N |
A |
|
|
|
|
|
NH2 |
|
|
|
|
H H |
|
|
H H |
|
|
|
|
|
|||||||||||||||
|
|
|
|
|
|
P |
|
|
|
|
|
P |
|
|
|
|
|
|
|
|
|
|
|
|
|
|
|
|
|
|
|||||||||
|
|
|
|
|
|
|
|
|
|
|
H |
N |
|
|
|
H |
|
|
|
H |
|
|
H |
|
|
|
|
H |
H |
|
|
|
|
|
|||||
|
|
ox. |
|
|
red. |
|
|
|
|
|
|
|
|
|
|
|
|
|
|
|
|
|
|||||||||||||||||
|
|
|
|
|
|
|
|
|
|
|
|
|
|
|
|
|
|
|
|
|
|
|
|
|
|
||||||||||||||
|
|
|
|
|
|
|
|
|
|
|
|
|
|
|
OH OH |
|
|
|
|
OH OH |
|
|
|
|
|
||||||||||||||
|
2. Flavin |
|
|
|
|
|
|
|
|
|
|
|
|
O |
|
|
|
|
|
|
|
|
H |
|
H |
|
O |
|
|
|
P |
2[H] |
–0.3 |
||||||
|
mononucleotide |
H3C |
|
N |
C |
|
|
|
|
|
|
H3C |
C |
|
N |
|
C |
H |
|
|
|
|
to |
||||||||||||||||
|
(FMN) |
|
|
|
|
|
|
|
|
NH |
|
|
|
|
|
C |
|
|
|
|
|
+0.2 |
|||||||||||||||||
|
|
|
|
|
|
|
|
|
|
|
|
|
|
|
|
|
|
|
|
C |
|
|
|
N |
|
|
|
|
|
||||||||||
|
|
|
|
|
|
|
|
|
|
|
|
|
|
|
H3C |
|
|
|
|
|
C |
|
|
|
|
|
|
C |
|
C |
|
|
C |
|
|
|
|
|
|
|
|
|
|
|
|
|
|
|
|
|
|
|
|
|
|
N |
N |
O |
|
|
|
|
|
H3C |
C |
|
N |
|
N |
O |
|
|
|
|
|
||||
|
|
|
|
|
|
|
|
|
|
|
|
|
|
|
|
|
|
|
|
|
|
|
|
|
|
|
|
|
H |
|
CH2 |
|
H |
|
|
|
|
|
|
|
|
F |
|
|
|
|
|
|
F |
|
|
|
|
|
|
|
|
|
|
|
|
|
|
|
|
|
|
|
H |
C |
OH |
|
|
|
|
|
|
|
|
|
|
|
|
|
|
|
|
|
|
|
|
|
|
|
|
|
|
|
|
|
|
|
|
|
|
|
|
|
|
|
|
|
|
|
|
|
|||
|
|
|
|
|
|
|
|
|
|
|
|
|
|
|
|
|
|
|
|
|
|
|
|
|
Ribitol (Rit) |
|
H |
C |
OH |
|
|
|
|
|
|
|
|||
|
|
ox. |
|
|
red. |
|
|
|
|
|
|
|
|
|
|
|
H |
C |
OH O |
|
|
|
|
|
|
||||||||||||||
|
|
|
|
|
|
|
|
|
|
|
|
|
|
|
|
|
|
|
|
|
|
|
|
|
|||||||||||||||
|
|
|
|
|
|
|
|
|
|
|
|
|
|
|
|
|
|
|
|
|
|
|
|
|
|
|
|
|
|
H2C |
O |
P O |
|
|
|
|
|
|
|
|
|
|
|
|
|
|
|
|
|
|
|
|
|
|
|
|
|
|
|
|
|
|
|
|
|
|
|
|
|
|
|
|
O |
|
|
|
|
|
|
|
3. Flavin |
|
|
|
|
|
|
|
|
|
|
|
|
|
|
|
|
H |
|
|
O |
|
|
|
|
|
|
H |
H |
P |
2[H] |
–0.3 |
|||||||
|
|
|
adenine |
|
|
|
|
|
|
|
|
|
|
H3C |
|
|
N |
|
|
C |
|
|
|
|
|
|
|
|
to |
||||||||||
|
|
|
dinucleotide |
|
|
|
|
|
|
|
|
|
|
|
|
|
|
|
|
|
N |
|
|
+0.2 |
|||||||||||||||
|
|
|
|
|
|
|
|
|
|
|
|
|
|
|
|
NH |
|
|
|
|
|
|
C |
|
|
||||||||||||||
|
|
|
(FAD) |
|
|
|
|
|
|
|
|
|
|
|
|
|
|
|
|
|
|
|
|
C |
|
|
|
|
|
N |
C |
|
|
|
|||||
|
|
|
|
|
|
|
|
|
|
|
|
|
|
|
|
H3C |
|
|
N |
|
|
O |
|
|
|
H |
N |
|
|
|
|||||||||
|
|
|
|
|
|
|
|
|
|
|
|
|
|
|
|
|
|
|
|
|
|
|
|
|
N |
|
|
|
C |
C |
N C |
|
|
|
|||||
|
|
F |
|
|
|
A |
|
F |
|
|
A |
|
|
|
|
|
O |
|
|
|
|
|
|
|
H |
|
O |
|
O |
|
N |
|
|
|
|||||
|
|
|
|
|
|
|
|
|
|
|
|
|
|
|
|
|
|
|
|
|
O |
P |
O |
P |
OCH2 |
|
|
|
|
|
|
||||||||
|
|
|
|
|
|
|
|
|
|
|
|
|
|
|
H3C |
|
N |
C |
|
|
Ribitol |
|
|
|
|
|
|
|
|
||||||||||
|
|
|
|
|
|
|
|
|
|
|
|
|
|
|
|
NH |
|
|
|
|
O |
|
O |
O |
|
|
|
|
|
||||||||||
|
|
ox. |
|
|
red. |
|
|
|
|
|
|
|
|
|
|
|
|
|
|
|
|
|
|
|
|
||||||||||||||
|
|
|
|
|
|
|
|
|
|
|
|
|
|
|
|
|
|
|
H |
H |
|
|
|
|
|
||||||||||||||
|
|
|
|
|
|
|
|
|
|
|
|
|
|
|
|
|
|
|
|
|
|
|
|
|
|||||||||||||||
|
|
|
|
|
|
|
|
|
|
C |
|
|
|
|
|
|
|
|
|
|
|
|
|
|
|
|
|||||||||||||
|
|
|
|
|
|
|
|
|
|
|
|
|
|
|
H3C |
|
|
|
|
|
|
|
|
|
|
|
|
|
|
|
|
H |
H |
|
|
|
|
|
|
|
|
|
|
|
|
|
|
|
|
|
|
|
|
|
|
N |
N |
O |
|
|
|
|
|
|
|
|
|
|
|
|
|
|
|
|
|||||
|
|
|
|
|
|
|
|
|
|
|
|
|
|
|
|
|
|
|
|
|
|
|
|
|
|
|
|
|
|
|
|
|
OH OH |
|
|
|
|
|
|
|
|
|
|
|
|
|
|
|
|
|
|
|
|
|
|
|
|
|
|
|
|
|
|
|
|
|
|||||||||||||
|
4. Ubiquinone |
|
|
O |
|
|
|
|
|
|
|
|
|
|
OH |
|
|
|
|
|
|
L |
2[H] |
–0 |
|||||||||||||||
|
|
|
(coenzym Q) |
H3CO |
|
|
|
|
CH3 |
|
|
|
|
|
|
H3CO |
|
|
CH3 |
|
|
|
|
|
to |
||||||||||||||
|
|
|
|
|
|
|
|
|
|
OH |
|
|
|
|
|
|
|
|
|
|
|
|
|
|
|
|
|
+0.2 |
|||||||||||
|
|
|
|
|
|
|
|
|
|
|
|
|
|
|
|
|
|
|
|
|
|
|
|
|
|
|
|
|
|
|
|
|
|
||||||
|
|
|
|
|
|
|
|
|
|
|
|
|
|
|
H3CO |
|
|
|
|
|
|
|
|
|
|
|
|
H3CO |
|
|
|
|
|
H |
|
|
|
|
|
|
|
|
|
|
|
|
|
|
|
|
|
|
|
|
|
|
O |
|
|
|
|
|
|
|
|
|
|
OH |
|
|
CH3 |
|
|
|
|
|
|||
|
|
|
|
|
|
|
|
|
|
OH |
|
|
|
|
|
|
|
|
|
|
|
|
|
|
|
|
|
|
|
6–10 |
|
|
|
|
|
||||
|
5. Ascorbic |
|
|
|
|
|
O |
|
|
|
O |
|
|
|
|
|
|
|
|
HO |
|
O |
|
|
|
|
L |
2[H] |
+0.1 |
||||||||||
|
|
|
acid |
|
|
|
|
|
|
|
|
|
|
|
|
|
|
|
|
|
|
|
|
|
|
|
|
|
|
|
|
|
|
|
|
||||
|
|
|
|
|
|
|
|
|
|
|
|
|
|
|
O |
|
|
|
|
O |
|
|
|
|
|
|
|
|
HO |
|
O |
|
|
|
|
|
|
|
|
|
|
|
|
|
|
|
|
|
|
|
|
|
|
|
|
|
|
|
|
|
|
|
|
|
|
|
|
|
|
|
|
|
|
|
|
|
|
||
|
|
|
|
|
|
|
|
|
|
|
|
|
|
|
HO |
C |
H |
|
|
|
|
|
|
|
|
HO |
C |
H |
|
|
|
|
|
|
|
||||
|
|
|
|
|
|
|
|
|
|
|
|
|
|
|
|
|
CH2OH |
|
|
|
|
|
|
|
|
|
|
CH2OH |
|
|
|
|
|
|
|||||
|
|
|
|
|
|
|
|
|
|
|
|
|
|
|
|
|
|
|
|
|
|
|
|
|
|
|
|
|
|
|
|
|
|
|
|
|
|
|
|

106 Metabolism
Coenzymes 2
A. Redox coenzymes 2
In lipoic acid (6), an intramolecular disulfide bond functions as a redox-active structure. As a result of reduction, it is converted into the corresponding dithiol. As a prosthetic group, lipoic acid is usually covalently bound to a lysine residue (R) of the enzyme, and it is then referred to as lipoamide. Lipoamide is mainly involved in oxidative decarboxylation of 2-oxo acids (see p. 134). The peptide coenzyme glutathione is a similar disulfide/ dithiol system (not shown; see p. 284).
Iron–sulfur clusters (7) occur as prosthetic groups in oxidoreductases, but they are also found in lyases—e.g., aconitase (see p. 136) and other enzymes. Iron–sulfur clusters consist of 2–4 iron ions that are coordinated with cysteine residues of the protein (–SR) and with anorganic sulfide ions (S). Structures of this type are only stable in the interior of proteins. Depending on the number of iron and sulfide ions, distinctions are made between [Fe2S2], [Fe3S4], and [Fe4S4] clusters. These structures are particularly numerous in the respiratory chain (see p. 140), and they are found in all complexes except complex IV.
Heme coenzymes (8) with redox functions exist in the respiratory chain (see p. 140), in photosynthesis (see p. 128), and in monooxygenases and peroxidases (see p. 24). Hemecontaining proteins with redox functions are also referred to as cytochromes. In cytochromes, in contrast to hemoglobin and myoglobin, the iron changes its valence (usually between +2 and +3). There are several classes of heme (a, b, and c), which have different types of substituent – R1 to – R 3. Hemoglobin, myoglobin, and the heme enzymes contain heme b. Two types of heme a are found in cytochrome c oxidase (see p. 132), while heme c mainly occurs in cytochrome c, where it is covalently bound with cysteine residues of the protein part via thioester bonds.
B. Group-transferring coenzymes 1
The nucleoside phosphates (1) are not only precursors for nucleic acid biosynthesis; many of them also have coenzyme functions. They serve for energy conservation, and as a result
of energetic coupling (see p. 124) also allow endergonic processes to proceed. Metabolites are often made more reactive (“activated”) as a result of the transfer of phosphate residues (phosphorylation). Bonding with nucleoside diphosphate residues (mainly UDP and CDP) provides activated precursors for polysaccharides and lipids (see p. 110). Endergonic formation of bonds by ligases (enzyme class
6)also depends on nucleoside triphosphates. Acyl residues are usually activated by
transfer to coenzyme A (2). In coenzyme A (see p. 12), pantetheine is linked to 3 -phos- pho-ADP by a phosphoric acid anhydride bond. Pantetheine consists of three components connected by amide bonds—pantoic acid, Ε-alanine, and cysteamine. The latter two components are biogenic amines formed by the decarboxylation of aspartate and cysteine, respectively. The compound formed from pantoic acid and β −alanine (pantothenic acid) has vitamin-like characteristics for humans (see p. 368). Reactions between the thiol group of the cysteamine residue and carboxylic acids give rise to thioesters, such as acetyl CoA. This reaction is strongly endergonic, and it is therefore coupled to exergonic processes. Thioesters represent the activated form of carboxylic acids, because acyl residues of this type have a high chemical potential and are easily transferred to other molecules. This property is often exploited in metabolism.
Thiamine diphosphate (TPP, 3), in cooperation with enzymes, is able to activate aldehydes or ketones as hydroxyalkyl groups and then to pass them on to other molecules. This type of transfer is important in the transketolase reaction, for example (see p. 152). Hydroxyalkyl residues also arise in the decarboxylation of oxo acids. In this case, they are released as aldehydes or transferred to lipoamide residues of 2-oxoacid dehydrogenases (see p. 134). The functional component of TPP is the sulfurand nitrogen-containing thiazole ring.

|
|
|
|
|
|
|
|
|
|
|
|
|
Enzymes |
107 |
A. Redox coenzymes 2 |
|
|
|
|
|
|
|
|
|
|
||||
Coenzyme |
Oxidized form |
|
|
Reduced form |
Type |
Trans- |
Eol |
|||||||
|
|
|
|
|
|
|
|
|
|
|
|
|
ferred |
|
6. Lipoamide |
|
S |
S |
|
|
H |
H |
|
|
P |
2[H] |
–0.29 |
||
|
|
|
|
|
|
|
|
|
|
|
||||
|
|
|
|
HC |
CH |
|
|
S |
S |
|
|
H |
|
|
S |
S |
HS SH |
|
C |
|
|
|
HC |
CH |
|
|
N |
|
|
|
H2 |
|
|
|
|
|
|
|||||||
|
|
|
|
|
|
|
C |
|
|
|
|
|
||
ox. |
|
red. |
|
|
|
|
|
|
H2 |
|
|
O |
|
|
|
|
|
|
|
|
|
|
|
|
|
|
|||
7. Iron– |
|
|
[Fe2 S2]n+ |
|
|
[Fe4 S4]m+ |
P |
1e |
–0.6 |
|||||
sulfur |
|
RS |
S |
SR |
|
|
RS |
S |
Fe |
|
|
to |
||
cluster |
|
|
|
Fe |
S |
|
|
+0.5 |
||||||
|
Fe |
Fe |
|
|
|
|
|
|
||||||
|
|
|
|
RS |
S |
SR |
|
|
RS |
Fe |
S |
|
|
|
|
|
|
|
|
|
S |
Fe |
|
|
|
||||
|
|
|
|
|
|
|
|
|
|
|
SR |
|
|
|
8. Heme |
|
R2 |
|
|
|
|
R2 |
|
|
P |
1e |
0 |
||
|
|
|
|
|
CH3 |
|
|
|
CH3 |
|
to |
|||
|
|
|
H3C |
A |
|
B |
R3 |
H3C |
A |
|
B |
R3 |
|
+0.5 |
|
|
|
|
|
|
|
||||||||
|
|
|
|
N |
N |
|
|
|
N |
|
N |
|
|
|
|
|
|
|
|
Fe3+ |
|
|
|
|
Fe 2+ |
|
|
|
|
3+ |
|
2+ |
|
N |
N |
|
|
|
N |
|
N |
|
|
|
|
R1 |
D |
|
C |
CH3 |
R1 |
D |
|
C |
CH3 |
|
|
||
|
|
|
|
|
|
|
||||||||
|
|
|
|
|
|
|
|
|
|
|
||||
ox. |
|
red. |
|
|
|
|
|
|
|
|
|
|
|
|
|
|
|
|
COO |
|
|
COO |
|
COO |
|
|
COO |
|
|
B. Group-transferring coenzymes 1
Coenzyme |
Free form |
|
|
|
|
|
|
|
|
|
|
|
|
|
|
|
|
|
|
Charged form |
|
|
|
Group(s) |
|
Important |
|||||||||||||||||||||||||||||||||
(symbol) |
|
|
|
|
|
|
|
|
|
|
|
|
|
|
|
|
|
|
|
|
|
|
|
|
|
|
|
|
|
|
|
|
|
|
|
|
|
|
|
|
|
|
|
|
|
|
|
|
|
|
|
|
|
trans- |
|
enzymes |
|||
|
|
|
|
|
|
|
|
|
|
|
|
|
|
|
|
|
|
|
|
|
|
|
|
|
|
|
|
|
|
|
|
|
|
|
|
|
|
|
|
|
|
|
|
|
|
|
|
|
|
|
|
|
|
|
|
|
ferred |
|
|
1. Nucleoside |
|
|
|
|
|
|
|
|
|
|
|
|
|
|
|
|
|
|
|
|
|
|
|
|
|
|
|
|
|
|
|
|
|
|
|
|
|
|
|
|
|
|
|
|
|
|
|
|
|
|
|
|
|
P |
|
Phospho- |
|||
1. phosphates |
|
|
|
|
|
|
|
|
|
|
|
|
|
|
|
|
|
|
|
|
|
|
|
|
|
|
|
|
|
|
|
|
|
|
|
|
|
|
|
|
|
|
Base |
|
|
|
|
|
transferases |
||||||||||
|
|
|
|
|
|
|
|
|
|
|
O |
|
|
|
O |
|
|
|
|
|
|
|
|
O |
|
|
|
|
|
|
|
|
|
|
|
|
|
|
|
|
|
|
|
B-Rib |
|
Nucleotidyl- |
|||||||||||||
|
|
|
|
|
|
|
|
|
|
|
|
|
|
|
|
|
|
|
|
|
|
|
|
|
|
|
|
|
|
|
|
|
|
|
|
|
|
|
|
CH2 |
|
|
|
|
|
|
|
|
|
|
|
transferases |
|||||||
|
|
|
|
|
|
|
|
|
O |
|
P |
|
O |
|
P |
|
|
|
O |
|
|
|
P |
|
|
|
O |
|
|
|
|
|
|
|
|
|
|
|
|
|
|
|
|||||||||||||||||
|
|
|
|
|
|
|
|
|
|
|
|
|
|
|
|
|
|
|
|
|
|
|
|
|
|
|
|
|
|
|
|
|
|
B-Rib- P |
|
(2.7.n.n) |
|||||||||||||||||||||||
|
|
|
|
|
|
|
|
|
|
|
|
|
|
|
|
|
|
|
|
|
|
|
|
|
|
|
|
|
|
|
|
|
|
|
|
|
|
|
|
|
|
|
|
O |
|
|
|
|
|
|
|
|
|
|
|
||||
N |
|
|
|
|
|
|
|
O |
|
|
|
O |
|
|
|
|
|
|
|
|
O |
|
|
|
|
|
|
|
|
|
|
|
|
|
|
|
|
|
|
|
|
|
|
|
|
|
Ligases |
||||||||||||
|
|
|
|
|
|
|
|
|
|
|
|
|
|
|
|
|
|
|
|
|
|
|
|
|
|
|
|
|
H |
|
|
|
|
|
|
|
|
|
|
|
|
||||||||||||||||||
|
|
|
|
|
|
|
|
|
|
|
|
|
|
|
|
|
|
|
|
|
|
|
|
|
|
|
|
|
|
|
|
|
|
|
|
|
|
|
|
|
|
|
|
|
|
|
B-Rib- P |
|
(6.n.n.n) |
||||||||||
|
|
P P P |
|
|
|
|
|
|
|
|
|
|
|
|
|
|
|
|
|
|
|
|
|
|
|
|
|
|
|
|
|
|
|
|
|
|
|
|
|
|
|
|
|
|
|
|
|
|
|
|
|
|
|
|
|
P |
|||
|
|
|
|
|
|
|
|
|
|
|
|
|
|
|
|
|
|
|
|
|
|
|
|
|
|
|
|
|
|
|
|
|
|
|
|
|
|
|
H |
|
|
|
|
|
H |
|
|
|
|
|
|
|
|
||||||
|
|
|
|
|
|
|
|
|
|
|
|
|
|
|
|
|
|
|
|
|
|
|
|
|
|
|
|
|
|
|
|
|
|
|
|
|
|
|
|
|
|
|
|
|
|
|
|
|
|
|
|
|
|
||||||
|
|
|
|
|
|
|
|
|
|
|
|
|
|
|
|
|
|
|
|
|
|
|
|
|
|
|
|
|
|
|
|
|
|
|
|
|
|
|
|
|
|
|
|
|
|
|
|
|
|
|
|
|
|
|
|
|
|
|
|
|
|
|
|
|
|
|
|
|
|
|
|
|
|
|
|
|
|
|
|
|
|
|
|
|
|
|
|
|
|
|
|
|
|
|
|
|
|
|
|
|
OH OH |
|
|
|
|
|
|
|
|
|
|
||||||||
|
|
|
|
|
|
|
|
|
|
|
|
|
|
|
|
|
|
|
|
|
|
|
|
|
|
|
|
|
|
|
|
|
|
|
|
|
|
|
|
|
|
|
|
|
|
|
|
|
|
|
|
|
|
|
|
|
|
|
|
2. Coenzyme A |
|
|
|
|
|
|
|
|
|
|
|
|
|
|
|
|
|
|
|
|
|
|
|
|
|
|
H |
H |
|
|
CH3 |
O |
|
|
|
Acyl |
|
Acyltrans- |
|||||||||||||||||||||
|
|
|
|
|
|
|
|
|
|
|
|
|
|
|
|
|
|
|
|
|
|
|
|
|
|
|
|
|
|
|
|
|
|
|
|
|
|
|
|
|
|
|
|
|
|
|
|
|
|
|
|
|
|
||||||
|
|
|
|
|
|
|
|
|
|
|
|
|
|
|
|
|
|
|
|
|
|
|
CH2 |
|
|
N |
|
C |
|
|
C |
|
C |
|
CH2 |
|
O |
|
P |
|
|
O |
|
|
residues |
|
ferases |
||||||||||||
|
|
|
|
|
|
|
|
|
|
|
|
|
|
|
|
|
|
|
|
|
|
|
|
|
|
|
|
|
|
|
|
|
|
|
|
||||||||||||||||||||||||
|
|
|
|
|
|
|
|
|
|
|
|
|
|
|
|
|
|
|
|
|
|
|
|
|
|
|
|
|
|
|
|
|
|
|
|
|
|
|
|
||||||||||||||||||||
|
|
|
|
|
|
|
|
|
|
|
|
|
|
|
|
|
|
|
|
|
|
|
|
|
|
|
|
|
|
|
|
|
|
|
|
|
|
|
|
|
|
|
|
|
|
|
|
|
|
|
|
|
(2.3.n.n) |
||||||
|
|
|
|
|
|
|
|
|
|
|
|
|
|
|
|
|
|
|
|
|
|
|
CH2 |
|
|
|
|
O |
OH CH3 |
O |
|
|
NH2 |
|
|
||||||||||||||||||||||||
|
|
|
|
|
|
|
|
|
|
|
|
|
|
|
|
|
|
|
|
|
|
|
|
|
|
|
|
|
|
|
|
||||||||||||||||||||||||||||
|
|
|
|
|
|
C O |
|
|
|
|
|
|
|
|
C |
|
|
O |
|
|
|
|
|
|
|
|
|
|
|
|
|
|
|
|
|
|
O |
|
P |
|
|
O |
N |
N |
|
|
CoA trans- |
||||||||||||
|
|
|
|
|
|
|
|
|
|
|
|
|
|
|
|
|
|
|
|
|
|
|
|
|
|
|
|
|
|
|
|
|
|
|
|
|
|
|
|
|
|
|
|
|
|
|
|||||||||||||
|
|
|
|
|
|
|
|
|
|
|
|
|
|
|
|
|
|
|
|
|
|
|
|
|
|
|
|
|
|
|
|
|
|
|
|
|
|
|
|
|
|
|
|
|
|
|
|||||||||||||
|
|
|
|
|
|
|
|
|
|
|
|
|
|
|
|
|
|
|
|
|
|
|
|
|
|
|
|
|
|
|
|
|
|
|
|
|
|
|
|
||||||||||||||||||||
|
|
|
|
|
|
|
|
|
|
|
|
|
|
|
|
|
|
|
|
|
|
|
|
|
|
|
|
|
|
|
|
|
|
|
|
|
|
|
|
|
|
|
|
|
|
|
|
|
|
|
|
|
|
|
|
|
|
||
|
|
|
|
H |
|
|
|
|
|
|
|
|
|
|
|
|
H |
|
|
N |
|
|
|
|
|
|
|
|
|
|
|
|
|
|
|
|
|
|
|
|
|
|
|
|
|
O |
HC |
|
|
|
|||||||||
|
|
|
|
|
N |
|
|
|
|
|
|
|
|
|
|
|
|
|
|
|
|
|
|
|
|
|
|
|
|
|
|
|
|
|
|
|
|
|
|
|
|||||||||||||||||||
|
|
|
|
|
|
|
|
|
|
|
|
|
|
|
|
|
|
|
|
|
|
|
|
|
|
|
|
|
|
|
|
|
|
|
|
|
|
|
|
|
|
|
|
|
|
|
|
|
|
|
ferases |
||||||||
|
|
|
|
|
|
|
|
|
|
|
|
|
|
|
CH2 |
|
|
|
|
|
|
|
|
|
|
|
|
|
|
|
|
|
|
|
|
CH2 |
N |
N |
|
|
|||||||||||||||||||
|
|
|
S |
|
|
|
|
|
|
|
|
|
|
|
|
|
|
|
|
|
|
|
|
|
|
|
|
|
|
|
|
|
|
|
|
|
|
|
|
|
|
|
|
|
|
|
|
|
|
|
|
|
|
O |
|
|
|
|
(2.8.3.n) |
|
|
|
|
|
|
CH2 |
|
|
|
|
|
|
|
|
CH2 |
|
|
|
|
|
|
|
|
|
|
|
|
|
|
|
|
|
|
|
|
|
|
H |
H |
|
|
|
|
||||||||||||||||
|
|
|
|
|
|
|
|
|
|
|
|
|
|
|
|
|
|
|
|
|
|
|
|
|
|
|
|
|
|
|
|
|
|
|
|
|
|
||||||||||||||||||||||
|
A |
|
|
|
|
|
|
|
|
|
|
|
|
|
|
|
|
|
|
|
|
|
|
|
|
|
|
|
|
|
|
|
|
|
|
|
|
|
|
|
|
|
|
|
|
|
|
|
|||||||||||
|
|
|
|
|
|
|
|
|
|
|
|
S |
|
|
|
|
|
|
|
|
|
|
|
|
|
|
|
|
|
|
|
|
|
|
|
|
|
|
|
|
|
|
|||||||||||||||||
|
|
|
|
|
|
|
CH2 |
|
|
|
|
|
|
|
|
|
|
|
|
|
|
|
|
|
|
|
|
|
|
|
|
|
|
|
|
|
|
|
|
|
H |
|
H |
|
|
|
|
||||||||||||
|
|
|
|
|
|
|
|
|
|
|
|
|
|
|
|
|
|
|
|
|
|
|
|
|
|
|
|
|
|
|
|
|
|
|
|
|
|
|
|
|
|
|
|
|
|
|
|
|
|||||||||||
|
|
|
|
|
|
|
|
|
|
|
|
|
|
|
C |
|
|
O |
|
|
|
|
|
|
|
|
|
|
|
|
|
|
|
|
|
|
|
|
|
|
O |
OH |
|
|
|
|
|||||||||||||
|
|
|
|
|
|
|
|
|
|
|
|
|
|
|
|
|
|
|
|
|
|
|
|
|
|
|
|
|
|
|
|
|
|
|
|
|
|
|
|
|
|
|
|||||||||||||||||
|
|
|
|
|
|
|
|
|
|
|
|
|
|
|
|
|
|
|
|
|
|
|
|
|
|
|
|
|
|
|
|
|
|
|
|
|
|
|
|
|
|
|
|||||||||||||||||
|
|
|
|
|
|
|
|
|
|
|
|
|
|
|
|
|
|
|
|
|
|
|
|
|
|
|
|
|
|
|
|
|
|
|
|
|
|
|
|
|
|
|
|
|
|
|
|
|
|
|
|
|
|
|
|
||||
|
|
|
|
|
|
SH |
|
|
|
|
|
|
|
|
CH3 |
|
|
|
|
|
|
|
|
|
|
|
|
|
|
|
|
|
|
O |
|
|
P |
O |
|
|
|
|
|
||||||||||||||||
|
|
|
|
|
|
|
|
|
|
|
|
|
|
|
|
|
|
|
|
|
|
|
|
|
|
|
|
|
|
|
|
|
|
|
|
|
|
|
|
|
|
|
|
|
|
|
|
|
|
|
|
O |
|
|
|
|
|
|
|
|
|
|
|
|
|
|
|
|
|
|
|
|
|
|
|
|
|
|
|
|
|
|
|
|
|
|
|
|
|
|
|
|
|
|
|
|
|
|
|
|
|
|
|
|
|
|
|
|
|
|
|
|
|
|
|
|
|
|
|
3. Thiamine |
|
|
|
|
|
|
|
|
|
|
|
|
|
|
|
|
|
|
|
|
|
|
|
|
|
|
|
|
|
|
|
|
|
|
|
|
|
|
|
R |
|
|
|
|
|
|
|
Hydroxy- |
|
Decarboxy- |
|||||||||
3. diphosphate |
|
|
H |
|
|
|
|
|
|
|
|
|
|
|
|
|
|
|
|
|
|
|
|
|
|
|
|
|
|
|
|
|
|
|
|
|
|
|
|
|
alkyl |
|
lases (4.1.1.n) |
||||||||||||||||
|
|
|
|
|
|
|
|
|
|
|
|
|
|
|
|
|
|
|
|
|
|
|
|
|
|
|
|
|
|
|
|
|
|
|
|
|
|
|
|
|
|
|
|
|
|
|
|||||||||||||
|
|
|
|
|
|
|
|
|
|
|
|
|
H3C |
N |
|
|
|
|
|
NH2 |
H |
|
|
C OH |
|
|
|
|
|
|
|
residues |
|
Oxoacid de- |
|||||||||||||||||||||||||
|
|
|
|
N |
|
|
|
S |
|
|
|
|
|
|
|
|
|
|
|
|
|
|
|
|
|
|
|
|
|
|
|
|
|
|
|
|
|
|
|
|
|
|
|
|
|
|
|
|
|
|
|
|
|
|
hydrogenases |
||||
|
|
TPP |
|
|
|
|
|
|
|
|
|
|
|
|
N |
|
|
|
|
|
|
|
|
|
|
|
CH2 |
|
|
N |
|
|
|
|
S |
|
|
|
|
|
|
|
|
|
(1.2.4. n) |
||||||||||||||
|
|
H3C |
|
|
|
CH2 |
|
|
|
|
|
|
|
|
|
|
|
|
|
|
|
|
|
|
|
|
|
|
|
|
|
|
|
|
|
|
|
|
|
|
|
|
|
|
|
|
|
|
|
|
|
|
Transketolase |
||||||
|
|
|
|
|
|
|
|
|
|
|
|
|
|
|
|
|
|
|
|
|
|
|
|
|
|
|
|
|
H3C |
|
|
|
|
|
CH2 |
CH2O |
P |
P |
|
|
(2.2.1.1) |
||||||||||||||||||
|
|
|
|
|
|
|
|
|
|
|
|
|
|
|
|
|
|
|
|
|
|
|
|
|
|
|
|
|
|
|
|
|
|
|
|
|
|
|
|
|
|
|
|||||||||||||||||
|
|
|
|
|
|
|
|
|
|
|
|
|
|
|
|
|
|
|
|
|
|
|
|
|
|
|
|
|
|
|
|
|
|
|
|
|
|
|
|
|
|
|
|
|
|
|
|
|
|
|
|
|
|
|
|
|
|
|
|

108 Metabolism
Coenzymes 3
A. Group-transferring coenzymes 2
Pyridoxal phosphate (4) is the most important coenzyme in amino acid metabolism. Its role in transamination reactions is discussed in detail on p. 178. Pyridoxal phosphate is also involved in other reactions involving amino acids, such as decarboxylations and dehydrations. The aldehyde form of pyridoxal phosphate shown here (left) is not generally found in free form. In the absence of substrates, the aldehyde group is covalently bound to the ε- amino group of a lysine residue as aldimine
(“Schiff’s base”). Pyridoxamine phosphate
(right) is an intermediate of transamination reactions. It reverts to the aldehyde form by reacting with 2-oxoacids (see p. 178).
Biotin (5) is the coenzyme of the carboxylases. Like pyridoxal phosphate, it has an amide-type bond via the carboxyl group with a lysine residue of the carboxylase. This bond is catalyzed by a specific enzyme. Using ATP, biotin reacts with hydrogen carbonate (HCO3–) to form N-carboxybiotin . From this activated form, carbon dioxide (CO2) is then transferred to other molecules, into which a carboxyl group is introduced in this way. Examples of biotindependent reactions of this type include the formation of oxaloacetic acid from pyruvate (see p. 154) and the synthesis of malonyl-CoA from acetyl-CoA (see p. 162).
Tetrahydrofolate (THF, 6) is a coenzyme that can transfer C1 residues in different oxidation states. THF arises from the vitamin folic acid (see p. 366) by double hydrogenation of the heterocyclic pterin ring. The C1 units being transferred are bound to N-5, N-10, or both nitrogen atoms. The most important derivatives are:
a)N5-formyl-THF and N10-formyl-THF, in which the formyl residue has the oxidation state of a carboxylic acid;
b)N5-methylene-THF, with a C1 residue in the oxidation state of an aldehyde; and
c)N5-methyl-THF, in which the methyl group has the oxidation state of an alcohol.
C1 units transferred by THF play a role in the synthesis of methionine (see p. 412), purine nucleotides (see p. 188), and dTMP (see p. 190), for example. Due to the central role of
THF derivatives in the biosynthesis of DNA precursors, the enzymes involved in THF metabolism are primary targets for cytostatic drugs (see p. 402).
The cobalamins (7) are the chemically most complex form of coenzyme. They also represent the only natural substances that contain the transition metal cobalt (Co) as an essential component. Higher organisms are unable to synthesize cobalamins themselves, and are therefore dependent on a supply of vitamin B12 synthesized by bacteria (see p. 368).
The central component of the cobalamins is the corrin ring, a member of the tetrapyrroles, at the center of which the cobalt ion is located. The end of one of the side chains of the ring carries a nucleotide with the unusual base dimethylbenzimidazole. The ligands for the metal ion are the four N atoms of the pyrrole ring, a nitrogen from dimethylbenzimidazole, and a group X, which is organometallically bound—i.e., mainly covalently.
In methylcobalamin, X is a methyl group. This compound functions as a coenzyme for several methyltransferases, and among other things is involved in the synthesis of methionine from homocysteine (see p. 418). However, in human metabolism, in which methionine is an essential amino acid, this reaction does not occur.
Adenosylcobalamin (coenzyme B12) carries a covalently bound adenosyl residue at the metal atom. This is a coenzyme of various isomerases, which catalyze rearrangements following a radical mechanism. The radical arises here through homolytic cleavage of the bond between the metal and the adenosyl group. The most important reaction of this type in animal metabolism is the rearrangement of methylmalonyl-CoA to form succinylCoA, which completes the breakdown of oddnumbered fatty acids and of the branched amino acids valine and isoleucine (see pp. 166 and 414).
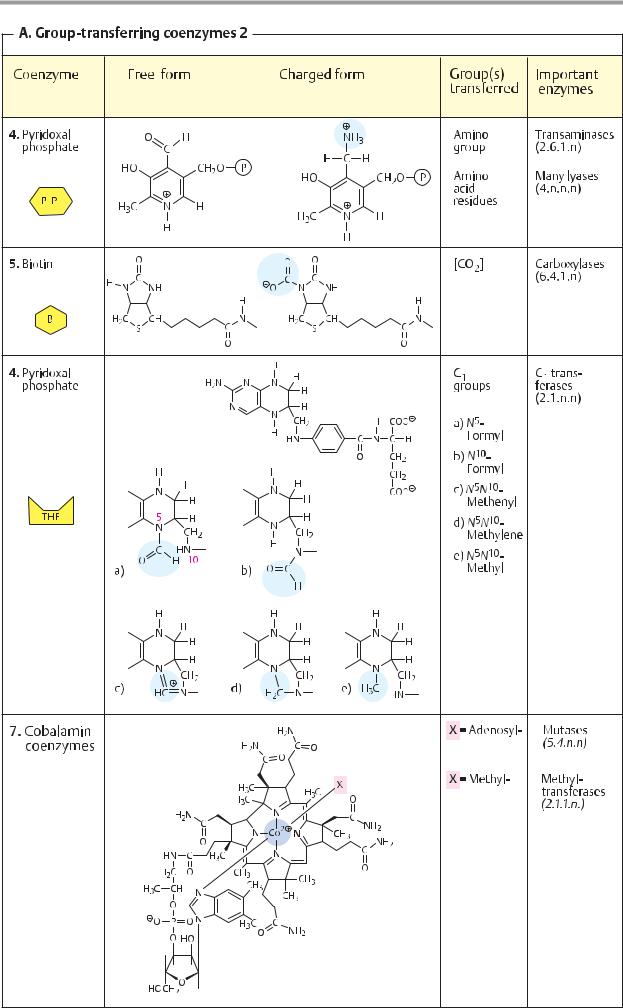
Enzymes |
109 |

110 Metabolism
Activated metabolites
Many coenzymes (see pp. 104ff.) serve to activate molecules or groups that are poorly reactive. Activation consists of the formation of reactive intermediate compounds in which the group concerned is located at a higher chemical potential and can therefore be transferred to other molecules in an exergonic reaction (see p. 124). Acetyl-CoA is an example of this type of compound (see p. 12).
ATP and the other nucleoside triphosphate coenzymes not only transfer phosphate residues, but also provide the nucleotide components for this type of activation reaction. On this page, we discuss metabolites or groups that are activated in the metabolism by bonding with nucleosides or nucleotides. Intermediates of this type are mainly found in the metabolism of complex carbohydrates and lipids.
A. Activated metabolites
1. Uridine diphosphate glucose (UDPglucose)
The inclusion of glucose residues into polymers such as glycogen or starches is an endergonic process. The activation of the glucose building blocks that is required for this takes places in several steps, in which two ATPs are used per glucose. After the phosphorylation of free glucose, glucose 6-phosphate is isomerized to glucose 1-phosphate (a), reaction with UTP (b) then gives rise to UDPglucose, in which the anomeric OH group at C-1 of the sugar is bound with phosphate. This “energyrich” compound (an acetal phosphate) allows exergonic transfer of glucose residues to glycogen (c; see pp. 156, 408) or other acceptors.
2. Cytidine diphosphate choline (CDPcholine)
The amino alcohol choline is activated for inclusion in phospholipids following a similar principle (see p. 170). Choline is first phosphorylated by ATP to form choline phosphate (a), which by reaction with CTP and cleavage of diphosphate, then becomes CDPcholine. In contrast to (1), it is not choline that is transferred from CDPcholine, but rather choline phosphate, which with diacylglycerol yields phosphatidylcholine (lecithin).
3. Phosphoadenosine phosphosulfate (PAPS)
Sulfate residues occur as strongly polar groups in various biomolecules—e.g., in glycosaminoglycans (see p. 346) and conjugates of steroid hormones and xenobiotics (see p. 316). In the synthesis of the “activated sulfate” PAPS, ATP first reacts with anorganic sulfate to form adenosine phosphosulfate (APS, a). This intermediate already contains the “energy-rich” mixed anhydride bond between phosphoric acid and sulfuric acid. In the second step, the 3 -OH group of APS is phosphorylated, with ATP being used again. After transfer of the sulfate residue to OH groups (c), adenosine-3 ,5 -bisphosphate remains.
4. S-adenosyl methionine (SAM)
The coenzyme tetrahydrofolate (THF) is the main agent by which C1 fragments are transferred in the metabolism. THF can bind this type of group in various oxidation states and pass it on (see p. 108). In addition, there is “activated methyl,” in the form of S-adenosyl methionine (SAM). SAM is involved in many methylation reactions—e.g., in creatine synthesis (see p. 336), the conversion of norepinephrine into epinephrine (see p. 352), the inactivation of norepinephrine by methylation of a phenolic OH group (see p. 316), and in the formation of the active form of the cytostatic drug 6-mercaptopurine (see p. 402).
SAM is derived from degradation of the proteinogenic amino acid methionine, to which the adenosyl residue of an ATP molecule is transferred. After release of the activated methyl group, S-adenosyl homocysteine (SAH) is left over. This can be converted back into methionine in two further steps. Firstly, cleavage of the adenosine residue gives rise to the non-proteinogenic amino acid homocysteine, to which a methyl group is transferred once again with the help of N5- methyl-THF (see p. 418). Alternatively, homocysteine can also be broken down into pro- pionyl-CoA.
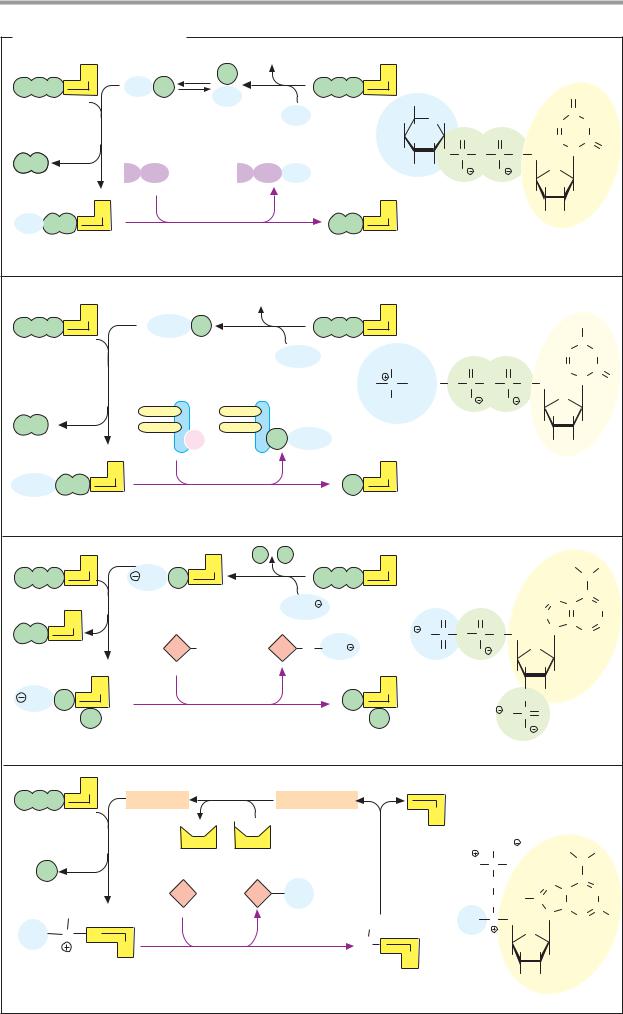
Enzymes 111
A. Activated metabolites
ADP
|
|
|
U |
Glc P |
P |
|
|
|
P |
P |
P |
|
Glc |
a |
P P |
P |
|
|
|
|
|
Glucose |
|
|
||
|
|
|
|
|
|
Glc |
|
|
|
|
|
|
1-phosphate |
|
|
|
|
|
|
|
b |
|
|
|
|
|
|
|
|
|
|
|
|
|
|
P |
P |
|
|
Glycogen |
Extended glycogen |
|
||
|
|
|
|
|
Glc |
|
||
|
|
|
|
|
|
|
|
|
Glc |
P |
P |
U |
c |
|
P |
P |
|
|
|
|
||||||
1. Uridine diphosphate glucose (UDP-glucose)
A
HOCH2
HO H
H |
|
O |
O |
OH H |
|||
HO |
O |
P O |
P O |
H |
OH |
O |
O |
|
|
||
U
UDP-glucose
|
O |
|
HC |
C |
NH |
|
||
HC |
N |
C |
CH2 |
O |
|
|
|
|
O |
|
|
H |
H |
|
H |
H |
|
OH OH
ADP
|
C |
Choline P |
|
|
A |
|
|
|
NH2 |
|
P |
P P |
a |
P P P |
|
|
|
|
|
||
|
|
|
|
|
|
|
|
C |
|
|
|
|
|
|
|
|
|
|
HC |
|
|
|
|
|
|
Choline |
CH3 |
O |
O |
NH |
|
|
|
|
|
|
|
|
|
||||
|
b |
|
|
|
HC |
C |
O |
|||
|
Diacylglycerol |
Phosphatidylcholine H3C |
N (CH2)2 |
O P O |
P O |
CH2 |
N |
|||
|
|
|
|
|
CH3 |
O |
O |
O |
|
|
|
|
|
|
|
H |
H |
|
|||
|
|
|
|
|
|
|
|
|
||
P |
P |
|
|
P Choline |
|
|
|
H |
H |
|
|
|
|
|
|
CDP-choline |
OH OH |
|
|||
|
|
|
|
|
|
|
||||
|
|
|
|
|
|
|
|
|
||
Choline P P |
C |
c |
P |
C |
|
|
|
|
|
|
|
|
|
|
|
|
|
|
|||
2. Cytidine diphosphate choline (CDPcholine)
PP
|
|
|
A |
|
P |
A |
|
|
A |
|
|
|
|
|
H |
N |
H |
P |
P |
P |
|
O3S |
|
a |
P P P |
|
|
|
|
|
|
|
|
||
|
|
|
|
|
|
|
|
|
|
|
|
|
|
C |
|
||
|
|
|
b |
|
|
|
SO |
2 |
|
|
|
|
|
N |
C |
N |
|
|
|
|
|
|
|
O |
O |
|
|
|
|
||||||
|
|
|
A |
|
|
|
4 |
|
|
|
HC |
C |
|
CH |
|||
|
|
|
|
|
|
|
|
|
|
|
|
|
N |
|
|||
P |
P |
|
|
|
|
|
|
|
O S |
O P |
O |
|
CH2 |
N |
|||
|
|
|
|
|
|
|
|
|
|
|
|||||||
|
|
|
|
|
OH |
O SO3 |
O |
O |
|
|
O |
|
|
|
|||
|
|
|
|
|
|
|
H |
H |
|
|
|
||||||
|
|
|
|
|
|
|
Sulfated |
|
|
|
|
|
|
|
|||
|
|
|
|
|
|
|
|
|
|
|
H |
H |
|
|
|
||
|
|
|
A |
|
|
|
substrate |
A |
|
|
|
|
|
|
|||
|
|
|
|
|
c |
|
|
|
|
|
|
|
|
||||
|
|
|
|
|
|
|
|
|
|
O |
OH |
|
|
|
|||
O3S |
P |
|
|
|
P |
|
|
|
|
|
|
|
|||||
|
|
|
|
|
|
|
|
|
O |
P |
O |
|
|
|
|||
|
|
|
P |
|
|
|
|
|
P |
|
|
|
|
|
|||
|
|
|
|
|
|
|
|
|
|
|
|
|
|
|
|
||
3. Phosphoadenosine phosphosulfate (PAPS) |
|
PAPS |
|
|
O |
|
|
|
|
||||||||
|
|
|
|
|
|
|
|
||||||||||
|
|
|
|
|
|
|
|
|
|
||||||||
|
|
|
A |
|
|
a |
|
|
|
|
|
|
|
|
|
|
|
P |
P |
P |
|
Methionine |
Homocysteine |
|
|
|
|
|
|
|
|
|
|||
|
|
|
|
|
|
|
|
|
|
|
|||||||
|
|
|
|
|
|
CH3 |
N5-Methyl- |
A |
|
|
|
|
|
|
|
|
|
|
|
|
b |
|
|
|
Adenosine |
|
|
|
|
|
|
|
|||
|
|
|
|
THF |
THF |
THF |
COO |
|
|
H |
|
H |
|||||
|
|
|
|
|
|
|
|
|
|
N |
|||||||
3 |
|
P |
|
|
|
|
|
|
d |
H3N |
C |
H |
|
|
|
||
|
|
|
|
|
|
|
|
|
|
|
|||||||
|
|
|
|
|
|
|
|
|
CH2 |
|
|
|
C |
|
|||
|
|
|
|
|
|
|
CH3 |
|
|
|
N |
C |
N |
||||
|
|
|
|
|
|
|
|
|
CH2 |
H |
C |
|
|||||
|
|
|
R |
|
|
|
|
|
C |
|
C |
||||||
|
|
|
|
|
|
Methylated |
R |
H3C |
S |
CH2 |
N |
N |
|||||
|
|
|
|
|
|
|
|
|
H |
||||||||
H3C |
|
S |
|
|
c |
substrate |
|
|
|
|
O |
|
|
|
|
||
|
A |
|
|
|
S |
|
|
|
H |
H |
|
|
|
||||
|
|
|
|
|
|
|
|
|
|
|
|
|
|
||||
4. S-adenosyl methionine (SAM) |
|
|
A |
|
|
H |
H |
|
|
|
|||||||
|
|
S-adenosyl- |
|
|
|
OH OH |
|
|
|
||||||||
|
|
|
|
|
|
|
|
|
|
|
|
|
|
|
|||
|
|
|
|
|
|
|
|
|
homocysteine |
|
SAM |
|
|
|
|
||
112 Metabolism
Intermediary metabolism
Hundreds of chemical reactions are constantly taking place in every cell, and taken together these are referred to as the metabolism. The chemical compounds involved in this are known as metabolites. Outside of the cell, almost all of the chemical changes in metabolites would only take place very slowly and without any specific direction. By contrast, organized sequences of chemical reactions with a high rate of throughput, known as metabolic pathways, become possible through the existence of specific enzymes (see p. 88).
A. Intermediary metabolism: overview
A number of central metabolic pathways are common to most cells and organisms. These pathways, which serve for synthesis, degradation, and interconversion of important metabolites, and also for energy conservation, are referred to as the intermediary metabolism.
In order to survive, all cells constantly require organic and inorganic nutrients, as well as chemical energy, which is mainly derived from ATP (see below). Depending on the way in which these needs are satisfied, organisms can be classified into autotrophic and heterotrophic groups. The autotrophs, which include plants and many microorganisms, can synthesize organic molecules from inorganic precursors (CO2). An autotrophic lifestyle is possible through photosynthesis, for example (see p. 128). The heterotrophs—e.g., animals and fungi—depend on organic substances supplied in their diet. The schema shown on this page provides an overview of animal metabolism.
The polymeric substances contained in the diet (proteins, carbohydrates, and nucleic acids—top) cannot be used by the organism directly. Digestive processes first have to degrade them to monomers (amino acids, sugars, nucleotides). These are then mostly broken down by catabolic pathways (pink arrows) into smaller fragments. The metabolites produced in this way (generally referred to as the “metabolite pool”) are then either used to obtain energy through further catabolic conversion, or are built up again into more complex molecules by anabolic pathways (blue
arrows). Of the numerous metabolites in the pool, only three particularly important repre- sentatives—pyruvate, acetyl-CoA, and gly- cerol—are shown here. These molecules represent connecting links between the metabolism of proteins, carbohydrates, and lipids. The metabolite pool also includes the intermediates of the tricarboxylic acid cycle (6). This cyclic pathway has both catabolic and anabolic functions—i.e., it is amphibolic (violet; see p. 138).
Waste products from the degradation of organic substances in animal metabolism include carbon dioxide (CO2), water (H2O), and ammonia (NH3). In mammals, the toxic substance ammonia is incorporated into urea and excreted in this form (see p. 182).
The most important form of storage for chemical energy in all cells is adenosine triphosphate (ATP, see p. 122). ATP synthesis requires energy—i.e., the reaction is endergonic. Conversely, cleavage of ATP into ADP and phosphate releases energy. Exergonic hydrolysis of ATP, as a result of energetic coupling (see p. 16), makes energy-depend- ent (endergonic) processes possible. For example, most anabolic pathways, as well as movement and transport processes, are en- ergy-dependent.
The most important pathway for the synthesis of ATP is oxidative phosphorylation
(see p. 122). In this process, catabolic pathways first form reduced cofactors (NADH+H+, QH2, ETFH2). Electrons are then transferred from these compounds to oxygen. This strongly exergonic process is catalyzed by the respiratory chain and used indirectly for the ATP synthesis (see p. 140). In anaerobic conditions—i.e., in the absence of oxygen— most organisms can fall back on ATP that arises in glycolysis (3). This less ef cient type of ATP synthesis is referred to as fermentation (see p. 146).
While NADH exclusively supplies oxidative phosphorylation, NADPH+H+—a very similar coenzyme—is the reducing agent for anabolic pathways. NADPH + H+ is mainly formed in the pentose phosphate pathway (PPP, 1; see p. 152).
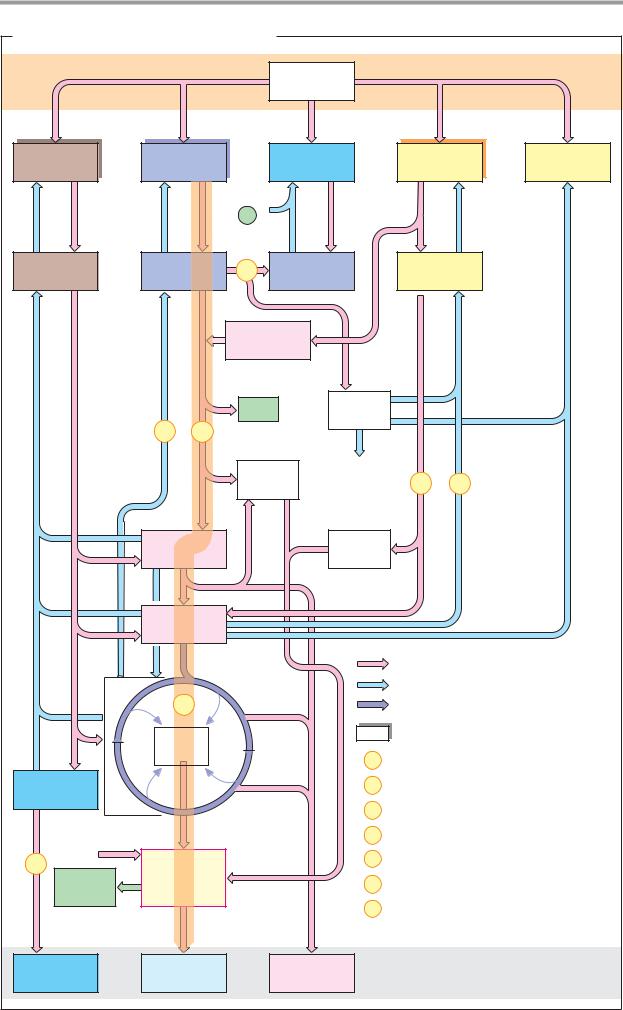
|
|
|
|
|
|
|
Metabolic Regulation |
113 |
|
A. Intermediary metabolism: overview |
|
|
|
|
|
||||
|
|
|
|
|
Food |
|
|
|
|
Proteins |
Poly- |
|
|
Nucleic |
|
Fats |
Iso- |
|
|
saccharides |
|
acids |
|
prenoids |
|
||||
|
|
|
|
|
|
||||
|
|
|
|
Bases |
|
|
|
Lipids |
|
|
|
|
|
P |
|
|
|
|
|
|
|
|
|
|
|
|
|
|
|
Amino |
|
Glucose |
1 |
Pentoses |
Fatty |
|
|
||
acids |
|
acids |
|
|
|||||
|
|
|
|
|
|
|
|
||
|
|
|
|
Glycerol |
|
|
|
|
|
|
|
|
|
ATP |
|
NADPH |
|
|
|
|
|
2 |
3 |
|
|
|
|
|
|
|
|
|
|
|
|
Other |
|
|
|
|
|
|
|
NADH |
biosyn- |
4 |
5 |
|
|
|
|
|
|
|
|
theses |
|
|
|
|
|
Pyruvate |
|
|
NADH |
|
|
|
|
|
|
|
|
ETF |
|
|
|
||
|
|
|
|
|
|
|
|
|
|
|
|
Acetyl |
|
|
|
|
|
|
|
|
|
CoA |
|
|
|
|
|
|
|
|
|
|
|
|
|
|
Catabolic pathway |
|
|
|
|
|
|
|
|
|
Anabolic pathway |
|
|
|
|
6 |
|
|
|
|
Amphibolic pathway |
|
|
|
|
NADH |
|
|
|
Storage compound |
|
||
|
|
|
|
|
|
|
|
||
|
|
QH2 |
|
|
|
1 |
Pentose phosphate pathway |
|
|
NH3 |
|
|
|
|
|
2 |
Gluconeogenesis |
|
|
|
|
|
|
|
|
Glycolysis |
|
|
|
|
|
|
|
|
|
3 |
|
|
|
|
|
|
|
|
|
4 |
β-Oxidation |
|
|
7 |
O2 |
Oxidative |
|
|
5 |
Fatty acid biosynthesis |
|
||
ATP |
phospho- |
|
|
6 |
Tricarboxylic acid cycle |
|
|||
rylation |
|
|
|
||||||
|
|
|
|
|
|
7 |
Urea cycle |
|
|
Urea |
|
H2O |
|
|
CO2 |
|
Waste products |
|
|

114 Metabolism
Regulatory mechanisms
A. Fundamental mechanisms of metabolic regulation
The activities of all metabolic pathways are subject to precise regulation in order to adjust the synthesis and degradation of metabolites to physiological requirements. An overview of the regulatory mechanisms is presented here. Further details are shown on pp. 116ff.
Metabolite flow along a metabolic pathway is mainly determined by the activities of the enzymes involved (see p. 88). To regulate the pathway, it is suf cient to change the activity of the enzyme that catalyzes the slowest step in the reaction chain. Most metabolic pathways have key enzymes of this type on which the regulatory mechanisms operate. The activity of key enzymes is regulated at three independent levels:
Transcriptional control. Here, Biosynthesis of the enzyme protein is influenced at the genetic level (1). Interventions in enzyme synthesis mainly affect synthesis of the corresponding mRNA—i.e., transcription of the gene coding for the enzyme. The term “transcriptional control” is therefore used (see pp. 118, 244). This mechanism is mediated by regulatory proteins (transcription factors) that act directly on DNA. The genes have a special regulatory segment for this purpose, known as the promoter region, which contains binding sites (control elements) for regulatory proteins. The activity of these proteins is, in turn, affected by metabolites or hormones. When synthesis of a protein is increased by transcriptional control, the process is referred to as induction; when it is reduced or suppressed, it is referred to as repression. Induction and repression processes take some time and are therefore not immediately effective.
Interconversion of key enzymes (2) takes effect considerably faster than transcriptional control. In this case, the enzyme is already present at its site of effect, but it is initially still inactive. It is only when needed that it is converted into the catalytically active form, after signaling and mediation from second messengers (see p. 120) through an activating enzyme (E1). If the metabolic pathway is no longer required, an inactivating enzyme (E2) returns the key enzyme to its inactive resting state.
Interconversion processes in most cases involve ATP-dependent phosphorylation of the enzyme protein by a protein kinase or dephosphorylation of it by a protein phosphatase (see p. 120). The phosphorylated form of the key enzyme is usually the more active one, but the reverse may also occur.
Modulation by ligands. An important variable that regulates flow through a metabolic pathway is precursor availability (metabolite A in the case shown here). The availability of precursor A increases along with the activity of themetabolicpathwaysthatformA (3) and it decreases with increasing activity of other pathways that also consume A (4). Transport from one cell compartment to another can also restrict the availability of A.
Coenzyme availability can also often have a limiting effect (5). If the coenzyme is regenerated by a second, independent metabolic pathway, the speed of the second pathway can limit that of the first one. For example, glycolysis and the tricarboxylic acid cycle are mainly regulated by the availability of NAD+ (see p. 146). Since NAD+ is regenerated by the respiratory chain, the latter indirectly controls the breakdown of glucose and fattyacids (respiratory control, see p. 144).
Finally, the activity of key enzymes can be regulated by ligands (substrates, products, coenzymes, or other effectors), which as allosteric effectors do not bind at the active center itself, but at another site in the enzyme, thereby modulating enzyme activity (6; see p. 116). Key enzymes are often inhibited by immediate reaction products, by end products of the reaction chain concerned (“feedback” inhibition), or by metabolitesfromcompletely different metabolic pathways. The precursors for a reaction chain can stimulate their own utilization through enzyme activation.
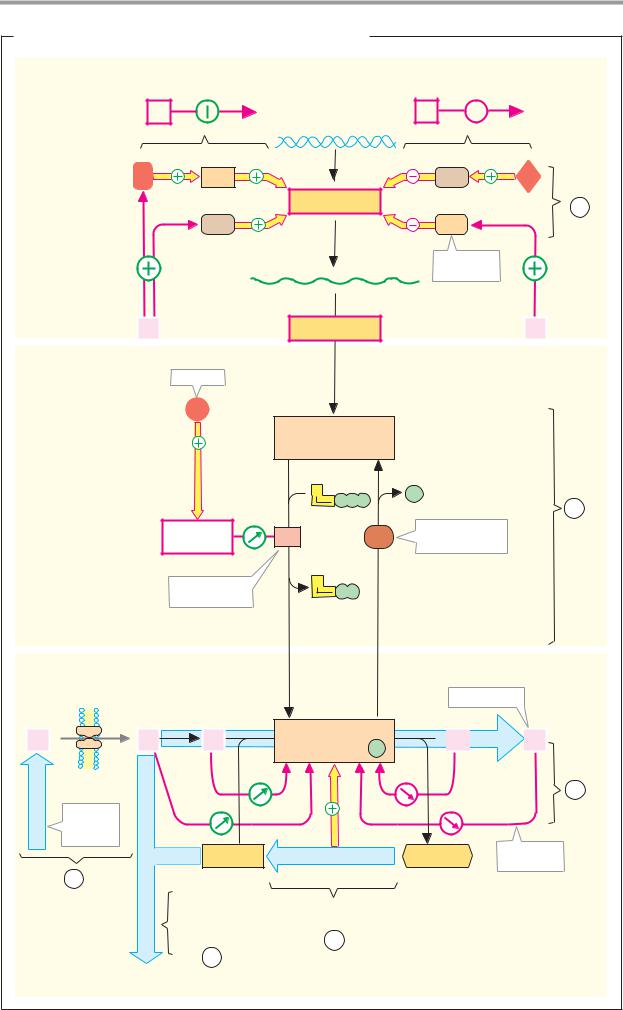
|
|
Metabolic Regulation |
115 |
|
A. Fundamental mechanisms of metabolic regulation |
|
|
|
|
Transcriptional |
Induction |
Repression |
|
|
control |
|
|
|
|
|
|
R |
|
|
|
Gene |
|
|
|
H |
RP |
RP |
H |
|
|
Transcription |
|
|
1 |
|
|
|
|
|
|
RP |
RP |
|
|
|
mRNA |
Regulator |
|
|
|
protein |
|
|
|
|
|
|
|
|
A |
Translation |
Z |
Interconversion
Hormone
H
Key enzyme (inactive)
Second |
E1 |
messenger |
Activated enzyme
A |
|
P |
|
P |
P P |
||
2 |
|||
|
|
||
|
E2 |
Inactivated |
|
|
enzyme |
||
A |
|
|
|
P |
P |
|
Modulation by ligands
A |
A |
B |
Key enzyme (active) P
End product
 C
C 


 Z
Z
6
Meta- |
|
|
|
bolic |
|
|
|
pathway |
|
|
Feedback |
|
Coenzyme |
Coenzyme |
|
|
inhibition |
||
|
|
|
|
3 |
|
|
|
Availability pre- |
Competition |
Regeneration |
|
cursors, com- |
for substrates |
of the coenzyme |
|
partmentation |
or coenzymes |
5 |
|
|
|
|
|
|
4 |
|
|

116 Metabolism
Allosteric regulation
The regulation of aspartate carbamoyltransferase (ACTase), a key enzyme of pyrimidine biosynthesis (see p. 188) is discussed here as an example of allosteric regulation of enzyme activity. Allosteric effects are mediated by the substrate itself or by inhibitors and activators (allosteric effectors, see p. 114). The latter bind at special sites outside the active center, producing a conformational change in the enzyme protein and thus indirectly lead to an alteration in its activity.
A. Aspartate carbamoyltransferase: reaction
ACTase catalyzes the transfer of a carbamoyl residue from carbamoyl phosphate to the amino group of L-aspartate. The N-carbamoyl L-aspartate formed in this way already contains all of the atoms of the later pyrimidine ring (see p. 188). The ACTase of the bacterium Escherichia coli is inhibited by cytidine triphosphate (CTP), an end product of the anabolic metabolism of pyrimidines, and is activated by the precursor ATP.
B. Kinetics
In contrast to the kinetics of isosteric (normal) enzymes, allosteric enzymes such as ACTase have sigmoidal (S-shaped) substrate saturation curves (see p. 92). In allosteric systems, the enzyme’s af nity to the substrate is not constant, but depends on the substrate concentration [A]. Instead of the Michaelis constant Km (see p. 92), the substrate concentration at half-maximal rate ([A]0.5) is given. The sigmoidal character of the curve is described by the Hill coef•cient h. In isosteric systems, h = 1, and h increases with increasing sigmoidicity.
Depending on the enzyme, allosteric effectors can influence the maximum rate Vmax, the semi-saturation concentration [A]0.5, and the Hillcoef cienth. If it ismainlyVmax that is changed, the term “V system” is used. Much more common are “K systems”, in which allosteric effects only influence [A]0.5 and h.
The K type also includes ACTase. The inhibitor CTP in this case leads to right-shifting of
the curve, with an increase in [A]0.5 and h (curve II). By contrast, the activator ATP
causes a left shift; it reduces both [A]0.5 and h (curve III). This type of allosteric effect was first observed in hemoglobin (see p. 280), which can be regarded as an “honorary” enzyme.
C. R and T states
Allosteric enzymes are almost always oligomers with 2–12 subunits. ACTase consists of sixcatalyticsubunits(blue) and six regulatory subunits (yellow). The latter bind the allosteric effectors CTP and ATP. Like hemoglobin, ACTase can also be present in two conforma- tions—the less active T state (for “tense”) and the more active R state (for “relaxed”). Substrates and effectors influence the equilibrium between the two states, and thereby give rise to sigmoidal saturation behavior. With increasing aspartate concentration, the equilibrium is shifted more and more toward the R form. ATP also stabilizes the R conformation by binding to the regulatory subunits. By contrast, binding of CTP to the same sites promotes a transition to the T state. In the case of ACTase, the structural differences between the R and T conformations are particularly dramatic. In T R conversion, the catalytic subunits separate from one another by 1.2 nm, and the subunits also rotate around the axis of symmetry. The conformations of the subunits themselves change only slightly, however.
D. Structure of a dimer
The subunits of ACTase each consist of two domains—i.e., independently folded partial structures. The N-terminal domain of the regulatory subunit (right) mediates interaction with CTP or ATP (green). A second, Zn2+-con- taining domain (Zn2+ shown in light blue) establishes contact with the neighboring catalytic subunit. Between the two domains of the catalytic subunit lies the active center, which is occupied here by two substrate analogs (red).
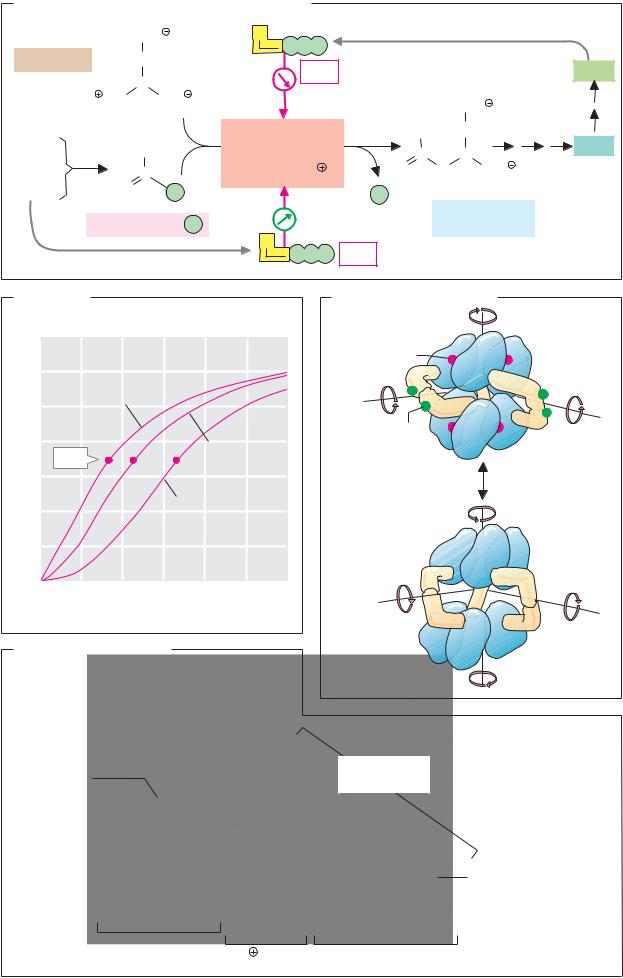
Metabolic Regulation |
117 |
A. Aspartate carbamoyltransferase: reaction |
|
|
||||
|
COO |
C |
|
|
|
|
L-Aspartate |
|
|
P |
P |
P |
|
CH2 |
|
|
CTP |
CTP |
||
|
C |
|
|
|||
|
|
|
|
|
|
|
H3N |
H |
COO |
|
|
|
COO |
|
|
|
|
|||
|
|
|
|
Aspartate |
|
H2N |
|
CH2 |
UMP |
CO |
2 |
|
NH2 |
carbamoyl- |
|
|
|
C |
|
|
transferase |
|
C |
|
|
||||
|
|
|
|
N |
|
||||
R-NH2 |
|
C |
2.1.3.2 [ Zn2 |
] |
O |
H |
COO |
||
|
|
H |
|
||||||
ATP |
O |
|
|
|
|
|
|
||
P |
|
|
P |
|
|
|
|||
|
|
|
|
|
|
|
|
||
|
|
N-Carbamoyl– P |
|
|
|
N-Carbamoyl |
|||
|
|
|
|
|
L-aspartate |
||||
|
|
|
|
A |
|
ATP |
|
|
|
|
|
|
|
P P |
P |
|
|
|
|
B. Kinetics |
|
|
|
|
C. R and T conformation |
||||
Activity
7 |
|
|
|
Active |
|
|
C2 C3 |
|
|
|
|
|
center |
|
|
||
6 |
2 mM ATP |
|
|
R'1 |
|
|
|
R'2 |
|
III |
|
|
|
|
|||
|
|
|
|
|
|
|||
5 |
h = 1.4 |
|
|
R1 |
|
|
|
|
|
|
|
|
|
|
R2 |
||
|
|
|
|
Effector- |
C4 |
|
|
|
|
|
|
|
C5 |
|
C6 |
||
4 |
|
I |
Without |
binding |
|
|||
[A]0.5 |
|
|
|
|||||
|
effector |
site |
|
|
|
T conformation |
||
3 |
|
|
h = 2.0 |
|
|
|
|
|
|
|
|
|
|
|
|
(less active) |
|
|
|
|
|
|
|
|
|
|
2 |
|
II |
0.5 mM CTP |
|
|
|
|
|
|
h = 2.3 |
|
|
|
|
|
||
|
|
|
|
|
|
|
|
|
1 |
|
|
|
|
C1 |
|
C2 |
C3 |
|
|
|
|
|
|
|
||
0 |
5.0 |
|
10.0 |
15.0 |
R'1 |
|
|
R'2 |
0.0 |
|
|
R3 |
|
||||
|
[Aspartate] (mM) |
|
|
|
||||
|
|
R1 |
|
|
R2 |
|||
|
|
|
|
|
|
|
||
C4 |
C6 |
D. Structure of a dimer |
C5 |
R conformation (more active)
Substrate |
Regulatory |
|
subunit |
||
|
ATP (CTP)
Catalytic |
Zn2 domain ATP/CTP-binding domain |
subunit |

118 Metabolism
Transcription control
A. Functioning of regulatory proteins
Regulatory proteins (transcription factors) are involved in controlling gene expression in all cells. These regulatory proteins bind to specific DNA sequences and thereby activate or inhibit the transcription of genes (Transcription control). The effects of transcription factors are usually reversible and are often controlled by ligands or by interconversion.
The nomenclature for transcription factors is confusing. Depending on their mode of action, various terms are in use both for the proteins themselves and for the DNA sequences to which they bind. If a factor blocks transcription, it is referred to as a repressor; otherwise, it is called an inducer. DNA sequences to which regulatory proteins bind are referred to as control elements. Inprokaryotes, control elements that serve as binding sites for RNA polymerases are called promoters, whereas repressor-binding sequences are usually called operators. Control elements that bind activating factors are termed enhancers, while elements that bind inhibiting factors are known as silencers.
The numerous regulatory proteins that are known can be classified into four different groups (1–4), based on their mechanisms of action. Negative gene regulation—i.e., switching off of the gene concerned—is carried out by repressors. Some repressors only bind to DNA (1a) in the absence of specific ligands (L). In this case, the complex between the repressor and the ligand loses its ability to bind to the DNA, and the promoter region becomes accesible for binding of RNA polymerase (1b). It is often the free repressor that does not bind to the DNA, so that transcription is only blocked in the presence of the ligand (2a, 2b). A distinction between two different types of positive gene regulation can be made in the same way. If it is only the free inducer that binds, then transcription is inhibited by the appropriate ligand (3). Conversely, many inducers only become active when they have bound a ligand (4). This group includes the receptors for steroid hormones, for example (see p. 378).
B. Lactose operon
The well-investigated lactose operon of the bacterium Escherichial coli can be used here as an example of transcriptional control. The lac operon is a DNA sequence that is simultaneously subject to negative and positive control. The operon contains the structural genes for three proteins that are required for the utilization of lactose (one transporter and two enzymes), as well as control elements that serve to regulate the operon.
Since lactose is converted to glucose in the cell, there is no point in expressing the genes if glucose is already available. And indeed, the genes are in fact only transcribed when glucose is absent and lactose is present (3). This is achieved by interaction between two regulatory proteins. In the absence of lactose, the lac repressor blocks the promoter region (2). When lactose is available, it is converted into allolactose, which binds to the repressor and thereby detaches it from the operator (3). However, this is still not suf cient for the transcriptionof thestructuralgenes. For binding of the RNA polymerase to take place, an inducer—the catabolite activator protein (CAP)—is required, which only binds to the DNA when it is present as a complex with 3,5 -cyclo-AMP (cAMP; see p. 386). cAMP, a signal for nutrient deficiency, is only formed by E. coli in the absence of glucose.
The interaction between the CAP–cAMP complex and DNA is shown in Fig. 4. Each subunit of the dimeric inducer (yellow or orange) binds one molecule of cAMP (red). Contact with the DNA (blue) is mediated by two “recognition helices” that interact with the major groove of the DNA. The bending of the DNA strand caused by CAP has functional significance.
Transcription control is much more complex in eukaryotes (see p. 244). The number of transcription factors involved is larger, and in addition the gene activity is influenced by the state of the chromatin (see p. 238).

Metabolic Regulation |
119 |
A. Functions of regulatory proteins
Negative regulation |
Positive regulation |
||
|
|
|
|
Without ligand |
With ligand |
Without ligand |
With ligand |
RNA |
|
|
|
|
|
mRNA |
RNA |
|
|
|
|
poly- |
|
|
|
|
|
|
|
|
|
|
|
merase |
|
|
|
|
|
|
poly- |
|
|
|
|
|
|
|
|
|
|
|
merase |
|
|
|
|
DNA |
Gen |
|
|
|
|
Inducer |
|
|
|
Promoter |
|
|
|
|
|
|
|
|
|
|
|
||
|
Repressor |
|
|
Ligand |
L |
|
|
|
|
L |
|
1a |
|
1b |
3a |
|
|
|
3b |
||||
|
|
|
|
|
|
|
|
||||
|
|
|
|
|
|
|
|
|
|
|
L |
|
|
|
|
|
|
L |
|
|
|
|
|
2a |
|
|
2b |
|
|
|
4a |
|
|
|
4b |
B. Lactose operon |
|
|
|
|
|
|
|
|
|
|
|
Catabolite |
|
|
|
Genes for |
|
|
5' |
Adenin |
|||
|
|
|
permease |
|
|
||||||
activator |
|
|
|
|
|
|
CH2 |
|
|||
|
|
|
galactosidase |
|
|
|
O |
||||
protein |
|
Promoter |
|
|
O |
||||||
CAP |
transacetylase |
|
|
H |
H |
||||||
(CAP) |
O |
|
|||||||||
|
|
|
|
|
P |
|
|||||
|
|
|
|
|
|
|
|
|
H 3' |
H |
|
|
|
|
|
|
|
|
O |
|
|
||
|
|
|
|
|
|
|
|
|
O |
OH |
|
|
|
|
|
|
|
|
|
|
|
||
1. |
CAP-binding |
Operator |
|
|
|
|
|
|
|||
site |
|
|
|
|
|
|
|
|
|
|
|
RNA polymerase |
|
|
|
|
|
Recognition |
|
|
|
cAMP |
|
(only binds in the |
|
|
|
|
|
helix |
|
|
|
|
|
presence of |
|
|
|
|
|
|
|
|
|
|
|
CAP · cAMP) |
|
|
|
|
|
|
|
|
|
|
|
Lactose |
|
|
|
|
lac Repressor |
|
|
|
|
|
|
|
|
|
|
|
|
|
|
|
|
||
2. |
|
|
|
|
|
|
|
|
|
|
|
Glucose |
cAMP |
|
|
Lactose catabolism |
|
|
|
|
|
||
|
|
|
|
|
|
|
|
|
|
|
|
|
|
|
|
|
mRNA |
|
|
|
|
|
|
|
CAP · cAMP |
|
Transcription |
|
|
|
|
|
|||
|
|
|
|
|
|
Repressor |
|
|
|
|
|
Lactose |
|
|
|
|
|
allo- |
|
|
|
|
|
|
Allolactose |
|
|
|
lactose |
|
|
|
|
|
|
3. |
|
|
|
complex |
4. CAP · cAMP bound to DNA |
||||||
|
|
|
|
|
|
||||||

120 Metabolism
Hormonal control
In higher organisms, metabolic and other processes (growth, differentiation, control of the internal environment) are controlled by hormones (see pp. 370ff.)
A. Principles of hormone action
Depending on the type of hormone, hormone signals are transmitted to the target cells in different ways. Apolar (lipophilic) hormones penetrate the cell and act in the cell nucleus, while polar (hydrophilic) hormones act on the external cell membrane.
Lipophilic hormones, which include the steroid hormones, thyroxine, and retinoic acid, bind to a specific receptor protein inside their target cells. The complex formed by the hormone and the receptor then influences transcription of specific genes in the cell nucleus (see pp. 118, 244). The group of hydrophilic hormones (see p. 380) consists of hormones derived from amino acids, as well as peptide hormones and proteohormones. Their receptors are located in the plasma membrane. Binding of the hormone to this type of receptor triggers a signal that is transmitted to the interior of the cell, where it controls the processes that allow the hormone signal to take effect (signal transduction; see pp. 384ff.)
B. Hormonal regulation of glucose metabolism in the liver
The liver plays a major role in glucose homeostasis in the organism (see p. 310). If glucose deficiency arises, the liver releases glucose into the blood, and when blood sugar levels are high, it takes glucose up from the blood and converts it into different metabolites. Several hormones from both groups are involved in controlling these processes. A very simplified version of the way in which they work is presented here. Glycogen is the form in which glucose is stored in the liver and muscles. The rate of glycogen synthesis is determined by glycogen synthase (bottom right), while its breakdown is catalyzed by glycogen phosphorylase (bottom left).
Regulation by interconversion (bottom). If the blood glucose level falls, the peptide hormone glucagon is released. This activates
glycogen breakdown, releasing glucose, and at the same time inhibits glycogen synthesis. Glucagon binds to receptors in the plasma membrane (bottom left) and, with mediation by a G-protein (see p. 386), activates the enzyme adenylate cyclase, which forms the second messenger 3,5 -cyclo-AMP (cAMP) from ATP. cAMP binds to another enzyme, protein kinase A (PK-A), and activates it. PK-A has several points of attack. Through phosphorylation, it converts the active form of glycogen synthase into the inactive form, thereby terminating the synthesis of glycogen. Secondly, it activates another protein kinase (not shown), which ultimately converts the inactive form of glycogen phosphorylase into the active form through phosphorylation.Theactivephosphorylasereleasesglucose 1-phosphate from glycogen, which after conversion into glucose 6-phosphate supplies free glucose. In addition, via an inhibitor (I) of protein phosphatase (PP), active PK-A inhibits inactivationofglycogenphosphorylase.When the cAMP level falls again, phosphoprotein phosphatases become active, which dephosphorylate the various phosphoproteins in the cascade described, and thereby arrest glycogen breakdown and re-start glycogen synthesis. Activation and inactivation of proteins through phosphorylation or dephosphorylation is referred to as interconversion.
In contrast to glucagon, the peptide hormone insulin (see p. 76) increases glycogen synthesis and inhibits glycogen breakdown. Via several intermediates, it inhibits protein kinase GSK-3 (bottom right; for details, see p. 388) and thereby prevents inactivation of glycogen synthase. In addition, insulin reduces the cAMP level by activating cAMP phosphodiesterase (PDE).
Regulation by transcriptional control (top). If the liver’s glycogen reserves have been exhausted, the steroid hormone cortisol maintains glucose release by initiating the conversion of amino acids into glucose (gluconeogenesis; see p. 154). In the cell nucleus, the complex of cortisol and its receptor (see p. 378) binds to the promoter regions of various key enzymes of gluconeogenesis and leads to their transcription. The active enzymes are produced through translation of the mRNA formed. Control of the transcription of the gluconeogenesis enzyme PEP carboxykinase is discussed on p. 244.

|
|
|
|
|
|
|
Metabolic Regulation |
121 |
|||
A. Principles of hormone action |
|
|
|
|
|
|
|
||||
|
Lipophilic |
H |
|
|
|
H |
Hydrophilic |
|
|
||
|
|
|
|
|
|
|
|
||||
|
hormones |
|
|
|
|
H |
hormones |
|
|
||
|
|
|
|
|
|
|
|
|
|
|
|
|
|
|
|
Receptor |
|
|
Receptor |
|
|
|
|
|
|
|
|
|
|
|
|
|
|
|
|
|
|
|
|
H |
|
|
|
|
|
|
|
|
DNA |
H H |
|
|
|
|
|
|
|
|
|
|
|
|
|
Tran- |
|
|
Second messenger |
|
|
||
|
|
|
|
scription |
|
|
|
|
|
|
|
|
|
Polysome |
mRNA |
|
|
|
|
|
|
|
|
|
|
|
|
|
|
|
|
|
|
||
|
Translation |
|
|
|
|
|
|
|
|
||
|
|
Protein |
Cell response |
|
|
Cell response |
|
|
|||
|
|
|
|
|
|
|
|
|
|
||
B. Hormonal regulation of glucose metabolism in the liver |
|
|
|
|
|||||||
|
|
|
|
Gene 1 |
|
Gene 2 |
Gene 3 |
|
|
||
|
Hormone |
|
|
|
|
|
|
Transcription |
|
||
|
receptor |
|
|
|
|
|
|
|
|
|
|
|
complex |
|
|
mRNA 1 |
|
mRNA 2 |
|
mRNA 3 |
|
||
|
|
|
|
|
|
|
|
||||
|
|
|
|
|
|
|
|
|
Translation |
|
|
Cortisol |
Gluco- |
|
|
Enzyme 1 |
|
Enzyme 2 |
|
Enzyme 3 |
|
||
|
corticoid |
|
|
|
|
|
|||||
|
receptor |
|
|
|
|
|
|
|
|
|
|
Glu- |
|
|
|
Glucose |
Glc-6- |
P |
|
|
Amino |
|
|
cose |
|
|
|
|
|
acids |
|
|
|||
|
|
|
|
|
|
Gluconeogenesis |
|
|
|||
|
|
|
|
|
|
|
|
|
|
||
|
|
|
ATP |
cAMP |
AMP |
|
|
|
|
|
|
|
Adenylate |
|
|
|
|
|
|
|
|
||
|
cyclase |
|
|
|
|
|
|
|
|
|
|
|
|
|
|
PDE |
|
|
|
|
|
|
|
|
|
|
|
|
Glc-1- P |
GSK-3 |
|
|
|
|
|
|
|
|
|
PKA |
|
|
|
|
|
|
|
|
|
|
|
|
|
|
|
|
|
|
|
|
|
|
|
|
|
|
|
|
PI3K |
|
|
|
|
Gα |
I |
|
P |
|
|
|
P |
|
|
|
|
|
|
|
|
|
|
|
|
||
|
|
|
|
|
|
|
|
IRS |
P |
|
|
|
|
|
|
|
|
|
|
|
|
||
|
Glucagon |
|
PP |
Glycogen |
PP |
|
|
|
|
||
|
|
|
|
|
|
|
|
||||
|
receptor |
|
|
|
|
|
|
|
|||
|
|
|
|
|
|
|
|
|
|
||
|
|
|
|
Glycogen |
|
|
Glycogen |
|
Insulin |
|
|
|
|
|
|
phosphorylase |
|
|
synthase |
|
receptor |
|
|
Glucagon |
|
|
|
|
|
|
|
|
Insulin |
||
122 Metabolism
ATP
The nucleotide coenzyme adenosine triphosphate (ATP) is the most important form of chemical energy in all cells. Cleavage of ATP is strongly exergonic. The energy this provides (∆G; see p. 16) is used to drive endergonic processes (such as biosynthesis and movement and transport processes) through energetic coupling (see p. 124). The other nucleoside triphosphate coenzymes (GTP, CTP, and UTP) have similar chemical properties to ATP, but they are used for different tasks in metabolism (see p. 110).
A. ATP: structure
In ATP, a chain of three phosphate residues is linked to the 5 -OH group of the nucleoside adenosine (see p. 80). These phosphate residues are termed α, β , and γ. The α phosphate is bound to ribose by a phosphoric acid ester bond. The linkages between the three phosphate residues, on the other hand, involve much more unstable phosphoric acid anhydride bonds. The active coenzyme is in fact generally a complex of ATP with an Mg2+ ion, which is coordinatively bound to the α and β phosphates (Mg2+ ATP4–). However, the term “ATP” is usually used for the sake of simplicity.
B. Hydrolysis energies
The formula for phosphate residues shown in Fig. A, with single and double bonds, is not an accurate representation of the actual charge distribution. In ATP, the oxygen atoms of all three phosphate residues have similarly strong negative charges (orange), while the phosphorus atoms represent centers of positive charge. One of the reasons for the instability of phosphoric anhydride bonds is the repulsion between these negatively charged oxygen atoms, which is partly relieved by cleavage of a phosphate residue. In addition, the free phosphate anion formed by hydrolysis of ATP is better hydrated and more strongly resonance-stabilized than the corresponding residue in ATP. This also contributes to the strongly exergonic character of ATP hydrolysis.
In standard conditions, the change in free enthalpy ∆G0 (see p. 18) that occurs in the hydrolysis of phosphoric acid anhydride bonds amounts to –30 to –35 kJ mol–1 at pH 7. The particular anhydride bond of ATP that is cleaved only has a minor influence on ∆G0 (1–2). Even the hydrolysis of diphosphate (also known as pyrophosphate; 4) still yields more than –30 kJ mol–1. By contrast, cleavageofthe esterbond betweenriboseand phosphate only provides –9 kJ mol–1 (3).
In the cell, the ∆G of ATP hydrolysis is substantially larger, because the concentrations of ATP, ADP and Pi are much lower than in standard conditions and there is an excess of ATP over ADP (see p. 18). The pH value and Mg2+ concentration alsoaffect the value of ∆G. The physiological energy yield of ATP hydrolysis to ADP and anorganic phosphate (Pi) is probably around –50 kJ mol–1.
C. Types of ATP formation
Only a few compounds contain phosphate residues with a group transfer potential (see p. 18) that is high enough to transfer them to ADP and thus allow ATP synthesis. Processes that raise anorganic phosphate to this type of high potential are called substrate level phosphorylations (see p. 124). Reactions of this type take place in glycolysis (see p. 150) and in the tricarboxylic acid cycle (see p. 136). Another “energy-rich” phosphate compound is creatine phosphate, which is formed from ATP in muscle and can regenerate ATP as needed (see p. 336).
Most cellular ATP does not arise in the way described above(i.e.,bytransferofphosphate residues from organic molecules to ADP), but rather by oxidative phosphorylation. This process takes place in mitochondria (or as light-driven phosphorylation in chloroplasts) and is energetically coupled to a proton gradient over a membrane. These H+ gradients are established by electron transport chains and are used by the enzyme ATP synthase as a source of energy for direct linking of anorganic phosphate to ADP. In contrast to substrate level phosphorylation, oxidative phosphorylation requires the presence of oxygen (i.e., aerobic conditions).
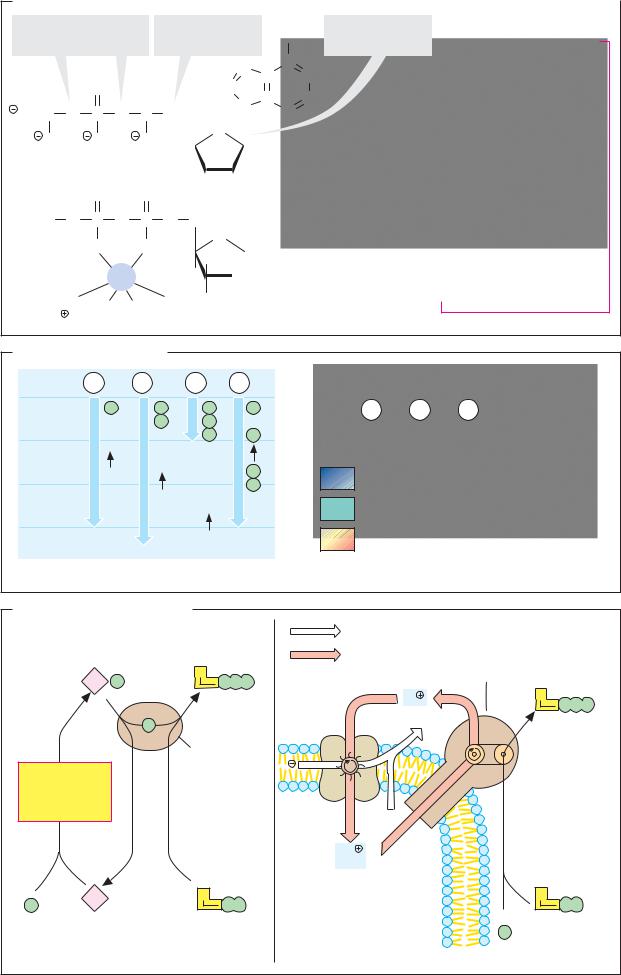
Energy Metabolism |
123 |
A. ATP: structure |
|
|
|
|
|
|
|
|
|
|
|
|
|
|
|
|
|
|
|
|
|
|
|
||||||
|
|
|
|
|
|
|
|
|
|
|
|
|
|
|
N-glycosidic |
|
|
|
|
|
|||||||||
Phosphoric acid |
|
|
|
Phosphoric acid |
|
NH2 |
|
|
|
|
|
||||||||||||||||||
anhydride bonds |
|
|
|
ester bond |
|
|
|
|
bond |
|
|
|
|
|
|||||||||||||||
|
|
|
|
|
|
|
|
|
|
|
|
||||||||||||||||||
|
|
|
|
|
|
|
|
|
|
|
|
|
|
|
|
|
N |
C |
C |
|
|
|
|
|
Adenine |
|
|||
|
|
O |
O |
O |
|
|
|
|
|
|
|
|
N |
|
|
|
|
|
|
||||||||||
|
|
|
|
|
|
|
|
|
N |
C |
|
CH |
|
|
|
|
|
|
|||||||||||
|
|
|
|
|
|
|
HC |
|
|
|
|
|
|
|
|
|
|
|
|||||||||||
|
|
|
|
|
|
|
|
|
|
|
CH2 |
|
|
|
|
N |
|
|
|
|
|
|
|
|
|||||
O |
|
Pγ |
O Pβ O Pα |
O |
|
|
|
|
|
|
|
|
|
|
|
|
|
|
|||||||||||
|
|
|
|
|
|
|
|
|
|
|
|
|
|
||||||||||||||||
|
|
O |
O |
O |
|
|
|
|
|
O |
|
|
|
|
|
|
|
|
|
|
|
|
|
|
|||||
|
|
|
|
|
|
H |
H |
|
|
|
|
|
|
|
|
|
|
|
|
||||||||||
|
|
|
|
|
|
|
|
|
|
|
|
|
|
|
|
|
|
|
|
|
|
|
|
|
|
||||
|
|
|
|
|
|
|
|
|
|
|
|
|
|
|
|
|
|
|
|
|
|
|
|
|
|
|
|
|
|
1. Formula |
|
|
|
|
|
|
|
H |
|
|
H |
|
|
|
|
|
|
|
|
|
|
|
|||||||
|
|
|
|
|
|
O |
O |
|
|
|
|
|
|
|
|
|
|
|
|
|
|
|
|
|
|
||||
|
|
|
|
|
|
|
|
|
|
OH OH |
|
|
|
|
|
|
|
|
|
|
|
||||||||
|
|
|
|
|
O |
Pβ O |
Pα |
|
O CH2 |
|
|
|
|
|
|
|
|
|
|
|
|
|
|
||||||
|
|
|
|
|
|
O |
O |
|
|
|
|
|
O |
|
|
|
|
|
|
|
|
|
|
|
|
|
|
||
|
|
|
|
|
|
|
|
|
|
H |
|
|
|
|
|
γ |
|
β |
|
α |
|
|
Ribose |
|
|||||
|
|
|
|
|
|
|
|
|
|
|
|
|
|
|
|
|
|
|
|
|
|
|
|
||||||
|
|
|
|
|
|
Mg |
|
|
|
|
|
|
H |
|
|
|
|
|
|
|
|
|
|
||||||
|
|
|
|
|
|
|
|
|
|
|
|
|
|
|
|
|
|
|
|
|
|
|
|
|
|
||||
Phosphate residue
2. Mg2 |
-Complex |
|
OH |
|
|
|
Adenosine |
|
|
|
|
|
|
||
B. Hydrolysis energies |
|
|
|
|
|
||
|
1 |
2 |
3 |
4 |
|
|
|
∆G OI |
P |
P |
P |
P |
1 |
2 |
3 |
kJ · mol-1 |
+ |
P |
P |
+ |
|
|
|
-10 |
ATP ADP |
+ |
P |
P |
|
|
|
ATP AMP |
+ |
|
|
|
|
||
-20 |
Adenosine |
P |
Positive |
|
|
||
P |
|
|
|||||
|
|
|
|||||
|
|
Neutral |
|
|
|||
-30 |
|
|
ATP |
|
Negative |
|
|
|
|
|
|
|
|
||
|
|
|
|
|
|
|
|
1. Hydrolysis energies |
|
|
2. ATP: charge density |
|
|||
C. Types of ATP formation |
|
|
|
|
|
|
|
Phosphorylated |
|
|
Electrons |
|
|
|
|
substrate |
|
|
Protons |
ATP |
|
|
|
|
A |
|
|
synthase |
|
|
|
P |
P |
P |
P |
|
|
|
|
|
ATP |
|
H |
|
A |
|
|
|
|
|
P |
P |
P |
||
|
|
Ared |
|
||||
P |
|
|
|
ATP |
|
|
|
|
Enzyme |
e |
|
|
|
|
|
Substrate |
|
|
|
|
|
|
|
|
|
|
|
|
|
|
|
chain phos- |
|
|
|
|
|
|
|
phorylation |
|
|
A |
|
|
|
|
|
|
|
|
|
|
|
|
|
|
|
H |
|
|
|
|
|
A |
|
|
|
A |
|
|
P |
P |
P |
|
|
P |
P |
|
Substrate |
ADP |
|
|
P |
ADP |
|
|
|
|
|
|
|
|
|
|
1. Phosphate transfer |
|
|
2. Oxidative phosphorylation |
|
|
|
|

124 Metabolism
Energetic coupling
The cell stores chemical energy in the form of “energy-rich” metabolites. The most important metabolite of this type is adenosine triphosphate (ATP), which drives a large number of energy-dependent reactions via energetic coupling (see p. 16).
A. Energetic coupling
The change in free enthalpy ∆G0 during hydrolysis (see p. 18) has been arbitrarily selected as a measure of the group transfer potential of “energy-rich” compounds. However, this does not mean that ATP is in fact hydrolyzed in energeticallycoupled reactions. If ATP hydrolysis and an endergonic process were simply allowed to run alongside each other, the hydrolysis would only produce heat, without influencing the endergonic process. For coupling, the two reactions have to be linked in such a way that a common intermediate arises. This connection is illustrated here using the example of the glutamine synthetase reaction.
Direct transfer of NH3 to glutamate is endergonic (∆G0 = +14 kJ mol–1; see p. 18), and can therefore not take place. In the cell, the reaction is divided into two exergonic steps. First, the γ-phophate residue is transferred from ATP to glutamate. This gives rise to an “energy-rich” mixed acid anhydride. In the second step, the phosphate residue from the intermediate is substituted by NH3, and glutamine and free phosphate are produced.
The energy balance of the reaction as a whole (∆G0 = –17 kJ mol–1) is the sum of the
changes in free enthalpy of direct glutamine
synthesis (∆G0 = 14 kJ |
mol–1) plus ATP hy- |
drolysis (∆G0 = –31 kJ |
mol–1), although ATP |
has not been hydrolyzed at all.
B. Substrate-level phosphorylation
As mentioned earlier (see p. 122), there are a few metabolites that transfer phosphate to ADP in an exergonic reaction and can therefore form ATP. In ATP synthesis, anorganic phosphate or phosphate bound in an esterlike fashion is transferred to bonds with a high phosphate transfer potential. Reactions of this type are termed “substrate-level phos-
phorylations,” as they represent individual steps within metabolic pathways.
In the glyceraldehyde 3-phosphate dehydrogenation reaction, a step involved in glycolysis (1; see also C), the aldehyde group in glyceraldehyde 3-phosphate is oxidized intoa carboxyl group. During the reaction, an anorganic phosphate is also introduced into the product, producing a mixed acid anhy- dride—1,3-bisphosphoglycerate. Phosphopyruvate hydratase (“enolase”, 2) catalyzes the elimination of water from 2-phosphoglycer- ate. In the enol phosphate formed (phosphoe- nol pyruvate), the phosphate residue—in contrast to 2-phosphoglycerate—is at an extremely high potential (∆G0 of hydrolysis: –62 kJ mol–1). A third reaction of this type is the formation of succinyl phosphate, which occurs in the tricarboxylic acid cycle as an individual step in the succinyl CoA ligase reaction. Here again, anorganic phosphate is introduced into a mixed acid anhydride bond to be transferred from there to GDP. Succinyl phosphate is only an intermediate here, and is not released by the enzyme.
In the literature, the term “substrate level phosphorylation” is used inconsistently. Some authors use it to refer to reactions in which anorganic phosphate is raised to a high potential, while others use it for the subsequent reactions, in which ATP or GTP is formed from the energy-rich intermediates.
C. Glyceraldehyde-3-phosphate dehydrogenase
The reaction catalyzed during glycolysis by glyceraldehyde-3-phosphate dehydrogenase
(GADPH) is shown here in detail. Initially, the SH group of a cysteine residue of the enzyme is added to the carbonyl group of glyceraldehyde 3-phosphate (a). This intermediate is oxidized by NAD+ into an “en- ergy-rich” thioester (b). In the third step (c), anorganic phosphate displaces the thiol, and the mixed anhydride 1,3-bisphosphoglycerate arises. In this bond, the phosphate residue is at a high enough potential for it to be transferred to ADP in the next step (not shown; see p. 150).
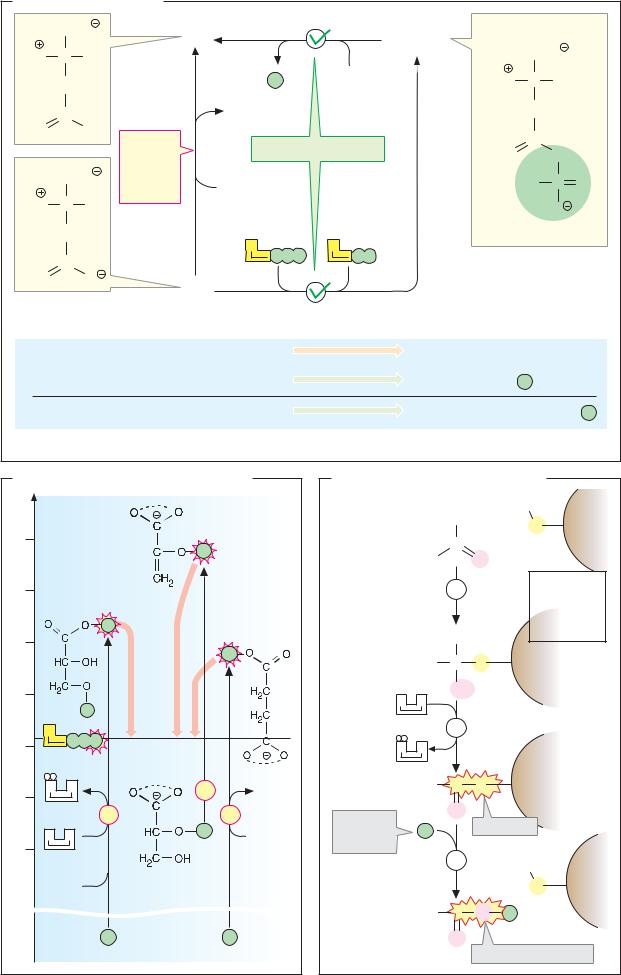
Energy Metabolism |
125 |
A. Energetic coupling
|
|
COO |
Gln |
|
|
|
|
Glu-γ- |
|
|
|
|
|
|
||||
|
|
|
|
|
|
|
|
|
phosphate |
|
|
COO |
|
|||||
H3N |
C |
H |
|
|
|
|
|
|
|
|
|
|||||||
|
|
|
|
|
|
|
|
|
|
|
|
|||||||
|
|
|
|
|
|
|
|
|
|
|
|
|
|
|||||
|
|
(CH2)2 |
|
|
|
P |
|
NH3 |
|
|
|
H3N |
C |
H |
|
|||
|
|
|
|
|
|
|
|
|
|
|
||||||||
|
O |
C |
NH2 |
|
|
H2O |
|
|
|
|
|
|
|
|
(CH2)2 |
|
||
|
|
|
∆GOI = |
|
|
∆GOI = -17 kJ . mol-1 |
|
|
|
|
O |
C |
O |
|
||||
|
|
|
|
|
|
|
|
|
|
|
|
|
||||||
|
|
|
COO |
+14 kJ . |
|
|
|
|
|
|
|
|
|
|
HO |
P |
O |
|
|
|
|
mol-1 |
|
NH4 |
|
|
|
|
|
|
|
|
|||||
|
|
|
|
|
|
|
|
|
|
|
|
|
|
|||||
H3N |
C |
H |
|
|
|
|
|
|
|
|
|
|
|
|
||||
|
|
|
|
|
|
|
|
|
|
|
|
O |
|
|||||
|
|
(CH2)2 |
|
|
A |
|
|
A |
|
|
|
|
|
|
|
|
||
|
|
|
|
|
|
|
|
|
ADP |
|
|
|
|
|
|
|
||
|
|
|
C |
|
|
|
ATP |
P P |
P |
P P |
|
|
|
|
|
|
|
|
|
O |
|
O |
|
|
|
|
|
|
|
|
|
|
|
|
– |
|
|
|
|
|
Glu |
|
|
|
|
|
|
|
|
|
|
|
||||
|
|
|
|
|
|
|
|
|
|
|
|
|
|
|
|
|
||
1. Glutamine synthetase reaction |
|
|
|
|
|
|
|
|
|
|
|
|||||||
|
Reaction 1: |
Glutamate |
+ |
NH3 |
|
|
+14 kJ . mol–1 |
Glutamine + |
H2O |
|
|
|||||||
|
Reaction 2: |
ATP |
+ |
H2O |
|
|
– 31 kJ . mol–1 |
ADP |
|
+ |
|
P |
|
|
||||
|
Total: |
|
Glutamate + |
NH3 + ATP |
|
– 17 kJ . mol–1 |
Glutamine + |
ADP |
+ |
P |
||||||||
2. Energy balance |
|
|
|
|
|
|
|
|
|
|
|
|
|
|||||
B. Substrate level phosphorylation |
|
|
C. Glyceraldehyde 3-phosphate |
|
|
|||||||||||||
|
Chemical |
|
Phospho- |
|
dehydrogenase |
|
|
H |
|
|
||||||||
|
|
|
|
|
|
H |
|
|
|
|
||||||||
|
potential |
|
enolpyruvate |
|
Glyceraldehyde |
|
|
S |
|
|
||||||||
70 |
|
|
|
|
|
|
|
|||||||||||
|
|
|
|
|
|
|
|
|
C |
|
|
|
|
|
||||
|
|
|
|
|
|
P |
|
|
|
3-phosphate |
O |
|
|
|
|
|||
|
|
|
|
|
|
|
|
|
|
|
|
R |
|
|
|
|
|
|
60 |
1,3-bisphospho- |
|
|
|
|
|
|
|
a |
|
|
Glycer- |
|
|||||
|
|
|
|
|
|
|
|
|
aldehyde- |
|||||||||
|
glycerate |
|
|
|
|
|
|
|
|
|
|
|
3-phosphate |
|||||
|
|
|
|
P |
|
|
Succinyl- |
|
|
|
|
|
|
|
dehydro- |
|||
|
|
|
|
|
|
phosphate |
|
|
|
|
H |
|
|
genase |
|
|||
50 |
|
|
|
|
|
|
|
|
|
|
|
|
|
|||||
|
|
|
|
|
|
P |
|
|
|
|
|
|
|
|
|
|
|
|
|
|
|
|
|
|
|
|
|
Inter- |
|
R |
C |
S |
|
|
|
|
|
|
|
|
|
|
|
|
|
|
|
|
|
|
|
|
||||
|
|
|
|
|
|
|
|
|
|
mediate 1 |
|
OH |
|
|
|
|
|
|
40 |
|
|
|
|
|
|
|
|
|
|
N |
A |
|
|
|
|
|
|
|
|
|
|
|
|
|
|
|
|
|
|
|
|
|
|
|
||
|
|
|
|
P |
|
|
|
|
|
|
|
|
|
|
|
|
|
|
|
A |
|
|
|
|
|
|
|
|
|
|
|
b |
|
|
|
|
|
30 |
|
|
P |
P P |
ATP (GTP) |
|
|
|
|
|
N |
A |
|
|
|
|
|
|
|
|
|
|
|
|
|
|
|
|
|
|
|
|
|
||||
|
|
|
|
|
|
|
|
|
|
Inter- |
|
R |
C |
S |
|
|
|
|
20 |
N |
|
A |
|
|
2 |
|
CoA |
|
mediate 2 |
|
|
|
|
||||
|
|
|
|
|
|
|
|
|
|
|
||||||||
|
|
|
|
|
|
|
|
|
|
|
|
O |
|
|
|
|
|
|
|
|
|
|
1 |
|
|
3 |
|
|
Inorganic |
|
Thioester |
|
|
||||
|
|
|
|
|
|
P |
Succinyl- |
|
P |
|
|
|
||||||
|
N |
|
A |
|
|
|
phosphate |
|
|
|
|
|
|
|||||
10 |
|
|
|
|
CoA |
|
|
|
|
|
|
|
|
|||||
|
|
|
|
|
|
|
|
|
|
|
|
|
|
|
|
|||
|
|
|
|
|
|
|
|
|
|
|
|
c |
|
|
|
|
|
|
|
|
|
|
|
|
|
|
|
|
|
|
|
|
|
H |
|
|
|
|
|
|
|
|
2-Phospho- |
|
|
|
|
|
|
|
|
|
|
|
||
|
Glycer- |
|
|
|
|
|
|
|
|
|
|
S |
|
|
||||
|
aldehyde |
glycerate |
|
|
|
|
|
|
|
|
|
|
|
|
||||
|
|
|
|
|
|
|
|
|
|
|
|
|
|
|||||
|
3-phos- |
|
|
|
|
|
1,3-Bisphos- |
R |
C |
O |
P |
|
|
|
||||
|
phate |
|
|
|
|
|
|
|
|
|
||||||||
|
|
Inorganic |
|
|
|
|
phoglycerate |
|
|
|
|
|
|
|||||
|
|
|
|
P |
|
P |
|
|
O |
|
|
|
|
|
||||
|
|
|
|
|
|
|
|
|
|
|
|
|
|
|
||||
|
|
|
|
phosphate |
|
|
|
|
|
|
Mixed anhydride |
|||||||
|
|
|
|
|
|
|
|
|
|
|
|
|
||||||
|
|
|
|
|
|
|
|
|
|
|
|
|
|
|||||

126 Metabolism
Energy conservation at membranes
Metabolic energycan be stored not only in the form of “energy-rich” bonds (see p. 122), but also by separating electric charges from each other using an insulating layer to prevent them from redistributing. In the field of technology, this type of system would be called a condenser. Using the same principle, energy is also stored (“conserved”) at cell membranes. The membrane functions as an insulator; electrically charged atoms and molecules (ions) function as charges.
A. Electrochemical gradient
Although artificial lipid membranes are almost impermeable to ions, biological membranes contain ion channels that selectively allow individual ion types to pass through (see p. 222). Whether an ion can cross this type of membrane, and if so in which direction, depends on the electrochemical gra- dient—i.e., on the concentrations of the ion on each side of the membrane (the concentration gradient) and on the difference in the electrical potential between the interior and exterior, the membrane potential.
The membrane potential of resting cells (resting potential; see p. 350) is –0.05 to –0.09 V—i.e., there is an excess negative charge on the inner side of the plasma membrane. The main contributors to the resting potential are the two cations Na+ and K+, as well as Cl– and organic anions (1). Data on the concentrations of these ions outside and inside animal cells, and permeability coef - cients, are shown in the table (2).
The behavior of an ion type is described quantitatively by the Nernst equation (3). ∆ψG is the membrane potential (in volts, V) at which there is no net transport of the ion concerned across the membrane (equilibrium potential). The factor R T/F n has a value of 0.026 V for monovalent ions at 25 °C. Thus, for K+, the table (2) gives an equilibrium potentialofca. –0.09 V—i.e.,avaluemoreor less the same as that of the resting potential. By contrast,forNa+ ions, ∆ψG ismuchhigher than the resting potential, at +0.07 V. Na+ ions therefore immediately flow into the cell when Na+ channels open (see p. 350). The disequilibrium between Na+ and K+ ions is
constantly maintained by the enzyme Na+/ K+-ATPase, which consumes ATP.
B. Proton motive force
Hydronium ions (“H+ ions”) can also develop electrochemical gradients. Such a proton gradient plays a decisive part in cellular ATP synthesis (see p. 142). As usual, the energy content of the gradient depends on the concentration gradients—i.e., on the pH differencepH between the two sides of the membrane. In addition, the membrane potential ∆ψ also makes a contribution. Together, these two values give the proton motive force ∆p, a measure for the work that the H+ gradient can do. The proton gradient across the inner mitochondrial membrane thus delivers approximately 24 kJ per mol H+.
C. Energy conservation in proton gradients
Proton gradients can be built up in various ways. A very unusual type is represented by bacteriorhodopsin (1), a light-driven proton pump that various bacteria use to produce energy. As with rhodopsin in the eye, the light-sensitive component used here is covalentlybound retinal (seep. 358). In photosynthesis (see p. 130), reduced plastoquinone (QH2) transports protons, as well as electrons, through the membrane (Q cycle, 2). The formation of the proton gradient by the respiratory chain is also coupled to redox processes (see p. 140). IncomplexIII,aQcycleisresponsible for proton translocation (not shown). In cytochrome c oxidase (complexIV, 3),H+ transport is coupled to electron flow from cytochrome c to O2.
In each of these cases, the H+ gradient is utilized by an ATP synthase (4) to form ATP. ATP synthases consist of two components—a proton channel (F0) and an inwardly directed protein complex (F1), which conserves the energy of back-flowing protons through ATP synthesis (see p. 142).
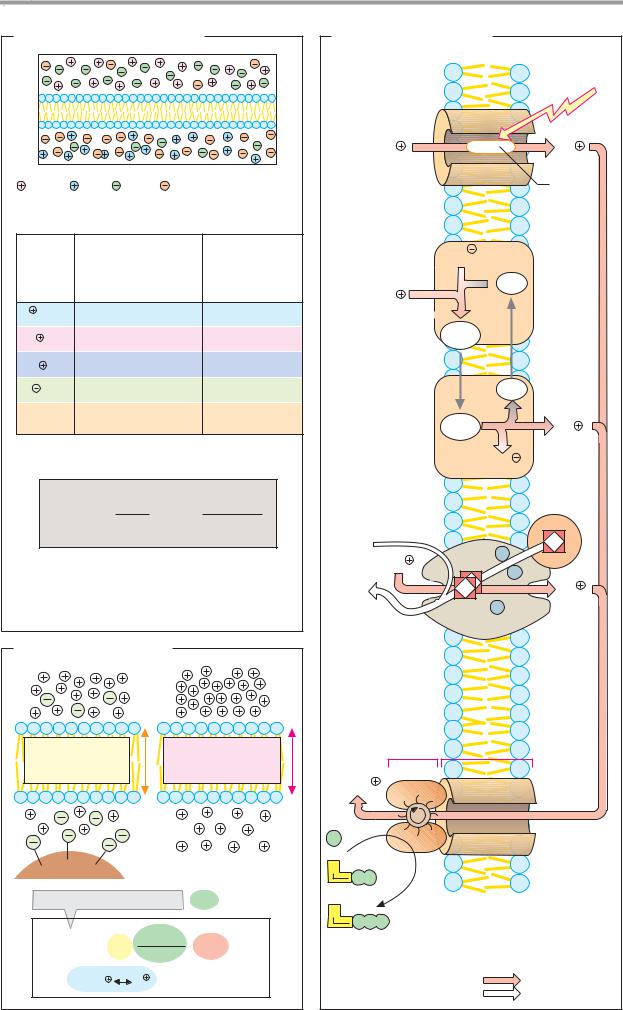
|
|
|
|
|
|
|
|
|
Energy Metabolism |
127 |
||
A. Electrochemical gradient |
|
C. Energy conservation |
|
|
||||||||
|
|
|
|
|
|
|
in proton gradients |
|
|
|||
|
|
|
|
|
|
|
Inside |
|
|
Outside |
||
|
|
|
|
|
|
|
|
2H |
|
|
2H |
|
|
|
|
|
|
|
|
1. Light-driven |
|
Retinal |
|||
Na |
K |
|
Cl |
|
Organic anions |
proton pump |
|
|||||
1. Cause |
|
|
|
|
|
|
(bacterio- |
|
|
|
||
|
|
|
|
|
|
rhodopsin) |
|
|
|
|||
|
|
|
|
|
|
|
|
|
|
|||
Ion |
Concentrations |
Permeability |
|
|
|
2e |
PS II |
|
||||
|
Cyto- |
Extracelluar |
coefficient |
|
|
|
|
|||||
|
|
|
|
|
|
|
||||||
|
plasm |
space |
(cm · s–1 · 109) |
|
|
|
|
Q |
|
|||
|
(mM) |
|
(mM) |
|
2H |
|
|
|
||||
|
|
|
|
|
|
|
||||||
|
|
|
|
|
|
|
|
|
|
|
|
|
K |
100 |
|
|
5 |
500 |
2. Q cycle |
|
|
|
|
||
Na |
15 |
|
|
150 |
5 |
|
QH2 |
|
|
|||
|
|
(plasto- |
|
|
|
|||||||
|
|
|
|
|
|
|||||||
Ca2 |
0.0002 |
|
2 |
|
quinone |
|
|
|
||||
|
|
cycle |
|
|
|
|
||||||
Cl |
13 |
|
|
150 |
10 |
in plants) |
|
Q |
|
|||
|
|
|
|
|
|
|
||||||
Organic |
138 |
|
|
34 |
0 |
|
|
|
|
|
|
|
anions |
|
|
|
|
|
QH2 |
2H |
|
||||
|
|
|
|
|
|
|
|
|
|
|||
|
|
|
|
|
|
|
|
|
|
|
||
2. Concentrations |
|
|
|
|
|
|
b/f- |
2e |
|
|||
|
|
|
|
|
|
|
|
|
|
complex |
|
|
|
|
|
R · T |
C outside |
|
|
|
|
Cyto- |
|
||
∆ΨG = |
|
|
|
|
|
chrome C |
|
|||||
|
· ln |
|
|
|
|
|
|
|||||
|
|
|
F · n |
C inside |
|
|
|
|
|
|
||
|
|
|
|
|
|
|
O2 |
|
|
|
Fe |
|
R = gas constant |
|
n = Ion charge |
8H |
CuA |
|
|||||||
|
|
|
|
|
||||||||
T = temperature (K) |
|
F = Faraday constant |
2 H2O |
|
|
Fe |
4H |
|
||||
|
|
|
|
|
|
|
|
|
|
|||
|
|
|
|
|
|
|
|
|
|
|
|
|
3. Nernst equation |
|
|
|
|
|
|
CuB |
|
||||
|
|
|
|
|
|
|
3. Electron- |
|
||||
B. Proton motive force |
|
|
Heme/a3 |
|
||||||||
|
driven |
|
|
|
|
|||||||
|
|
|
|
|
|
|
proton |
|
|
|
|
|
|
|
|
|
|
|
|
pump |
|
|
|
|
|
|
|
|
|
|
|
|
(cyto- |
|
|
|
|
|
|
|
|
|
|
|
|
chrome C |
|
|
|
||
|
|
|
|
|
|
|
oxidase) |
|
|
|
||
Membrane |
|
|
pH gradient |
|
|
F1 |
F0 |
|
|
|||
potential |
|
|
|
∆pH = pHa - pHi |
|
|
|
|
|
|
||
∆ψ = |
ψa - ψ i |
|
|
(in pH units) |
nH |
|
|
|
|
|||
|
|
|
|
|
|
|
|
|
|
|
||
|
|
|
|
|
|
|
P |
|
|
|
|
|
Protein |
|
|
|
|
|
A |
|
|
|
|
|
|
|
|
|
|
|
P |
P |
|
|
|
|
||
|
|
|
|
|
|
|
|
|
|
|
||
Proton motive force |
≈ 0.06 V |
A |
|
|
|
|
|
|||||
|
|
|
|
|
|
|
|
ATP |
|
|
|
|
|
|
|
|
|
|
|
P |
P P |
|
|
|
|
|
∆p = ∆ψ -2.3 · R · T · ∆pH |
|
|
|
|
|
|
|||||
|
|
|
|
|
F |
|
4. Proton- |
|
|
|
||
|
∆GH |
a |
H |
i |
= -F · ∆p |
|
driven ATP |
|
Proton flow |
|
||
|
|
|
|
|
synthesis |
|
Electron flow |
|||||

128 Metabolism
Photosynthesis: light reactions
Sunlight is the most important source of energy for nearly all living organisms. With the help of photosynthesis, light energy is used to produce organic substances from CO2 and water. This property of phototrophic organisms (plants, algae, and some bacteria) is exploited by heterotrophic organisms (e.g., animals), which are dependent on a supply of organic substances in their diet (see p. 112). The atmospheric oxygen that is vital to higher organisms is also derived from photosynthesis.
A. Photosynthesis: overview
The chemical balance of photosynthesis is simple. Six molecules of CO2 are used to form one hexose molecule (right). The hydrogen required for this reduction process is taken from water, and molecular oxygen is formed as a by-product (left). Light energy is required, since water is a very poor reducing agent and is therefore not capable of reducing
CO2.
In the light-dependent part of photosyn- thesis—the “light reactions ”—H2O molecules are split into protons, electrons, and oxygen atoms. The electrons undergo excitation by light energy and are raised to an energy level that is high enough to reduce NADP+. The NADPH+H+ formed in this way, in contrast to H2O, is capable of “fixing” CO2 reductive- ly—i.e., of incorporating it into organic bonds. Another product of the light reactions is ATP, which is also required for CO2 fixation. If NADPH+H+, ATP, and the appropriate enzymes are available, CO2 fixation can also take place in darkness. This process is therefore known as the “dark reaction.”
The excitation of electrons to form NADPH is a complex photochemical process that involves chlorophyll, a tetrapyrrole dye containing Mg2+ that bears an extra phytol residue (see p. 132).
B. Light reactions
In green algae and higher plants, photosynthesis occurs in chloroplasts. These are organelles, which—like mitochondria—are surrounded by two membranes and contain their own DNA. In their interior, the stroma, thyla-
koids or flattened membrane sacs are stacked on top of each other to form grana. The inside of the thylakoid is referred to as the lumen. The light reactions are catalyzed by enzymes located in the thylakoid membrane, whereas the dark reactions take place in the stroma.
As in the respiratory chain (see p. 140), the light reactions cause electrons to pass from one redox system to the next in an electron transport chain. However, the direction of transport is opposite to that found in the respiratory chain. In the respiratory chain, electrons flow from NADH+H+ to O2, with the production of water and energy.
In photosynthesis, electrons are taken up from water and transferred to NADP+, with an expenditure of energy. Photosynthetic electron transport is therefore energetically “uphill work.” To make this possible, the transport is stimulated at two points by the absorption of light energy. This occurs through two pho- tosystems—protein complexes that contain large numbers of chlorophyll molecules and other pigments (see p. 132). Another component of the transport chain is the cytochrome b/f complex, an aggregate of integral membrane proteins that includes two cytochromes (b563 and f). Plastoquinone, which is comparable to ubiquinone, and two soluble proteins, the coppercontaining plastocyanin and ferredoxin, function as mobile electron carriers. At the end of the chain, there is an enzyme that transfers the electrons to NADP+.
Because photosystem II and the cytochrome b/f complex release protons from reduced plastoquinone into the lumen (via a Q cycle), photosynthetic electron transport establishes an electrochemical gradient across the thylakoid membrane (see p. 126), which is used for ATP synthesis by an ATP synthase. ATP and NADPH+H+, which are both needed for the dark reactions, are formed in the stroma.
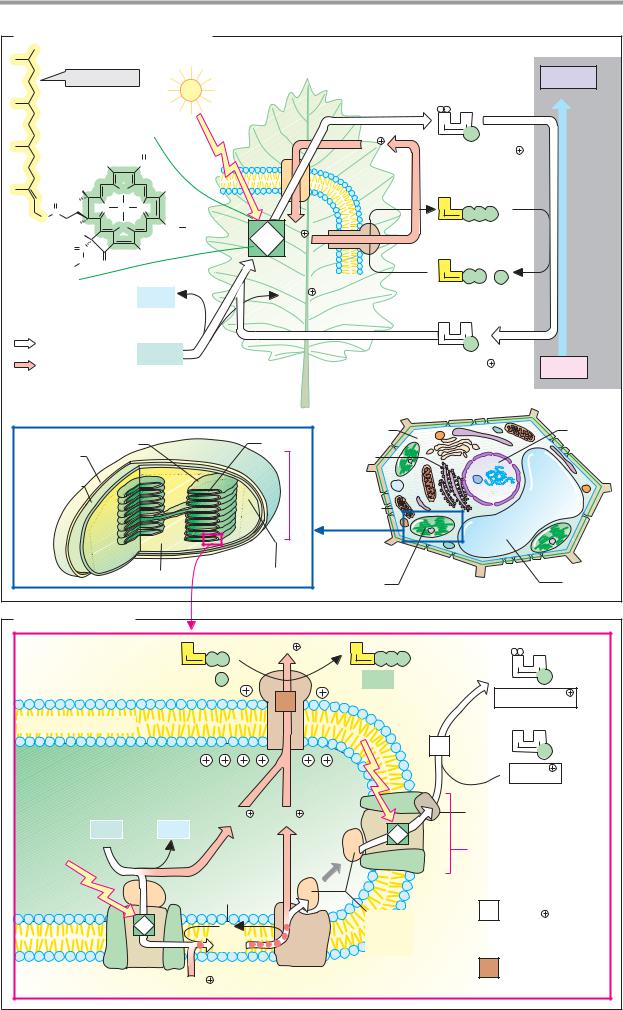
|
|
|
|
|
|
|
|
|
|
|
Energy Metabolism |
129 |
||||
A. Photosynthesis: overview |
|
|
|
|
|
|
|
|
|
|
||||||
|
Phytol residue |
|
|
|
|
|
|
|
|
|
|
Hexose |
||||
|
|
|
|
|
|
|
|
|
|
|
N |
A |
|
|
|
|
|
|
|
|
|
|
|
|
|
H |
|
|
P |
|
|
|
|
|
|
|
|
|
CH2 |
|
|
|
|
12 NADPH + H |
|
|
||||
|
|
|
|
|
|
|
|
|
|
|
|
|||||
|
|
|
H3C |
|
CH |
|
|
|
|
|
|
|
|
|
|
|
O |
H |
|
N |
CH3 |
|
|
|
|
|
|
|
|
|
|
|
|
H3C |
|
N |
Mg |
N |
|
|
|
|
|
A |
|
|
|
|
|
|
C |
|
|
|
|
|
|
|
|
P |
P |
P |
|
|
|||
|
|
|
|
|
|
|
|
|
|
|
|
“Dark |
||||
O |
H |
|
|
N |
|
|
|
|
|
|
|
|
|
|
|
|
|
|
|
CH2 |
CH3 |
|
|
|
|
18 ATP |
|
|
|
||||
|
H |
|
|
Mg2+ |
H |
|
|
|
|
|
reactions” |
|||||
|
|
|
|
|
|
|
|
|
|
|||||||
|
O |
C |
|
|
CH3 |
|
|
|
|
|
|
|
|
|
|
(Calvin |
|
|
O |
|
|
|
|
|
|
|
|
|
|
|
|
cycle) |
|
|
H3C |
O |
|
|
|
|
|
|
|
A |
|
|
|
|
||
|
|
|
|
|
|
|
|
|
|
|
|
|
|
|||
|
|
|
|
|
|
|
|
|
|
|
P |
P |
P |
|
|
|
|
|
|
|
|
|
|
|
|
|
|
|
|
|
|||
Chlorophyll a |
|
3 O2 |
|
12 H |
|
|
18 ADP + Pi |
|
|
|||||||
|
|
|
|
|
|
|
|
|
|
|
N |
A |
|
|
|
|
Electron flow |
|
6 H2O |
|
|
|
|
|
|
P |
|
|
|
|
|||
Proton flow |
|
|
|
|
|
|
12 NADP |
|
6 CO2 |
|||||||
|
|
|
|
|
|
|
|
|||||||||
Outer |
|
Thylakoid |
|
|
Lumen |
Cytoplasm |
|
|
|
|
|
|
Nucleus |
|||
|
|
|
|
|
|
|
|
|
|
|
||||||
membrane |
|
|
|
|
|
|
|
|
|
|
|
|
|
|
|
|
Inner |
|
|
|
|
|
|
|
|
|
|
|
|
|
|
|
|
membrane |
|
|
|
|
|
|
m |
Plasma |
|
|
|
|
|
|
|
|
|
|
|
|
|
|
|
|
|
|
|
|
|
|
|
||
|
|
|
|
|
|
|
|
1 |
membrane |
|
|
|
|
|
|
|
|
|
|
|
|
|
|
|
|
|
|
|
|
|
|
|
|
|
|
|
|
Stroma |
|
Granum |
|
Chloroplast |
|
|
|
|
|
|
Vacuole |
|
B. Light reactions |
|
|
|
|
|
|
|
|
|
|
|
|
||||
|
|
|
|
|
|
A |
nH |
A |
|
|
|
|
|
|
|
|
|
|
|
|
|
|
P |
P |
|
P |
P |
P |
|
|
N |
A |
|
Stroma |
|
|
|
|
|
P |
|
ATP |
|
|
|
|
|
P |
|
|
|
|
|
|
|
|
|
|
|
|
|
|
|
|
|
||
|
|
|
|
|
|
|
|
2 |
|
|
|
|
|
NADPH + H |
||
Thylakoid membrane
1 |
N A |
|
P |
||
Lumen |
||
NADP |
||
|
|
2 H |
2 H |
Ferredoxin (Fd) |
H2O |
|
||
[O] |
|
Mg2+ |
Light |
Photosystem I |
|
|
Plasto- |
|
|
|
|
|
quinone |
|
1 |
Ferredoxin- |
|
|
|
|
||
|
|
|
Plasto- |
NADP - |
|
Mg2+ |
|
Q |
|
||
|
|
cyanin |
|
reductase |
|
|
|
QH2 |
(PC) |
|
1.18.1.2 |
|
|
|
|
2 |
ATP synthase |
Photosystem II |
2 H |
Cytochrome b/f complex |
|
|
3.6.1.34 |
|
|
|

130 Metabolism
Photosynthesis: dark reactions
The “light reactions” in photosynthesis bring about two strongly endergonic reactions—the reduction of NADP+ to NADPH+H+ and ATP synthesis (see p. 122). The chemical energy needed for this is produced from radiant energy by two photosystems.
A. Photosystem II
The photosynthetic electron transport chain in plants starts in photosystem II (PS II; see p. 128). PS II consists of numerous protein subunits (brown) that contain bound pig- ments—i.e., dye molecules that are involved in the absorption and transfer of light energy.
The schematic overview of PS II presented here (1) only shows the important pigments. These include a special chlorophyll molecule, the reaction center P680; a neighboring Mg2+ free chlorophyll (pheophytin); and two bound plastoquinones (QA and QB). A third quinone (QP) is not linked to PS II, but belongs to the plastoquinone pool. The white arrows indicate the direction of electron flow from water to QP. Only about 1% of the chlorophyll molecules in PS II are directly involved in photochemical excitation (see p. 128). Most of them are found, along with other pigments, in what are known as light-harvesting or antenna complexes (green). The energy of light quanta striking these can be passed on to the reaction center, where it can be utilized.
In Fig. 2, photosynthetic electron transport in PS II is separated into the individual steps involved. Light energy from the light-harvest- ing complexes (a) raises an electron of the chlorophyll in the reaction center to an excited “singlet state.” The excited electron is immediately passed on to the neighboring pheophytin. This leaves behind an “electron gap” in the reaction center—i.e., a positively charged P680 radical (b). This gap is now filled by an electron removed from an H2O molecule by the water-splitting enzyme (b). The excited electron passes on from the pheophytin via QA to QB, converting the latter into a semiquinone radical (c). QB is then reduced to hydroquinone by a second excited electron, and is then exchanged for an oxidized quinone (QP) from the plastoquinone pool. Further transport of electrons from the plasto-
quinone pool takes place as described on the preceding page and shown in B.
B. Redox series
It can be seen from the normal potentials E0 (see p. 18) of the most important redox systems involved in the light reactions why two excitation processes are needed in order to transfer electrons from H2O to NADP+. After excitation in PS II, E0 rises from around –1 V back to positive values in plastocyanin (PC)—i.e., the energy of the electrons has to be increased again in PS I. If there is no NADP+ available, photosynthetic electron transport can still be used for ATP synthesis. During cyclic photophosphorylation, electrons return from ferredoxin (Fd) via the plastoquinone pool to the b/f complex. This type of electron transport does not produce any NADPH, but does lead to the formation of an H+ gradient and thus to ATP synthesis.
C. Calvin cycle
The synthesis of hexoses from CO2 is only shown in a very simplified form here; a complete reaction scheme is given on p. 407. The actual CO2 fixation—i.e., the incorporation of CO2 into an organic compound—is catalyzed by ribulose bisphosphate carboxylase/oxygenase (“rubisco”). Rubisco, the most abundant enzyme on Earth, converts ribulose 1,5-bis- phosphate, CO2 and water into two molecules of 3-phosphoglycerate. These are then converted, via 1,3-bisphosphoglycerate and 3-phosphoglycerate, into glyceraldehyde 3-phosphate (glyceral 3-phosphate). In this way,12 glyceraldehyde 3-phosphates are synthesized from six CO2. Two molecules of this intermediate are used by gluconeogenesis reactions to synthesize glucose 6-phosphate (bottom right). From the remaining 10 molecules, six molecules of ribulose 1,5-bisphos- phate are regenerated, and the cycle then starts over again. In the Calvin cycle, ATP is required for phosphorylation of 3-phospho- glycerate and ribulose 5-phosphate. NADPH+H+, the second product of the light reaction, is consumed in the reduction of 1,3- bisphosphoglycerate to glyceraldehyde 3- phosphate.

Energy Metabolism |
131 |
A. Photosystem II |
|
|
|
B. Redox series |
|
|
|
|
|
|
|
Bound |
|
Exchangeable |
Plasto- |
|
|
|
EOl (V) |
|
|
|
|
|
Photo- |
|
|
|
|
|
|||||||||
|
|
|
|
|
|
|
-1.2 |
|
|
|
|
|
|
|
|
|
chemical |
|
|
|
|
||||||||||
|
|
|
|
quinone |
quinone |
quinone |
|
|
|
|
|
|
|
|
|
|
|
|
|
|
|
||||||||||
|
|
|
|
|
|
|
|
|
|
|
|
|
|
|
excitation |
|
|
Q |
|
||||||||||||
|
|
|
|
|
|
|
|
|
|
|
|
|
|
|
|
|
|
|
|
|
|
|
|
|
|
||||||
|
|
|
|
|
|
|
|
|
|
|
|
|
-1.0 |
|
|
|
|
|
|
|
|
|
|
|
|
|
|
|
|
|
|
|
|
|
|
|
|
|
|
|
|
|
|
|
|
|
|
|
|
|
|
|
|
|
|
|
|
|
|
|
|
|
|
|
|
|
|
|
|
|
Fe |
|
|
|
|
-0.8 |
|
|
|
|
|
|
Ph |
|
|
|
|
|
|
|
|
|
Fe/S |
|
|
Mg2+ |
Mg2+ |
Mg2+ |
|
|
|
|
|
|
|
|
|
|
|
|
|
|
|
|
|
|
|
|
|
|
|
|
|||||
QA |
|
QB |
QP |
|
|
|
|
|
|
|
|
|
|
|
|
|
|
|
|
|
|
|
|
||||||||
Mg |
2+ |
Mg |
2+ |
2+ |
|
|
|
-0.6 |
|
|
|
|
|
|
QA |
|
|
|
|
|
|
|
|
Fd |
|
||||||
|
|
Mg |
|
|
|
|
|
|
|
|
|
|
|
|
|
|
|
|
|
|
|
|
|
|
|
|
|
|
|
||
|
|
|
|
|
|
|
|
|
|
|
|
|
-0.4 |
|
|
|
|
|
|
|
|
QB |
|
|
|
|
H |
|
|
||
|
|
|
|
|
|
|
|
|
|
|
|
|
-0.2 |
|
|
|
|
|
|
|
|
|
|
|
QP |
|
|
|
|
N |
A |
|
|
|
|
|
|
|
|
|
|
|
|
|
|
|
|
|
|
|
|
|
|
|
|
b/f |
|
|
|
P |
|||
Light- |
|
|
|
|
|
|
Reaction |
|
|
0 |
|
|
|
|
|
|
|
|
|
|
|
|
|
|
NADP |
||||||
|
|
|
|
|
|
|
|
|
|
|
|
|
|
|
|
|
|
|
|
|
|
|
|
||||||||
harvesting |
|
|
|
Mg2+ center |
|
|
|
|
|
|
|
|
|
|
|
|
|
|
|
|
PC |
|
|
||||||||
complex |
|
|
|
|
(P680) |
|
|
+0.2 |
|
|
|
|
|
|
|
|
|
|
|
|
|
PS I |
|
|
|||||||
|
|
|
|
Pheophytin |
|
|
|
|
|
|
|
|
|
|
|
|
|
|
|
|
|
|
|
|
|
||||||
|
|
|
|
|
|
|
|
|
+0.4 |
|
|
|
|
|
|
|
|
PS II |
|
(P700) |
|
|
|||||||||
|
|
|
|
|
|
|
|
|
|
|
|
|
|
|
|
|
|
|
|
|
|
|
|
||||||||
|
|
|
|
|
|
|
|
|
|
|
|
|
+0.6 |
|
|
|
|
|
|
|
|
(P680) |
|
|
|
|
|
|
|||
Water- |
|
|
|
|
|
|
|
|
|
|
+0.8 |
|
|
|
|
|
|
|
|
|
|
|
|
|
|
|
Cyclic |
|
|||
|
|
|
|
4 Mn2+ |
|
|
|
|
|
|
|
|
|
|
|
|
|
|
|
|
|
|
|
photophos- |
|
||||||
splitting |
|
|
|
|
|
|
|
|
|
|
|
|
|
|
|
|
|
H |
O |
|
|
|
|
||||||||
enzyme |
|
H2O |
4 ions |
2 H 1/2 O2 |
|
|
|
|
|
|
|
|
|
|
|
|
|
2 |
|
|
|
|
phorylation |
|
|||||||
|
|
|
|
|
|
|
|
|
|
|
|
|
|
|
|
|
|
|
|
|
|
||||||||||
1. |
|
|
|
|
|
|
|
|
|
|
|
|
|
|
|
|
|
|
|
|
|
|
|
|
|
|
|
|
|
|
|
|
|
|
|
a |
|
|
|
|
b |
|
|
|
c |
|
|
|
|
|
|
|
|
|
d |
|
|
|
|
|
Plasto- |
||
|
|
|
|
|
|
|
|
|
|
|
|
|
|
|
|
|
|
|
|
|
|
|
|
|
quinone |
||||||
|
|
|
|
|
|
|
|
|
|
|
|
|
|
|
|
|
|
|
|
|
|
|
|
|
OH |
|
|
|
|
(ox.) |
|
|
|
|
|
|
|
|
|
|
|
|
|
|
|
|
|
|
|
|
|
|
|
|
|
|
OH |
|
|
|
|
|
|
|
|
|
|
Mg2+ |
|
|
|
Mg |
|
|
|
Mg2+ |
|
|
|
|
|
|
|
|
|
|
|
Mg2+ |
|
|
|
|
|
|
|
|
|
|
|
|
|
|
|
|
|
|
|
|
|
|
|
|
|
|
|
|
|
|
|
|
|
|
|
Exchange |
|
||
2. |
|
|
|
|
|
|
H2O |
|
|
|
|
|
|
|
|
|
|
|
|
|
|
|
|
|
|
|
|
QB (red) |
QP(ox) |
||
|
|
|
|
|
|
|
|
|
|
|
|
|
|
|
|
|
|
|
|
|
|
|
|
|
|
|
|
|
|
||
|
|
|
|
|
|
|
|
|
|
|
|
|
|
|
|
|
|
|
|
|
|
|
|
|
|
|
|
|
|
|
|
C. Calvin cycle |
|
|
|
|
|
|
|
|
|
|
|
|
|
|
|
|
|
|
|
|
|
|
|
|
|
|
|||||
|
|
|
|
|
H |
H |
O |
O |
P |
|
|
|
6 ADP |
A |
|
P |
P |
|
|
|
|
|
A |
P |
P |
P |
6 ATP |
|
|
||
|
|
|
|
|
|
|
|
|
|
|
|
|
|
|
|
|
|
|
|
|
|
|
|
|
|
|
|||||
|
|
|
H2C |
C |
C |
C |
CH2 |
|
|
|
|
|
|
|
|
|
|
4 |
|
|
|
|
|
|
|
|
|
|
|
||
|
|
|
|
O |
OH OH |
|
|
|
|
|
|
|
|
|
|
|
|
|
|
|
|
|
|
|
|
|
|
|
|||
|
|
P |
|
|
|
|
|
|
|
|
|
|
|
|
|
|
|
|
|
|
|
|
|
|
|
|
|
||||
|
|
|
|
|
|
|
|
|
|
6 CO2 |
|
|
|
|
|
|
- |
|
|
|
6 |
|
|
|
|
|
|
|
|
||
|
|
|
|
|
|
|
|
|
|
|
|
|
|
|
|
|
|
|
|
5 |
|
|
|
|
|
|
|
||||
|
|
|
|
|
|
|
|
|
|
|
|
|
|
|
|
5 |
|
|
|
|
|
|
|
|
|
|
|
||||
|
|
|
|
H2O |
|
O |
C |
O |
|
|
|
|
|
. |
|
|
|
|
|
|
- |
|
|
|
|
|
|
|
|||
|
|
|
|
|
|
|
|
|
|
1 |
|
|
|
|
|
|
|
|
|
|
|
|
|
|
|||||||
CO2, Mg2 |
|
1 |
CO2 |
|
|
|
|
|
|
|
|
|
|
|
|
|
|
|
Ribulose |
|
|
|
|
|
|||||||
|
|
|
|
|
Ribulose |
|
|
|
|
|
Light |
|
|
phosphate |
|
|
|
|
|||||||||||||
|
|
|
|
|
|
|
|
|
|
|
|
|
|
|
|
|
|
|
|
|
|
|
|
||||||||
|
|
|
|
|
|
|
|
|
|
|
1 |
|
|
|
|
|
|
|
|
|
|
|
|
|
|
||||||
|
|
|
|
|
|
|
|
|
|
6 H2O |
|
6 |
bisphosphate |
|
|
|
|
|
|
|
|
|
|
|
4 P |
|
|||||
|
|
|
|
|
|
|
|
|
|
|
|
|
|
|
|
|
|
|
|
|
|
|
|
|
|
|
|
|
|
||
|
|
|
|
|
O |
|
O |
OH O |
P |
|
|
12 3 |
|
|
|
|
|
|
|
|
|
Light |
|
|
|
|
|||||
|
|
|
|
|
|
|
|
|
|
|
|
|
|
|
|
|
|
|
|
|
|
||||||||||
|
|
|
|
|
|
|
|
|
|
|
|
|
- |
|
|
|
|
|
|
|
|
|
|
|
|
|
|
|
|
|
|
H2C |
|
C |
C |
|
C |
C |
CH2 |
|
|
|
|
Phospho |
|
Light |
|
|
|
|
|
|
|
|
|
|
|
||||||
|
|
|
|
|
|
|
|
|
|
|
|
|
|
|
|
|
|
|
|
|
|
|
|
|
|
||||||
|
|
|
|
|
|
|
|
|
|
|
|
|
|
|
|
|
|
|
|
|
|
|
|
|
|
|
|
||||
P |
|
O |
OH |
O |
|
O |
|
|
|
|
|
glycerate |
|
|
- |
|
|
|
|
Glyceralphosphate |
|
|
|
|
|||||||
|
|
|
|
|
|
|
|
|
|
|
|
|
|
|
|
|
|
|
|
||||||||||||
|
|
|
|
|
|
|
|
|
|
|
|
|
|
|
|
|
|
|
|
|
|
|
|
- |
|
|
|
|
|
|
|
|
|
|
|
|
|
|
|
|
|
|
|
|
|
|
|
|
|
|
|
|
10 |
|
3 |
|
|
|
|
|
|
|
|
|
|
|
|
|
|
|
|
|
|
|
|
|
|
|
|
|
|
|
|
|
|
|
|
|
|
|
|
|
|
||
1 |
Ribulose-bisphosphate |
|
|
|
|
|
|
2 |
|
|
|
|
12 P |
|
|
|
|
|
|
|
|
||||||||||
|
|
carboxylase 4.1.1.39 |
|
|
|
|
|
|
|
|
|
|
3 |
|
|
|
|
|
|
|
|
|
|
|
|||||||
2 |
Phosphoglycerate kinase |
|
A |
P |
P |
P |
|
|
|
|
|
|
|
|
|
|
|
|
|
|
|
Glucose |
|
||||||||
|
|
|
|
|
|
|
|
|
|
|
|
|
|
|
|
|
|
|
|||||||||||||
|
|
|
|
|
|
|
|
|
|
|
|
|
|
|
|
|
|
|
|
|
6-phosphate |
||||||||||
|
|
2.7.2.3 |
|
|
|
|
|
12 ATP |
A |
|
|
|
|
|
|
|
|
|
|
|
|
|
|
|
|
|
|
||||
|
|
|
|
|
|
|
|
|
|
|
|
|
|
|
|
|
|
|
|
|
|
|
|
|
|
|
|
||||
3 |
Glyceraldehyde 3-phosphate |
|
|
|
|
P |
P |
|
|
|
|
|
|
|
|
|
|
|
|
|
|
|
|
|
|||||||
|
|
|
|
12 ADP |
|
|
N |
A |
|
|
|
|
|
|
|
|
|
|
Gluco- |
|
|||||||||||
|
|
dehydrogenase (NADP |
) 1.2.1.13 |
|
|
|
|
|
|
|
|
N |
|
|
A |
|
|
|
|
|
|
||||||||||
|
|
|
|
|
|
|
|
|
|
|
|
|
|
|
|
|
|
|
P |
|
|
|
|
|
|
|
neogenesis |
|
|||
|
|
|
|
|
|
|
|
|
|
|
|
|
|
|
|
|
|
|
|
|
|
|
P |
|
|
|
|
|
|||
4 |
Phosphoribulokinase 2.7.1.19 |
|
|
|
|
12 NADPH |
|
|
|
|
|
|
|
|
|
|
|
||||||||||||||
|
|
|
|
12 NADP |
|
|
Glyceraldehyde P |
|
|||||||||||||||||||||||
|
|
|
|
|
|
|
|
|
|
|
|
|
|
|
|
|
|
|
|
|
|
|
|||||||||
|
|
|
|
|
|
|
|
|
|
|
|
|
|
|
|
|
|
|
|
|
|
|
|
|
|
2 |
|
||||
|
|
|
|
|
|
|
|
|
|
|
|
|
|
|
|
|
|
|
|
|
|
|
|
|
|
|
|
3-phosphate |
|
||
132 Metabolism
Molecular models: membrane proteins
The plates show, in simplified form, the structures of cytochrome c oxidase (A; complex IV of the respiratory chain) and of photosystem I of a cyanobacterium (B). These two molecules are among the few integral membrane proteins for which the structure is known in detail. Both structures were determined by X- ray crystallography.
A. Cytochrome c oxidase
The enzyme cytochrome c oxidase (“COX,” EC 1.9.3.1) catalyzes the final step of the respiratorychain. It receives electrons from the small heme protein cytochrome c and transfers them to molecular oxygen, which is thereby reduced to water (see p. 140). At the same time, 2–4 protons per water molecule formed are pumped from the matrix into the intermembrane space.
Mammalian COX (the illustration shows the enzyme from bovine heart) is a dimer that has two identical subunits with masses of 204 kDa each. Only one subunit is shown in detail here; the other is indicated by gray lines. Each subunit consists of 13 different polypeptides, which all span the inner mitochondrial membrane. Only polypeptides I (light blue) and II (dark blue) and the linked cofactors are involved in electron transport. The other chains, which are differently expressed in the different organs, probably have regulatory functions. The two heme groups, heme a (orange) and heme a1 (red) are bound in polypeptide 1. The copper center CuA consists of two copper ions (green), which are coordinated by amino acid residues in polypeptide II. The second copper (CuB) is located in polypeptide I near heme a3.
To reduce an O2 molecule to two molecules of H2O, a total of four electrons are needed, whichare supplied bycytochrome c (pink, top left) and initially given off to CuA. From there, they are passed on via heme a and heme a3 to the enzyme’s reaction center, which is located between heme a3 and CuB. The reduction of the oxygen takes place in several steps, without any intermediate being released. The four protons needed to produce water and the H+ ions pumped into the intermembrane space
are taken up by two channels (D and K, not shown). The mechanism that links proton transport to electron transfer is still being investigated.
B. Reaction center of Synechococcus elongatus
Photosystem I (PS I) in the cyanobacterium
Synechococcus elongatus is the first system of this type for which the structure has been solved in atomic detail. Although the bacterial photosystem differs slightly from the systems in higher plants, the structure provides valuable hints about the course of the light reactions in photosynthesis (see p. 128). The functioning of the photosystem is discussed in greater detail on p. 130.
The functional form of PS I in S.elongatus consists of a trimer with a mass of more than 106 Da that is integrated into the membrane. Only one of the three subunits is shown here. This consists of 12 different polypeptides (gray-blue), 96 chlorophyll molecules (green), 22 carotenoids (orange), several phylloquinones (yellow), and other components. Most of the chlorophyll molecules are so-called antenna pigments. These collect light energy and conduct it to the reaction center, which is located in the center of the structure and therefore not visible. In the reaction center, an electron is excited and transferred via various intermediate steps to a ferredoxin molecule (see p. 128). The chlorophylls (see formula) are heme-like pigments with a highly modified tetrapyrrole ring, a central Mg2+ ion, and an apolar phytol side chain. Shown here is chlorophyll a, which is also found in the reaction center of the S.elongatus photosystem.
The yellow and orange-colored carot- enoids—e.g., Ε-carotene (see formula)—are auxiliary pigments that serve to protect the chloroplasts from oxidative damage. Dangerous radicals can be produced during the light reaction—particularly singlet oxygen. Carotenoids prevent compounds of this type from arising, or render them inactive. Carotenoids are also responsible for the coloring of leaves seen during fall. They are left behind when plants break down chlorophyll in order to recover the nitrogen it contains.

Energy Metabolism |
133 |
A. Cytochrome C oxidase
Outer mitochondrial membrane
Cytochrome C |
Intermembrane space |
|
Cu A |
||
|
Cu B
|
|
Heme a3 |
|
|||
Inner |
Matrix |
Heme a |
|
|
|
|
mitochondrial |
|
|
|
|
|
|
membrane |
|
|
|
|
|
|
B. Photosystem I |
|
|
|
|
|
|
|
O |
|
|
|
|
|
|
H3C |
|
|
|
|
|
|
H3C |
|
|
|
|
|
|
O |
|
|
|
|
|
|
|
O |
H3C |
H |
CH3 |
|
|
Plastoquinone |
|
|
|
|
|
|
C |
|
|
|
CH |
|
|
O |
H |
|
|
||
|
N |
N |
|
|||
|
|
|
CH2 |
|||
|
|
H3CO |
H |
|||
|
|
|
Mg2+ |
|
||
|
|
C |
|
|
||
|
|
|
N |
N |
|
|
|
|
|
|
|
||
|
|
O O |
|
|
CH3 |
|
|
|
|
|
CH3 |
|
CH3 |
|
|
|
|
|
|
|
|
|
|
Chlorophyll |
|
||
β-carotene |
|
|
|
|
|
|
Thylakoid membrane |
|
|
|
|
|
|

134 Metabolism
Oxoacid dehydrogenases
The intermediary metabolism has multienzyme complexes which, in a complex reaction, catalyze the oxidative decarboxylation of 2- oxoacids and the transfer to coenzyme A of the acyl residue produced. NAD+ acts as the electron acceptor. In addition, thiamine diphosphate, lipoamide, and FAD are also involved in the reaction. The oxoacid dehydrogenases include a) the pyruvate dehydrogenase complex (PDH, pyruvate acetyl CoA), b) the 2-oxoglutarate dehydrogenase complex of the tricarboxylic acid cycle (ODH, 2-oxoglutarate succinyl CoA), and c) the branched chain dehydrogenase complex, which is involved in the catabolism of valine, leucine, and isoleucine (see p. 414).
A. Pyruvate dehydrogenase: reactions
The pyruvate dehydrogenase reaction takes place in the mitochondrial matrix (see p. 210). Three different enzymes [E1–E3] form the PDH multienzyme complex (see B).
[1]Initially, pyruvate dehydrogenase [E1] catalyzes the decarboxylation of pyruvate and the transfer of the resulting hydroxyethyl residue to thiamine diphosphate (TPP,1a). The same enzyme then catalyzes oxidation of the TPP-bound hydroxyethyl group to yield an acetyl residue. This residue and the reducing equivalents obtained are then transferred to lipoamide (1b).
[2]The second enzyme, dihydrolipoamide acetyltransferase [E2], shifts the acetyl residue from lipoamide to coenzyme A (2), with dihydrolipoamide being left over.
[3]The third enzyme, dihydrolipoamide dehydrogenase [E3], reoxidizes dihydrolipoamide, with NADH+H+ being formed. The electrons are first taken over by enzymebound FAD (3a) and then transferred via a
catalytically active disulfide bond in the E3 subunit (not shown) to soluble NAD+ (3b).
The five different coenzymes involved are associated with the enzyme components in different ways. Thiamine diphosphate is non-covalently bound to E1, whereas lipoamide is covalently bound to a lysine residue
of E2 and FAD is bound as a prosthetic group to E3. NAD+ and coenzyme A, being soluble coenzymes, are only temporarily associated with the complex.
An important aspect of PDH catalysis is the spatial relationship between the components of the complex. The covalently bound lipoamide coenzyme is part of a mobile domain of E2, and is therefore highly mobile. This structure is known as the lipoamide arm, and swings back and forth between E1 and E3 during catalysis. In this way, lipoamide can interact with the TPP bound at E1, with solute coenzyme A, and also with the FAD that serves as the electron acceptor in E3.
B. PDH complex of Escherichia coli
The PDH complex of the bacterium Escherichia coli has been particularly well studied. It has a molecular mass of 5.3 106, and with a diameter of more than 30 nm it is larger than a ribosome. The complex consists of a total of 60 polypeptides (1, 2): 24 molecules of E2 (eight trimers) form the almost cube-shaped coreof thecomplex. Eachofthesix surfacesof the cube is occupied by a dimer of E3 components, while each of the twelve edges of the cube is occupied by dimers of E1 molecules. Animal oxoacid dehydrogenases have similar structures, but differ in the numbers of subunits and their molecular masses.
Further information
The PDH reaction, which is practically irreversible, occupiesastrategicpositionattheinterface between carbohydrate and fattyacid metabolism, and also supplies acetyl residues to the tricarboxylic acid cycle. PDH activity is therefore strictly regulated (see p. 144). Interconversion isparticularly important in animal cells (see p. 120). Several PDH-specific protein kinases inactivate the E1 componentsthrough phosphorylation, while equally specific protein phosphatases reactivate it again. The binding of the kinases and phosphatases to the complex is in turn regulated by metabolites. For example, high concentrations of acetyl CoA promote binding of kinases and thereby inhibit the reaction, while Ca2+ increases the activity of the phosphatase. Insulin activates PDH via inhibition of phosphorylation.
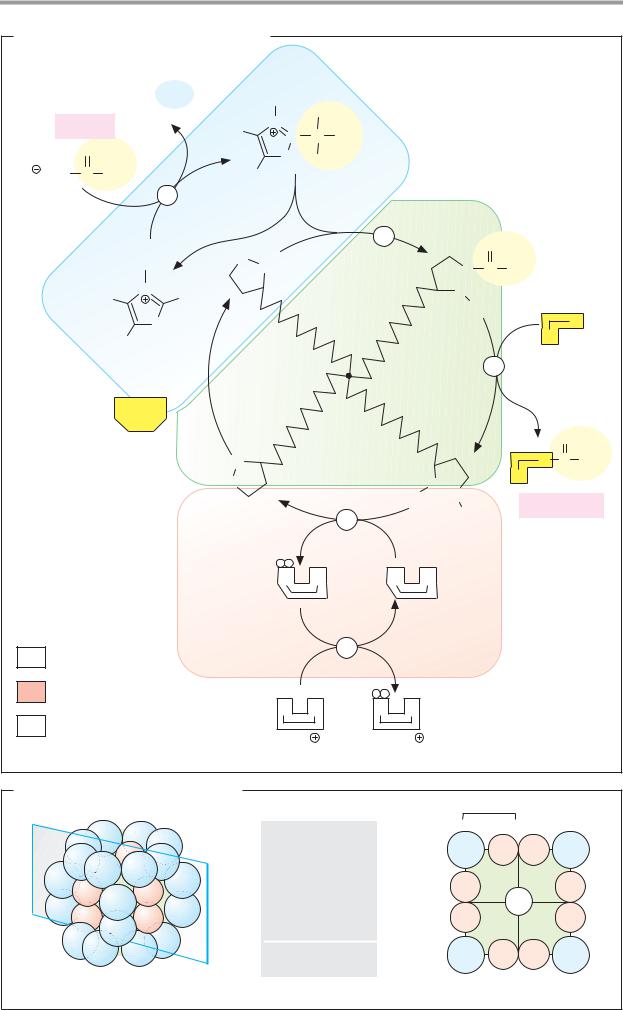
|
|
|
|
|
|
|
|
|
|
|
|
|
Energy Metabolism |
135 |
|||||
A. Pyruvate dehydrogenase: reactions |
|
|
|
|
|
|
|
|
|
|
|
|
|||||||
|
|
|
|
|
|
|
|
E1 |
|
|
|
|
|
|
|
|
|
|
|
|
|
|
|
CO2 |
|
|
R |
OH |
|
|
|
|
|
|
|
|
|
|
|
|
Pyruvate |
|
|
|
N |
|
|
|
|
|
|
|
|
|
|
||||
|
|
H3C |
|
|
|
Hydroxyalkyl thiamine |
|
|
|
|
|||||||||
|
|
|
|
|
|
|
C |
C |
CH3 |
|
|
|
|
||||||
|
|
O |
|
|
|
|
|
S |
H |
|
diphosphate |
|
|
|
|
|
|
||
|
|
|
|
|
|
|
|
|
|
|
|
|
|
|
|
|
|
||
|
OOC |
C |
CH3 |
|
|
R |
|
|
|
|
|
|
|
|
|
|
|
||
|
|
|
|
|
|
|
|
|
|
|
|
|
|
|
|||||
|
|
|
|
1 |
|
|
|
|
|
|
|
|
|
|
|
|
|
|
|
|
|
|
|
|
|
|
|
|
|
|
2 |
|
|
E2 |
|
|
|
|
|
|
|
|
|
|
|
|
|
|
|
|
|
|
|
O |
|
|
|
|
|
|
|
|
|
1 |
|
S |
|
|
|
|
|
|
|
|
|
Acetyl |
|||
|
|
|
|
|
|
|
|
|
|
|
|
|
|
|
|||||
|
|
|
|
R |
|
|
S |
|
|
|
|
|
|
S |
C |
CH3 |
lipoamide |
||
|
|
|
|
|
|
|
|
|
|
|
|
|
|||||||
|
|
H3C |
N |
H |
|
|
|
|
|
|
|
|
S |
|
|
|
|
|
|
|
|
|
|
|
|
|
|
|
|
|
H |
|
|
|
|
|
|||
|
|
|
|
|
|
|
|
|
|
|
|
|
|
|
|
|
|
|
|
|
|
|
|
S |
|
|
|
|
|
|
|
|
|
|
|
|
A |
S |
|
|
|
|
|
R2 |
|
|
|
|
|
|
|
|
|
|
|
|
|
|
|
|
|
|
|
Thiamine |
|
|
|
|
|
|
|
|
|
|
3 |
|
|
CoA |
|
|
|
|
|
diphosphate |
|
|
|
|
|
|
|
|
|
|
|
|
|
|
|
|
|
|
|
TPP |
|
|
|
|
|
|
|
|
|
|
|
|
|
|
|
|
|
|
|
|
|
|
|
|
|
|
|
|
|
|
|
|
|
O |
|
|
|
|
|
|
|
S |
|
|
|
|
|
|
|
|
|
A |
S |
C |
CH3 |
|
|
|
|
|
|
S |
|
|
|
|
|
|
S |
|
|
|
|
|
|
|
|
|
|
|
|
|
|
|
|
|
H |
S |
|
|
|
|
|
||
|
|
|
|
|
|
|
|
|
|
|
|
|
|
Acetyl CoA |
|||||
|
|
|
|
|
E3 |
|
|
|
|
4a |
|
|
|
H |
|
||||
|
|
|
|
|
|
|
|
|
|
|
|
|
|
|
|
|
|||
|
|
|
|
|
|
|
|
|
|
|
|
|
|
|
|
|
|
||
|
|
|
|
|
|
|
|
|
|
|
|
|
|
Dihydrolipoamide |
|
||||
|
|
|
|
|
|
|
|
F |
A |
|
|
F |
A |
|
|
|
|
|
|
E1 |
Pyruvate dehydro- |
|
|
|
|
|
4b |
|
|
|
|
|
|
|
|
|
|||
genase 1.2.4.1 |
|
|
|
|
|
|
|
|
|
|
|
|
|
|
|
||||
E2 |
Dihydrolipoamide |
|
|
|
|
|
|
|
|
|
|
|
|
|
|
|
|||
|
acetyltransferase 2.3.1.12 |
|
|
N |
A |
|
N |
A |
|
|
|
|
|
|
|
||||
|
|
|
|
|
|
|
|
|
|
|
|
|
|
|
|
||||
E3 |
Dihydrolipoamide |
|
|
|
|
|
|
|
|
|
|
|
|
|
|
|
|||
|
dehydrogenase 1.8.1.4 |
|
|
NAD |
|
NADH + H |
|
|
|
|
|
|
|
||||||
B. PDH complex of Escherichia coli |
|
|
|
|
|
10nm |
|
E1 |
12 · 2 = 24 |
E1 |
E3 |
E2 |
8 · 3 = 24 |
|
E2 |
E3 |
6 · 2 =12 |
|
|
E1+ E2 + E3 = 60 |
|
|
|
1. |
|
2. |
|

136 Metabolism
Tricarboxylic acid cycle: reactions
The tricarboxylic acid cycle (TCA cycle, also known as the citric acid cycle or Krebs cycle) is a cyclicmetabolicpathway inthemitochondrial matrix (see p. 210). In eight steps, it oxidizes acetyl residues (CH3-CO-) to carbon dioxide (CO2). The reducing equivalents obtained in this process are transferred to NAD+ or ubiquinone, and from there to the respiratory chain (see p. 140). Additional metabolic functions of the cycle are discussed on p. 138.
A. Tricarboxylic acid cycle
The acetyl-CoA that supplies the cycle with acetyl residues is mainly derived from Ε- oxidation of fatty acids (see p. 164) and from the pyruvate dehydrogenase reaction. Both of these processes take place in the mitochondrial matrix.
[1]In the first step of the cycle, citrate synthase catalyzes the transfer of an acetyl residue from acetyl CoA to a carrier molecule, oxaloacetic acid. The product of this reaction, tricarboxylic acid, gives the cycle its name.
[2]In the next step, tricarboxylic acid undergoes isomerization to yield isocitrate. In the process, only the hydroxyl group is shifted within the molecule. The corresponding enzyme is called aconitate hydratase
(“aconitase”), because unsaturated aconitate arises as an enzyme-bound intermediate during the reaction (not shown; see p. 8). Due to the properties of aconitase, the isomerization is absolutely stereospecific. Although citrate is not chiral, isocitrate has two chiral centers, so that it could potentially appear in four isomeric forms. However, in the tricarboxylic acid cycle, only one of these stereoisomers, (2R,3S)-isocitrate, is produced.
[3]The first oxidative step now follows.
Isocitrate dehydrogenase oxidizes the hydroxyl group of isocitrate into an oxo group.
At the same time, a carboxyl group is released
as CO2, and 2-oxoglutarate (also known as α- ketoglutarate) and NADH+H+ are formed.
[4]The next step, the formation of succinyl CoA, also involves one oxidation and one decarboxylation. It is catalyzed by 2-oxogluta- rate dehydrogenase, a multienzyme complex closely resembling the PDH complex (see
p. 134). NADH+H+ is once again formed in this reaction.
[5]The subsequent cleavage of the thioester succinylCoA into succinate and coenzyme A by succinic acid-CoA ligase (succinyl CoA synthetase, succinic thiokinase) is strongly exergonic and is used to synthesize a phosphoric acid anhydride bond (“substrate level phosphorylation ”, see p.124). However, it is not ATP that is produced here as is otherwise usually the case, but instead guanosine triphosphate (GTP). However, GTP can be converted into ATP by a nucleoside diphosphate kinase (not shown).
[6]Via the reactions described so far, the acetyl residue has been completely oxidized
to CO2. At the same time, however, the carrier molecule oxaloacetate has been reduced to succinate. Three further reactions in the cycle now regenerate oxaloacetate from succinate. Initially, succinate dehydrogenase oxidizes succinate to fumarate. Incontrasttotheother enzymesinthecycle,succinatedehydrogenase isanintegralproteinoftheinnermitochondrial membrane. It is therefore also assigned to the respiratory chain as complex II. Although succinate dehydrogenase contains FAD as a prosthetic group, ubiquinone is the real electron acceptor of the reaction.
[7]Water is now added to the double bond of fumarate by fumarate hydratase (“fumarase”), and chiral (2S)-malate is produced.
[8]In the last step of the cycle, malate is
again oxidized by malate dehydrogenase into oxaloacetate, with NADH+H+ again being produced. With this reaction, the cycle is complete and can start again from the beginning. As the equilibrium of the reaction lies well on the side of malate, the formation of oxaloacetic acid by reaction [8] depends on the strongly exergonic reaction [1], which immediately removes it from the equilibrium.
The net outcome is that each rotation of the tricarboxylic acid cycle converts one ace-
tyl residue and two molecules of H2O into two
molecules of CO2. At the same time, one GTP, three NADH+H+ and one reduced ubiquinone
(QH2) are produced. By oxidative phosphorylation (see p. 122), the cell obtains around nine molecules of ATP from these reduced coenzymes (see p. 146). Together with the directly formed GTP, this yields a total of 10 ATP per acetyl group.
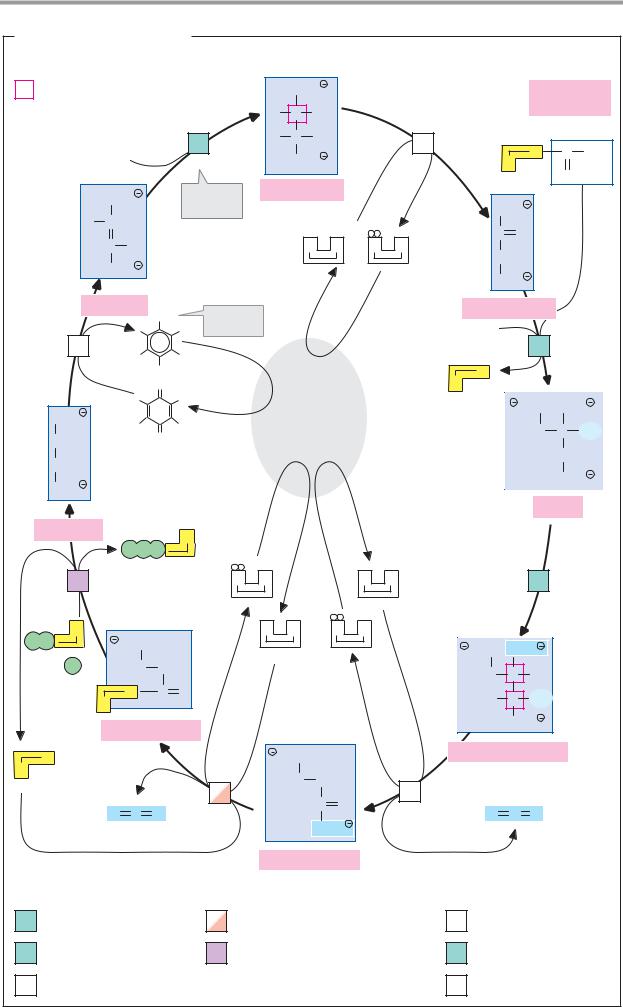
|
|
|
|
|
|
|
|
|
|
|
|
|
|
|
Energy Metabolism |
137 |
|||||
A. Tricarboxylic acid cycle |
|
|
|
|
|
|
|
|
|
|
|
|
|
||||||||
|
Center of chirality |
|
|
|
|
COO |
|
|
|
|
|
Acetyl CoA |
|||||||||
|
|
|
|
|
|
|
|
|
|
H |
C |
|
OH |
|
|
|
|
|
|||
|
|
|
|
|
|
|
|
|
|
|
|
|
|
|
|
|
|
|
|||
|
|
|
|
|
|
|
|
7 |
|
H |
C |
|
H |
|
8 |
+28.1 |
|
|
|
|
|
|
H2O |
|
|
|
|
|
|
|
|
|
|
S |
C |
CH3 |
|||||||
|
|
|
|
-3.8 |
|
|
COO |
|
|
|
|
A |
|||||||||
|
|
|
|
|
|
|
|
|
|
|
O |
|
|||||||||
|
|
|
|
|
|
|
|
∆G0I |
|
(2S) - Malate |
|
|
|
|
|
|
|||||
|
|
COO |
|
|
|
|
|
|
|
|
|
||||||||||
|
|
|
kJ · mol-1 |
|
|
|
|
|
|
|
COO |
|
|
|
|||||||
|
H |
C |
|
|
|
|
|
|
|
|
|
|
|
|
|
|
|||||
|
|
|
|
|
|
|
|
|
|
|
|
|
|
C |
O |
|
|
|
|||
|
|
C |
|
H |
|
|
|
|
|
N |
A |
N |
A |
|
|
|
|
||||
|
|
|
|
|
|
|
|
|
CH2 |
|
|
|
|||||||||
|
|
COO |
|
|
|
|
|
|
|
|
|
|
|
|
|
||||||
|
|
|
|
|
|
|
|
|
|
|
|
COO |
|
|
|
||||||
|
|
|
|
|
|
|
|
|
|
|
|
|
|
|
|
|
|
|
|
||
|
Fumarate |
OH |
Ubiquinol |
|
|
|
|
|
|
|
Oxaloacetate |
|
|
||||||||
|
|
|
|
|
|
|
|
|
|
|
|
|
|
|
|
|
|
|
|||
|
6 ±0 |
|
|
|
|
|
|
QH2 |
|
|
|
|
|
|
|
|
H2O |
|
1 |
-38.2 |
|
|
|
|
|
|
|
|
|
|
|
|
|
|
|
|
|
|
|
||||
|
|
|
|
|
|
|
OH |
|
|
|
|
|
|
|
|
|
S |
|
|
|
|
|
|
|
|
|
|
|
O |
|
|
|
|
|
|
|
|
A |
|
|
|
|
|
|
COO |
|
|
|
|
|
|
|
|
Respiratory |
|
|
|
OOC |
COO |
||||||
|
|
|
|
|
|
|
|
|
chain |
|
|
|
|
|
H2C |
C |
OH |
||||
|
|
|
|
|
|
|
|
|
|
|
|
|
|
|
|||||||
|
CH2 |
|
|
|
|
|
O |
|
|
|
|
|
|
|
|
|
|
||||
|
|
|
|
|
|
|
|
|
|
|
|
|
|
|
|
|
|
|
|
||
|
|
|
|
|
|
|
|
|
|
|
|
|
|
|
|
|
|
|
CH2 |
||
|
CH2 |
|
|
|
|
|
|
|
|
|
|
|
|
|
|
|
|
|
|
||
|
|
|
|
|
|
|
|
|
|
|
|
|
|
|
|
|
|
|
COO |
||
|
COO |
|
|
|
|
|
|
|
|
|
|
|
|
|
|
|
|
|
|
||
|
|
|
|
|
|
|
|
|
|
|
|
|
|
|
|
|
|
|
|
|
|
|
|
|
|
|
|
|
|
|
|
|
|
|
|
|
|
|
|
|
Citrate |
|
|
|
Succinate |
|
|
|
|
|
|
G |
|
|
|
|
|
|
|
|
|
|
|
|
|
|
|
|
|
|
|
|
|
|
|
|
|
|
|
|
|
|
|
|
|
|
|
|
|
|
|
|
P P |
P |
|
|
|
|
|
|
|
|
|
|
|
|
|
|
|
|
5 -8.8 |
|
|
GTP |
|
N |
A |
|
|
|
N |
A |
|
|
|
2 |
+6.7 |
|
|||
|
G |
|
|
|
|
|
|
|
|
N |
A |
|
N |
A |
|
|
|
|
|
|
|
P |
P |
|
|
OOC |
|
|
|
|
|
|
|
|
|
|
OOC |
COO |
|
|
|||
|
|
|
|
|
|
|
|
|
|
|
|
|
|
|
|
|
|
|
|||
|
P |
|
|
H2C |
CH2 |
|
|
|
|
|
|
|
|
H2C |
C |
H |
|
|
|||
|
|
|
|
|
|
|
|
|
|
|
|
|
|
||||||||
|
|
|
|
|
|
|
C |
O |
|
|
|
|
|
|
|
|
|
|
|||
|
A |
|
|
|
S |
|
|
|
|
|
|
|
|
H |
C |
OH |
|
|
|||
|
|
|
|
|
|
|
|
|
|
|
|
|
|
|
|
|
|
||||
|
|
|
|
|
|
|
|
|
|
|
|
|
|
|
|
|
|
|
|
|
|
|
|
|
Succinyl CoA |
|
|
|
|
|
|
|
|
|
COO |
|
|
||||||
|
|
|
|
|
|
|
|
|
|
|
|
|
|
|
|
||||||
|
S |
|
|
|
|
|
|
|
|
OOC |
|
|
|
|
(2R,3S)-Isocitrate |
|
|||||
|
|
|
|
|
|
|
-37.0 |
|
|
|
-7.1 |
|
|
|
|
|
|
||||
A |
|
|
|
|
|
|
|
|
H2C |
CH2 |
|
|
|
|
|
|
|||||
|
|
|
|
|
|
|
|
4 |
|
|
3 |
|
|
|
|
|
|
||||
|
|
|
|
|
|
|
|
|
|
|
|
C |
O |
|
|
|
|
|
|
||
|
|
O |
|
C |
O CO2 |
|
|
|
|
|
|
O |
C |
O CO2 |
|
||||||
|
|
|
|
|
|
|
COO |
|
|
|
|||||||||||
|
|
|
|
|
|
|
|
|
|
|
|
|
|
|
|
|
|
|
|
||
|
|
|
|
|
|
|
|
|
|
2-Oxoglutarate |
|
|
|
|
|
|
|
||||
1 |
Citrate synthase |
|
4 |
2-Oxoglutarate DH complex |
6 |
Succinate DH 1.3.5.1 |
|||||||||||||||
4.1.3.7 |
|
|
|
|
|
|
1.2.4.2, 1.8.1.4, 2.3.1.61 |
|
[FAD, Fe2S2, Fe4S4] |
||||||||||||
2 |
Aconitase |
|
|
S |
|
] |
|
5 |
Succinate-CoA ligase |
|
7 |
Fumarate hydratase |
|||||||||
|
4.2.1.3 [Fe |
4 |
4 |
|
|
6.2.1.4 |
|
|
|
|
|
|
4.2.1.2 |
|
|
|
|||||
|
|
|
|
|
|
|
|
|
|
|
|
|
|
|
|
|
|
|
|
||
3 |
Isocitrate DH 1.1.1.41 |
|
DH = dehydrogenase |
|
8 |
Malate DH 1.1.1.37 |
|||||||||||||||

138 Metabolism
Tricarboxylic acid cycle: functions
A. Tricarboxylic acid cycle: functions
The tricarboxylic acid cycle (see p. 136) is often described as the “hub of intermediary metabolism.” It has both catabolic and anabolic functions—it is amphibolic.
As a catabolic pathway, it initiates the “terminal oxidation” of energy substrates. Many catabolic pathways lead to intermediates of the tricarboxylic acid cycle, or supply metabolites such as pyruvate and acetyl-CoA that can enter the cycle, where their C atoms are oxidized to CO2. The reducing equivalents (see p. 14) obtained in this way are then used for oxidative phosphorylation—i.e., to aerobically synthesize ATP (see p. 122).
The tricarboxylic acid cycle also supplies important precursors for anabolic pathways.
Intermediates in the cycle are converted into:
•Glucose (gluconeogenesis; precursors: oxaloacetate and malate—see p. 154)
•Porphyrins (precursor: succinyl-CoA—see p. 192)
•Amino acids (precursors: 2-oxoglutarate, oxaloacetate—see p. 184)
•Fatty acids and isoprenoids (precursor: cit- rate—see below)
The intermediates of the tricarboxylic acid cycle are present in the mitochondria only in very small quantities. After the oxidation of acetyl-CoA to CO2, they are constantly regenerated, and their concentrations therefore remain constant, averaged over time. Anabolic pathways, which remove intermediates of the cycle (e.g., gluconeogenesis) would quickly use up the small quantities present in the mitochondria if metabolites did not reenter the cycle at other sites to replace the compounds consumed. Processes that replenish the cycle in this way are called anaplerotic reactions.
The degradation of most amino acids is anaplerotic, because it produces either intermediates of the cycle or pyruvate (glucogenic amino acids; see p. 180). Gluconeogenesis is in fact largely sustained by the degradation of amino acids. A particularly important anaplerotic step in animal metabolism leads from pyruvate to oxaloacetic acid. This ATPdependent reaction is catalyzed by pyruvate
carboxylase [1]. It allows pyruvate yielding amino acids and lactate to be used for gluconeogenesis.
By contrast, acetyl CoA does not have anaplerotic effects in animal metabolism. Its carbon skeleton is completely oxidized to CO2 and is therefore no longer available for biosynthesis. Since fatty acid degradation only supplies acetyl CoA, animals are unable to convert fatty acids into glucose. During periods of hunger, it is therefore not the fat reserves that are initially drawn on, but proteins. In contrast to fatty acids, the amino acids released are able to maintain the blood glucose level (see p. 308).
The tricarboxylic acid cycle not only takes up acetyl CoA from fatty acid degradation, but also supplies the material for the biosynthesis of fatty acids and isoprenoids. Acetyl CoA, which is formed in the matrix space of mitochondria by pyruvate dehydrogenase (see p. 134), is not capable of passing through the inner mitochondrial membrane. The acetyl residue is therefore condensed with oxaloacetate by mitochondrial citrate synthase to form citrate. This then leaves the mitochondria by antiport with malate (right; see p. 212). In the cytoplasm, it is cleaved again by ATP-dependent citrate lyase [4] into acetylCoA and oxaloacetate. The oxaloacetate formed is reduced by a cytoplasmic malate dehydrogenase to malate [2], which then returns to the mitochondrion via the antiport already mentioned. Alternatively, the malate can be oxidized by “malic enzyme” [5], with decarboxylation, to pyruvate. The NADPH+H+ formed in this process is also used for fatty acid biosynthesis.
Additional information
Using the so-called glyoxylic acid cycle, plants and bacteria are able to convert acetyl-CoA into succinate, which then enters the tricarboxylic acid cycle. For these organisms, fat degradation therefore functions as an anaplerotic process. In plants, this pathway is located in special organelles, the glyoxysomes.
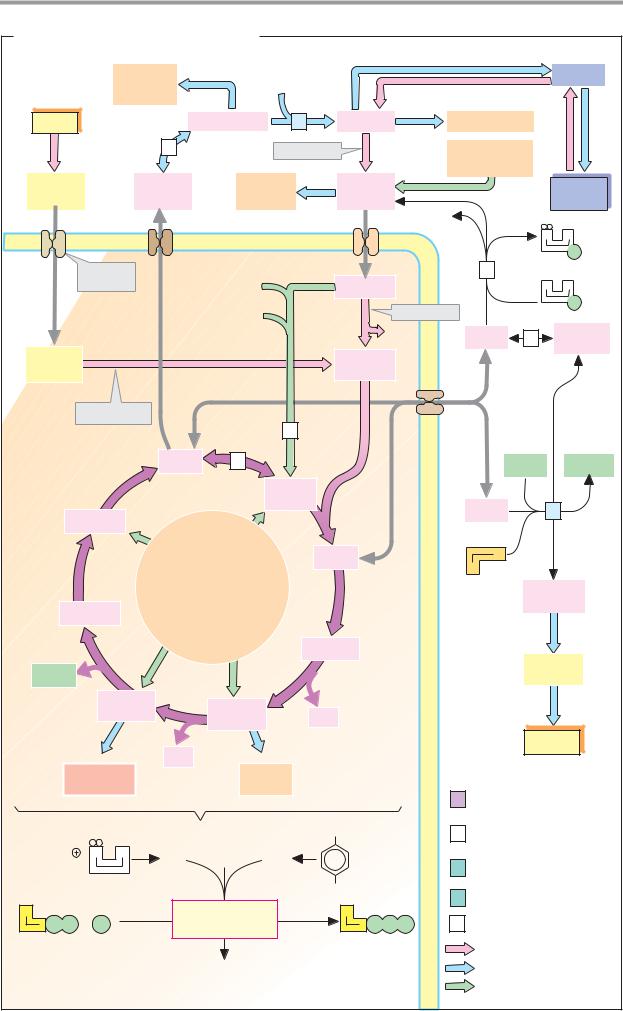
|
|
|
|
|
|
|
|
|
Energy Metabolism |
139 |
||
A. Tricarboxylic acid cycle: functions |
|
|
|
|
|
|
|
|
||||
* Essential |
|
Asp, Asn, |
|
GTP |
|
|
|
|
|
Glucose |
||
* amino acid |
|
Arg, Met*, |
|
|
|
|
|
|
|
|
||
|
|
Thr*, Ile* |
|
|
|
|
|
|
|
|
|
|
Fat |
|
|
Oxaloacetate |
3 |
PEP |
|
|
Phe*, Tyr, Trp* |
|
|||
|
|
|
2 |
|
Irreversible |
|
|
Ala, Ser, Thr*, |
|
|
||
|
|
|
|
|
|
|
|
|
Cys, Gly |
|
|
|
Acyl- |
|
Malate |
Ala, Leu*, |
Pyruvate |
|
|
|
Carbo- |
||||
CoA |
|
|
|
Val* |
|
|
|
|
|
|
hydrates |
|
|
|
|
Cytoplasm |
|
|
|
|
CO2 |
|
|
|
|
|
|
|
|
|
|
|
|
|
|
|
N |
A |
|
|
|
|
|
|
|
|
|
|
|
|
P |
Carnitine |
|
|
|
|
|
|
|
5 |
|
|
||
shuttle |
|
|
CO2 |
|
Pyruvate |
|
|
|
N |
A |
||
|
|
|
|
|
|
|
|
|
|
|||
|
|
|
|
|
|
|
|
Irreversible |
|
|
P |
|
|
|
|
|
ATP |
|
|
|
|
|
|
||
|
|
|
|
|
|
|
|
|
|
|
|
|
|
|
|
|
|
|
|
CO2 |
|
Malate |
2 |
Oxalo- |
|
Acyl |
|
|
|
|
|
Acetyl |
|
|
|
|
|
acetate |
|
|
|
|
|
|
|
|
|
|
|
||
CoA |
|
|
|
|
|
CoA |
|
|
|
|
|
|
β-Oxidation |
|
|
|
|
|
|
|
|
|
|
||
|
|
|
|
|
1 |
|
|
|
|
|
|
|
Mitochondrial |
|
|
Malate |
2 |
|
|
|
|
|
ATP |
ADP+Pi |
|
matrix |
|
|
|
|
|
|
|
|
|
|||
|
|
|
|
Oxalo- |
|
|
|
|
|
|
|
|
|
|
|
|
|
|
|
|
|
|
|
|
|
|
|
|
|
|
acetate |
|
|
|
Citrate |
4 |
|
|
Fumarate |
|
|
|
|
|
|
|
|
||||
|
|
|
|
|
|
|
|
|
|
|||
|
|
|
Asp |
Asp |
|
|
|
|
|
|
|
|
|
|
|
Phe* |
Asn |
|
Citrate |
|
|
|
S |
|
|
|
|
|
Tyr |
|
|
|
|
|
|
A |
|
|
|
|
|
Ile* |
His |
|
|
|
|
|
CoA |
Acetyl |
|
|
|
|
Pro |
|
|
|
|
|
|
CoA |
|
|
Succinate |
|
Val* |
Arg |
|
|
|
|
|
|
|
||
|
|
|
|
|
|
|
|
|
||||
|
Met* |
Gln |
|
|
|
|
|
|
|
|
||
|
|
|
|
|
|
|
|
|
|
|
||
|
|
|
Trp* |
Glu |
|
|
|
|
|
|
|
|
|
|
|
|
|
|
Isocitrate |
|
|
|
|
|
|
|
|
|
|
|
|
|
|
|
|
|
Fatty |
|
GTP |
|
|
|
|
|
|
|
|
|
|
acids |
|
|
Succinyl |
|
2-Oxo- |
|
|
|
|
|
|
|
|
|
|
CoA |
|
|
CO2 |
|
|
|
|
|
|
||
|
|
glutarate |
|
|
|
|
|
|
|
|||
|
|
|
|
|
|
|
|
|
|
|
||
|
|
|
CO2 |
|
|
|
|
|
|
|
Fat |
|
|
|
|
Glu, Gln, |
|
|
|
|
|
|
|
||
Porphyrins |
|
|
|
|
|
|
|
|
||||
|
Pro, Arg |
|
|
|
|
6.4.1.1Pyruvate carboxylase |
||||||
|
|
|
|
|
|
|
1 |
|||||
|
|
|
|
|
|
|
|
|
||||
|
|
|
|
|
|
OH |
|
|
2 |
Malate dehydrogenase |
||
|
|
|
|
|
|
|
|
|
1.1.1.37 |
|
|
|
NADH+H |
N |
A |
2[H] |
O2 |
2[H] |
Ubiquinol |
|
PEP carboxykinase |
||||
|
|
3 |
||||||||||
|
|
|
|
|
|
(QH2) |
|
|
4.1.1.32 |
|
|
|
|
|
|
|
|
|
OH |
|
|
4 |
Citrate lyase 4.1.3.8 |
||
A |
|
|
Oxidative |
|
A |
|
|
|||||
|
|
|
|
|
5 |
Malic enzyme 1.1.1.40 |
||||||
P P + |
P |
|
phosphorylation |
|
P |
P |
P |
|||||
ADP |
Pi |
|
|
|
|
ATP |
|
|
|
Catabolic pathway |
||
|
|
|
|
H2O |
|
|
|
|
|
Anabolic pathway |
||
|
|
|
|
|
|
|
|
|
|
Anaplerotic reaction |
||

140 Metabolism
Respiratory chain
The respiratory chain is one of the pathways involved in oxidative phosphorylation (see p. 122). It catalyzes the steps by which electrons are transported from NADH+H+ or reduced ubiquinone (QH2) to molecular oxygen. Due to the wide difference between the redox potentials of the donor (NADH+H+ or QH2) and the acceptor (O2), this reaction is strongly exergonic (see p. 18). Most of the energy released is used to establish a proton gradient across the inner mitochondrial membrane (see p. 126), which is then ultimately used to synthesize ATP with the help of ATP synthase.
A. Components of the respiratory chain
The electron transport chain consists of three protein complexes (complexes I, III, and IV), which are integrated into the inner mitochondrial membrane, and two mobile carrier mol- ecules—ubiquinone (coenzyme Q) and cytochrome c. Succinate dehydrogenase, which actually belongs to the tricarboxylic acid cycle, is also assigned to the respiratory chain as complex II. ATP synthase (see p. 142) is sometimes referred to as complex V, although it is not involved in electron transport. With the exception of complex I, detailed structural information is now available for every complex of the respiratory chain.
All of the complexes in the respiratory chain are made up of numerous polypeptides and contain a series of different protein bound redox coenzymes (see pp. 104, 106). These include flavins (FMN or FAD in complexes I and II), iron–sulfur clusters (in I, II, and III), and heme groups (in II, III, and IV). Of the more than 80 polypeptides in the respiratory chain, only 13 are coded by the mitochondrial genome (see p. 210). The remainder are encoded by nuclear genes, and have to be imported into the mitochondria after being synthesized in the cytoplasm (see
p.228).
Electrons enter therespiratorychain invar-
ious different ways. In the oxidation of NADH+H+ by complex I, electrons pass via FMNand Fe/S clusters to ubiquinone (Q). Electronsarisingduringtheoxidationofsuccinate, acyl CoA, and other substrates are passed to ubiquinone by succinate dehydrogenase or other mitochondrial dehydrogenases via en-
zyme-bound FADH2 and the electron-trans- porting flavoprotein (ETF; see p. 164). Ubiquinol passes electrons on to complex III, which transfers them via two b-type heme groups, one Fe/S cluster, and heme c1 to the small heme protein cytochrome c. Cytochrome c then transports the electrons to complex IV—cytochrome c oxidase. Cytochrome c oxidase contains redox-active components in the form of two copper centers (CuA and CuB) and hemes a and a3, through which the electrons finally reach oxygen (see p. 132). As the result of the two-electron reduction of O2, the strongly basic O2– anion is produced (at least formally), and this is converted into water by binding of two protons. The electron transfer is coupled to the formation of a proton gradient by complexes I, III, and IV (see p. 126).
B. Organization
Proton transport via complexes I, III, and IV takes place vectorially from the matrix into the intermembrane space. When electrons are being transported through the respiratory chain, the H+ concentration in this space in- creases—i.e., the pH value there is reduced by about one pH unit. For each H2O molecule formed, around 10 H+ ions are pumped into the intermembrane space. If the inner membrane is intact, then generally only ATP synthase (see p. 142) can allow protons to flow back into the matrix. This is the basis for the coupling of electron transport to ATP synthesis, which is important for regulation purposes (see p. 144).
As mentioned, although complexes I through V are all integrated into the inner membrane of the mitochondrion, they are not usually in contact with one another, since the electrons are transferred by ubiquinone and cytochrome c. With its long apolar side chain, ubiquinone is freely mobile within the membrane. Cytochrome c is water-soluble and is located on the outside of the inner membrane.
NADH oxidation via complex I takes place on the inside of the membrane—i.e., in the matrix space, where the tricarboxylic acid cycle and β-oxidation (the most important sources of NADH) are also located. O2 reduction and ATP formation also take place in the matrix.

|
|
|
|
|
|
|
Energy Metabolism |
141 |
|||||||
A. Components of the respiratory chain |
|
|
|
|
|
|
|
|
|
|
|
||||
Pyruvate |
|
Liponamide-H2 |
|
E OI |
|
Complex I |
|
|
|||||||
2-Oxoglutarate |
HS |
SH |
|
H |
(V |
NADH dehydrogenase (ubiquinone) |
|||||||||
|
|
|
|
|
|||||||||||
|
|
|
|
|
|
||||||||||
|
|
|
|
|
|
|
1.6.5.3 |
|
|
|
|
|
|
|
|
|
|
|
|
I |
|
-0.3 |
Mr 700 - 800 kDa, 25 - 30 subunits |
||||||||
|
|
|
|
|
1 FMN, 2 Fe |
|
S |
|
, 4 - 5 Fe S |
4 |
|
||||
|
|
|
|
|
Succinate |
|
2 |
2 |
|
|
4 |
|
|||
|
|
|
|
|
|
Complex II |
|
|
|||||||
3-Hydroxybutyrate |
|
|
|
|
|
|
|
||||||||
|
|
|
|
|
|
|
|
|
|
|
|
|
|
||
3-Hydroxyacyl CoA |
N |
A |
|
|
|
Succinate dehydrogenase 1.3.5.1 |
|||||||||
Malate |
|
|
|
|
|
|
|||||||||
|
|
|
|
|
|
Mr 125 kDa, 4 - 6 subunits |
|
||||||||
Isocitrate |
|
NADH |
Q |
II |
+0.1 |
|
|||||||||
|
|
|
|
1 FAD, 1 Fe |
S |
, 1 Fe |
S |
, 1Fe S |
4 |
||||||
|
|
|
|
|
|
|
2 |
|
2 |
|
4 |
4 |
|
3 |
|
|
|
|
|
|
|
|
2 ubiquinone, 1 heme b |
|
|
||||||
|
|
|
|
|
H |
|
Complex III |
|
|
||||||
|
|
|
|
|
|
|
|
|
|
|
|
|
|
|
|
|
|
|
|
|
Fumarate |
|
Ubiquinol-cytochrome C |
|
|
||||||
Acyl CoA |
|
|
|
III |
|
|
reductase 1.10.2.2 |
|
|
|
|
||||
α-Glycerophosphate |
ETF |
|
|
Mr ≈ 400 kDa, 11 subunits |
|
||||||||||
|
|
|
|
||||||||||||
Dihydroorotat |
|
|
|
|
|
2 Fe2S2, 2 heme b, 1 heme c1 |
|
||||||||
Cholin |
|
|
|
|
|
|
|
||||||||
|
|
|
|
|
Cytochrome C |
|
Complex IV |
|
|
||||||
|
|
|
|
|
|
Cytochrome C oxidase 1.9.3.1 |
|
||||||||
|
nH |
|
|
|
Mr 12 kDa |
|
|
||||||||
|
|
|
|
1 heme |
+0.3 |
Mr ≈ 200 kDa, 8 - 13 subunits |
|
||||||||
|
|
|
|
|
|
||||||||||
|
|
|
|
|
|
|
|||||||||
|
V |
|
|
|
|
|
2 Cu, 1 Zn, 1 heme a, 1 heme a3 |
||||||||
|
|
|
|
H |
|
Complex V |
|
|
|||||||
|
|
|
|
|
|
|
|
||||||||
|
|
|
|
|
CN |
|
|
|
|||||||
|
|
|
|
|
|
H -transporting ATP synthase |
|||||||||
|
|
|
|
IV |
CO |
|
|||||||||
A |
|
A |
|
|
3.6.1.34 |
|
|
|
|
|
|
|
|
||
nH |
|
|
|
|
|
|
|
|
|
|
|
|
|||
P P P |
P P |
P |
|
|
|
|
|
|
|
|
|
|
|
||
|
|
|
|
|
|
|
|
|
|
|
|
||||
|
|
|
|
|
|
Mr >400 kDa, >20 subunits |
|
||||||||
|
|
|
|
|
|
|
|
||||||||
|
|
|
|
|
O2 |
|
|
|
|
|
|
|
|
|
|
|
|
|
|
1/2 O2 |
2 H |
|
|
|
Electron flow |
|
|||||
|
|
|
|
|
|
|
|
|
|||||||
|
|
|
|
|
H2O |
+0.8 |
|
|
Proton flow |
|
|||||
|
|
|
|
|
|
|
|
|
|
|
|
|
|
|
|
B. Organization
|
4 H |
4 H |
|
2 H |
|
|
II |
|
|
|
|
|
|
|
|
|
|
|
I |
|
Cyto- |
? |
∆p |
|
Q |
|
|||
|
III |
chrome C |
IV |
||
|
|
V |
|||
|
|
|
|
|
|
2e |
|
4 H |
2-4 H |
|
|
|
4 H |
|
1/2 O2 |
3 P |
|
|
|
2 H |
O2 |
||
|
|
|
A |
||
N A |
|
N A |
|
3 |
|
|
|
|
|
|
P P |
|
Tricarboxylic |
NAD |
H2O |
10 H |
|
NADH+H |
acid cycle |
|
|||
|
|
|
|
||
β-Oxidation |
|
|
|
|
|
|
|
|
|
|
|
Outer mitochondrial  membrane
 Intermembrane space

 Inner
Inner
mitochon-
 drial membrane
Matrix space
3 A
P P P
ATP
142 Metabolism
ATP synthesis
In the respiratory chain (see p. 140), electrons are transferred from NADH or ubiquinol (QH2) to O2. The energy obtained in this process is used to establish a proton gradient across the inner mitochondrial membrane. ATP synthesis is ultimately coupled to the return of protons from the intermembrane space into the matrix.
A. Redox systems of the respiratory chain
The electrons provided by NADH do not reach oxygen directly, but instead are transferred to it in various steps. They pass through at least 10 intermediate redox systems, most of which are bound as prosthetic groups in complexes I, III, and IV. The large number of coenzymes involved in electron transport may initially appear surprising. However, as discussed on p. 18, in redox reactions, the change in free enthalpy ∆G—i.e., the chemical work that is done—depends only on the difference in redox potentials ∆E between the donor and the acceptor. Introducing additional redox systems does not alter the reaction’s overall energy yield. In the case of the respiratory chain, the difference between the normal potential of the donor (NAD+/NADH+H+, E0 = –0.32 V) and that of the acceptor (O2/H2O, E0 = +0.82 V) corresponds to an energy difference ∆G0 of more than 200 kJ mol–1. This large amount is divided into smaller, more manageable “packages,” the size of which is determined by the difference in redox potentials between the respective intermediates. It is assumed that thisdivision isresponsible for the astonishingly high energy yield (about 60%) achieved by the respiratory chain.
The illustration shows the important redox systems involved in mitochondrial electron transport and their approximate redox potentials. These potentials determine the path followed by the electrons, as the members of a redox series have to be arranged in order of increasing redox potential if transport is to occur spontaneously (see p. 32).
In complex 1, the electronsare passed from NADH+H+ first to FMN (see p. 104) and then on to several iron–sulfur (Fe/S) clusters. These redox systems are only stable in the interior of proteins. Depending on the type, Fe/S clusters may contain two to six iron ions, which
form complexes with inorganic sulfide and
the SH |
groups of |
cysteine residues |
(see |
p. 286). |
Ubiquinone |
(coenzyme Q; |
see |
p. 104) is a mobile carrier that takes up electrons from complexes I and II and from reduced ETF and passes them on to complex III. Heme groups are also involved in electron transport in a variety of ways. Type b hemes correspond to that found in hemoglobin (see p. 280). Heme c in cytochrome c is covalently bound to the protein, while the tetrapyrrole ring of heme a is isoprenylated and carries a formylgroup. IncomplexIV,a copper ion (CuB) and heme a3 react directly with oxygen.
B. ATP synthase
TheATP synthase (EC 3.6.1.34, complexV) that transports H+ is a complex molecular machine. The enzyme consists of two parts—a proton channel (Fo,for“oligomycin-sensitive”) that is integrated into the membrane; and a catalytic unit (F1) that protrudes into the matrix. The Fo part consists of 12 membranespanning c-peptides and one a-subunit. The “head” of the F1 part is composed of three α and three β subunits, between which there are three active centers. The “stem” between Fo and F1 consists of one γ and one ε subunit. Two more polypeptides, b and δ, form a kind of “stator,”fixing the α and β subunitsrelative to the Fo part.
The catalytic cycle can be divided into three phases, through each ofwhich the three active sites pass in sequence. First, ADP and Pi are bound (1), then the anhydride bond forms (2), and finally the product is released (3). Each time protons pass through the Fo channel protein into the matrix, all three active sites change from their current state to the next. It has been shown that the energy for proton transport is initially converted into a rotation of the γ subunit, which in turn cyclically alters the conformation of the α and β subunits, which are stationary relative to the Fo part, and thereby drives ATP synthesis.

Energy Metabolism |
143 |
A. Redox systems of the respiratory chain
|
∆G' |
|
E' |
|
FMN/FMNH2 |
|
|
|
|
|
|
|
|
|
|
|
(kJ · mol–1) |
(V) |
|
|
|
|
|
|
|
|
|
|
|
||||
|
|
|
|
|
|
|
|
|
|
|
|
|
||||
|
|
|
NAD |
|
F |
F |
|
|
|
|
|
|
|
|
|
|
|
–0.4 |
|
|
|
|
|
|
|
|
|
|
|
|
|
|
|
|
|
N |
A |
|
I |
CoQ |
|
Hemes b |
|
|
|
|
||||
|
|
|
|
|
|
|
|
|
||||||||
|
|
|
|
|
|
|
|
|
|
|
||||||
0 |
|
|
|
|
|
|
(ubi- |
|
|
|
|
|
|
|
|
|
|
|
|
|
|
|
quinone) |
|
3+ |
|
2+ |
|
|
|
|
||
|
|
|
N |
A |
|
|
|
|
|
|
|
|
||||
|
–0.2 |
|
|
|
|
O |
|
|
|
|
|
|
|
|
||
|
|
|
NADH |
|
|
|
|
|
|
|
|
|
|
|
|
|
|
0 |
|
+H |
|
|
|
|
|
|
|
|
III |
|
|
|
|
|
|
|
|
|
|
|
O |
|
|
|
Cyto- |
|
|
|
||
|
|
|
|
|
|
|
|
OH |
|
|
|
chrome C |
|
Heme a |
||
|
|
|
|
|
|
|
|
|
|
|
|
|
Cu2 |
|||
|
|
|
|
|
|
|
|
|
|
|
|
|
|
3+ |
2+ |
|
|
+0.2 |
|
|
|
Fe/S centers |
|
|
|
|
|
3+ |
|
Cu |
|||
|
|
|
|
|
|
|
|
|
|
|
|
|
|
|||
|
|
|
|
|
|
|
|
OH |
|
|
|
|
|
|
IV |
|
|
|
|
|
|
|
|
|
|
|
|
2+ |
|
|
|
|
|
|
+0.4 |
|
|
|
|
|
|
|
|
|
|
|
|
|
|
|
|
|
|
|
|
|
|
Fe/S center |
|
|
|
|
|
Cu2 |
|||
|
|
|
|
|
|
|
|
|
|
|
|
|
||||
|
|
|
|
|
|
|
|
|
|
|
|
|
|
|
|
Cu |
|
+0.6 |
|
|
|
|
|
|
|
|
3+ |
|
2+ |
|
|
|
|
|
|
|
|
|
|
|
|
|
Heme c1 |
|
|
|
|
|||
|
|
|
|
|
|
|
|
|
|
|
|
|
|
|||
|
|
|
|
|
∆G = –n · F · ∆E |
|
|
|
|
|
|
3+ |
2+ |
|
O |
|
|
+0.8 |
|
|
|
|
|
|
|
|
|
|
|
|
|||
–220 |
|
|
|
|
|
|
|
|
|
|
|
Heme a3 |
O2 |
|||
|
|
|
|
|
|
|
|
|
|
|
|
|
||||
B. ATP synthase |
|
|
|
|
|
|
|
|
|
|
|
|
|
|||
|
|
|
|
|
Inside: |
|
|
|
|
|
A |
P |
|
|
|
|
|
|
|
|
|
|
|
|
|
|
P P |
2 |
Formation of ATP |
||||
|
|
|
|
|
matrix |
|
|
|
|
|
|
|
||||
|
|
|
|
|
|
|
|
|
|
|
A |
P P P |
H2O |
|
|
|
|
|
|
|
|
Outside: |
|
|
|
|
|
|
|
|
|||
|
|
|
|
|
|
|
|
|
|
H2O |
A |
|
|
|
||
|
|
|
|
|
|
|
|
|
|
P |
P P |
|
|
|||
|
|
|
|
|
Inter- |
|
|
|
|
|
|
|
||||
|
|
|
|
|
|
H |
|
|
|
|
|
|
|
H |
||
|
|
|
|
|
membrane |
|
|
|
|
|
|
|
|
|||
|
|
|
|
|
space |
|
outside |
|
|
|
|
|
|
|
outside |
|
|
|
δ |
α |
β |
α |
|
|
|
|
|
|
|
|
|
|
|
|
|
β |
α |
β |
F1 |
|
|
|
|
|
|
|
|
|
|
|
|
|
|
|
|
|
|
|
|
|
|
|
|
||||
|
|
|
|
|
|
|
|
|
|
|
|
|
|
|
||
|
|
|
|
|
|
|
A |
P P |
|
P |
|
H |
|
|
|
|
|
|
|
|
|
|
|
|
|
|
inside |
|
|
|
|||
|
|
|
|
|
|
H |
|
|
|
|
|
|
|
|
||
|
b2 |
|
|
|
ε |
|
|
|
|
|
|
|
|
|
|
|
|
|
|
|
|
|
A |
|
|
|
|
|
|
A |
|
||
|
|
|
|
|
|
|
|
P |
P |
P |
|
|
|
|
P |
P P |
|
|
|
|
|
|
γ |
|
|
|
|
|
|
A |
|
|
|
|
|
|
|
|
|
|
|
|
|
|
|
|
|
|
|
|
|
|
|
|
|
|
|
|
|
|
|
|
|
P P P |
|
|
|
|
a |
|
|
|
F0 |
|
|
|
H2O |
|
|
|
A |
|
H2O |
|
|
|
|
|
|
|
A |
P |
P P |
|
|
|
|
P P P |
|||
|
|
|
|
|
|
|
|
A |
|
|
|
|
|
A |
||
|
|
|
|
|
|
|
|
|
|
|
|
|
|
|
||
|
|
|
|
|
|
|
H |
O |
|
P P |
P |
|
|
|
H2O |
P P P |
|
|
|
|
|
|
|
|
|
|
|
|
|
|
|||
|
|
|
|
|
|
|
2 |
|
|
|
|
|
|
|
|
|
|
|
|
|
|
|
|
|
|
|
|
|
|
|
H2O |
|
|
|
|
|
|
|
|
1 Binding of ADP and Pi |
H |
|
3 |
Release of ATP |
||||||
|
|
|
|
|
|
H |
|
|
|
|
|
|
|
|
|
|
|
|
|
|
|
|
|
|
|
|
|
|
outside |
|
|
|
|
1. Structure and location |
2. Catalytic cycle |
|
|
|
|
|
|
|||||||||

144 Metabolism
Regulation
The amount of nutrient degradation and ATP synthesis have to be continually adjusted to the body’s changing energy requirements. The need to coordinate the production and consumption of ATP is already evident from the fact that the total amounts of coenzymes in the organism are low. The human body forms about 65 kg ATP per day, but only contains 3–4 g of adenine nucleotides (AMP, ADP, and ATP). Each ADP molecule therefore has to be phosphorylated to ATP and dephosphorylated again many thousand times a day.
A. Respiratory control
The simple regulatory mechanism which ensures that ATP synthesis is “automatically” coordinated with ATP consumption is known as respiratory control. It is based on the fact that the different parts of the oxidative phosphorylation process are coupled via shared coenzymes and other factors (left).
If a cell is not using any ATP, hardly any ADP will be available in the mitochondria. Without ADP, ATP synthase (3) is unable to break down the proton gradient across the inner mitochondrial membrane. This in turn inhibits electron transport in the respiratory chain (2), which means that NADH+H+ can no longer be reoxidized to NAD+. Finally, the resulting high NADH/NAD+ ratio inhibits the tricarboxylic acid cycle (C), and thus slows down the degradation of the substrate SH2 (1). Conversely, high rates of ATP utilization stimulate nutrient degradation and the respiratory chain via the same mechanism.
If the formation of a proton gradient is prevented (right), substrate oxidation (1) and electron transport (2) proceed much more rapidly. However, instead of ATP, only heat is produced.
B. Uncouplers
Substances that functionally separate oxidation and phosphorylation from one another are referred to as uncouplers. They break down the proton gradient by allowing H+ ions to pass from the intermembrane space back into the mitochondrial matrix without the involvement of ATP synthase. Uncoupling effects are produced by mechanical damage
to the inner membrane (1) or by lipid-soluble substances that can transport protons through the membrane, such as 2,4- dinitrophenol (DNP, 2). Thermogenin (uncoupling protein-1, UCP-1, 3)—an ion channel (see p. 222) in mitochondria of brown fat tis- sue—is a naturally occurring uncoupler. Brown fat is found, for example, in newborns and in hibernating animals, and serves exclusively to generate heat. In cold periods, norepinephrine activates the hormone-sensitive lipase (see p. 162). Increased lipolysis leads to the production of large quantities of free fatty acids. Like DNP, these bind H+ ions in the intermembrane space, pass the UCP in this form, and then release the protons in the matrix again. This makes fatty acid degradation independent of ADP availability—i.e., it takes place at maximum velocity and only produces heat (A). It is becoming increasingly clear that there are also UCPs in other cells, which are controlled by hormones such as thyroxine (see p. 374). This regulates the ATP yield and what is known as the basal metabolic rate.
C. Regulation of the tricarboxylic acid cycle
The most important factor in the regulation of the cycle is the NADH/NAD+ ratio. In addition to pyruvate dehydrogenase (PDH) and oxoglutarate dehydrogenase (ODH; see p. 134), citrate synthase and isocitrate dehydrogenase are also inhibited by NAD+ deficiency or an excess of NADH+H+. With the exception of isocitrate dehydrogenase, these enzymes are also subject to product inhibition by acetyl-CoA, suc- cinyl-CoA, or citrate.
Interconversion processes (see p. 120) also play an important role. They are shown here in detail using the example of the PDH complex (see p. 134). The inactivating protein kinase [1a] is inhibited by the substrate pyruvate and is activated by the products acetylCoA and NADH+H+. The protein phosphatase
[1b]—like isocitrate dehydrogenase [3] and the
ODH complex [4]—is activated by Ca2+. This is particularly important during muscle contraction, when large amounts of ATP are needed. Insulin also activates the PDH complex (through inhibition of phosphorylation) and thereby promotes the breakdown of glucose and its conversion into fatty acids.

|
|
|
Energy Metabolism |
145 |
A. Respiratory control |
|
|
|
|
AH2 |
A |
1 3 |
AH2 |
A |
1 |
|
Coupling |
1 |
|
|
points |
|
||
|
|
|
|
N |
|
A |
Dehydro- |
||
|
|
|
|
|
genases |
|
|
|
|
|
|
N |
A |
N |
A |
Dehydro- |
N |
A |
|
|
|
|
genases |
|
|
|
2 |
|
|
|
2 |
H |
Respira- |
H |
ATP syn- |
H |
H |
outside |
tory chain |
inside |
outside |
inside |
|
|
|
|
thesis |
|
|
|
|
|
uncoupled |
|
Heat |
|
3 |
|
from proton |
|
|
|
|
|
|
||
|
|
transport |
|
3 |
|
|
|
|
|
||
|
|
|
|
|
A |
P |
ATP |
A |
|
|
|
|
|
|
|
|
|
|
|
|
|
|
A |
P |
|
|
|
A |
|
|||
P |
P |
synthase |
P |
P |
P |
|
|
|
|
|
|||
|
|
|
|
|
|
|
P P |
|
|
|
|
P P |
P |
|
|
Endergonic |
|
|
|
|
|
|
Endergonic |
|
|
||
|
|
processes |
|
|
|
|
|
|
|
|
|||
|
|
|
|
|
|
|
|
|
processes |
|
|
||
1. Coupled |
|
|
|
|
2. Uncoupled |
|
|
|
|
|
|
||
B. Uncouplers |
|
|
|
C. Regulation of the |
|
|
|
|
|||||
|
|
|
|
|
|
tricarboxylic acid cycle |
|
|
|
|
|||
1. Membrane |
|
|
H |
Insulin |
Pyruvate |
|
|
|
|||||
damage |
H |
|
|
|
|
|
|
|
|
|
|
||
|
|
|
|
|
|
|
1a |
|
|
|
1b |
Ca2 |
|
|
|
H |
|
|
|
|
|
|
|
|
|
|
|
|
|
O |
NO2 |
|
NO2 |
|
|
|
|
|
|
NADH |
|
2. Mobile |
|
|
|
|
|
Acetyl CoA |
|
|
|
||||
carriers |
|
O2N |
|
|
|
|
|
|
|
2 |
|
|
|
|
|
NO2 |
|
OH |
|
|
|
|
|
|
|
||
|
|
|
|
|
Oxalo- |
|
|
|
|
|
|||
2,4-Dinitrophenol |
|
|
|
|
|
|
|
Citrate |
|
||||
|
|
|
|
acetate |
|
|
|
|
|||||
Inner |
|
|
|
|
H |
|
|
|
|
|
|
|
|
|
|
|
|
|
|
|
|
|
|
|
|
|
|
mitochochondrial |
|
|
|
Most important |
|
|
|
|
Isocitrate |
||||
membrane |
|
|
|
|
factor: con- |
|
|
N |
A |
|
|
||
|
|
|
|
|
|
|
|
|
|
|
|
||
|
|
|
|
|
|
centration ratio |
|
NADH |
|
|
|||
|
|
|
|
|
|
[NADH] / [NAD |
] |
|
|
||||
|
|
|
|
|
|
|
|
|
3 |
|
|||
|
|
|
|
|
|
|
|
|
|
|
|
|
|
Norepinephrine |
|
|
|
|
|
|
|
|
|
|
|
||
|
|
|
|
|
|
|
|
|
|
|
|
2-Oxo- |
|
|
|
|
|
|
|
|
Succinyl |
|
|
|
glutarate |
|
|
Fat |
|
Fatty |
|
|
H |
|
CoA |
|
|
4 |
Ca2 |
|
|
|
acids |
|
|
|
|
|
|
|
|
|
|||
|
|
H |
|
|
|
1a |
PDH kinase |
|
3 |
Isocitrate dehydro- |
|
||
|
|
|
|
|
2.7.1.99 |
|
genase |
1.1.1.42 |
|
||||
|
|
|
|
Thermo- |
|
|
|
||||||
|
|
|
|
|
|
|
|
|
|
|
|
|
|
3. Gated proton |
|
|
genin |
1b |
PDH phosphatase |
|
2-Oxoglutarate |
|
|||||
|
|
(UCP1) |
4 |
|
|||||||||
channels |
|
|
3.1.3.43 |
|
dehydrogenase 1.2.4.2, |
||||||||
|
|
|
|
|
|
|
1.8.1.4,2.3.1.61 |
|
|||||
|
|
|
|
|
|
|
|
|
|
|
|||
|
|
|
|
|
|
2 |
Citrate synthase |
|
|
|
|
|
|
|
|
|
|
|
|
4.1.3.7 |
|
|
|
|
|
|
|
|
|
|
|
|
|
|
|
|
|
|
|
|
|

146 Metabolism
Respiration and fermentation
A. Aerobic and anaerobic oxidation of glucose
In the presence of oxygen (i.e., in aerobic conditions), most animal cells are capable of “respiring” various types of nutrient (lipids, amino acids, and carbohydrates)—i.e., using oxidative processes to break them down completely. If oxygen is lacking (i.e., in anaerobic conditions), only glucose can be used for ATP synthesis. Although in these conditions glucose breakdown in animals already ends in lactate and only produces small quantities of ATP, it is decisively important for the survival of cells at times of oxygen deficiency.
In aerobic conditions (left), ATP is derived almost exclusively from oxidative phosphorylation (see p. 140). Fatty acids enter the mitochondria with the help of carnitine (see p. 164), and are broken down there into CoAbound acetyl residues. Glucose is converted into pyruvate by glycolysis (see p. 150) in the cytoplasm. Pyruvate is then also transported into the mitochondrial matrix, where it is oxidatively decarboxylated by the pyruvate dehydrogenase complex (see p. 134) to yield acetyl-CoA. The reducing equivalents (2 NADH+H+ per glucose) that arise in glycolysis enter the mitochondrial matrix via the malate shuttle (see p. 212). The acetyl residues that are formed are oxidized to CO2 in the tricarboxylic acid cycle (see p. 136). Breakdown of amino acids also produces acetyl residues or products that can directly enter the tricarboxylic acid cycle (see p. 180). The reducing equivalents that are obtained are transferred to oxygen via the respiratory chain as required. In the process, chemical energy is released, which is used (via a proton gradient) to synthesize ATP (see p. 140).
In the absence of oxygen—i.e., in anaerobic conditions—the picture changes completely. Since O2 is missing as the electron acceptor for the respiratory chain, NADH+H+ and QH2 can no longer be reoxidized. Consequently, not only is mitochondrial ATP synthesis halted, but also almost the whole metabolism in the mitochondrial matrix. The main reason for this is the high NADH+H+ concentration and lack of NAD+, which inhibit the tricarbox-
ylic acid cycle and the pyruvate dehydrogenase reaction (see p. 144). β-Oxidation and the malate shuttle, which are dependent on free NAD+, also come to a standstill. Since amino acid degradation is also no longer able to contribute to energy production, the cell becomes totally dependent on ATP synthesized via the degradation of glucose by glycolysis. For this process to proceed continuously, the NADH+H+ formed in the cytoplasm has to be constantly reoxidized. Since this can no longer occur in the mitochondria, in anaerobic conditions animal cells reduce pyruvate to lactate and pass it into the blood. This type of process is called fermentation (see p. 148). The ATP yield is low, with only two ATPs per glucose arising during lactate synthesis.
To estimate the number of ATP molecules formed in an aerobic state, it is necessary to know the P/O quotient—i.e., the molar ratio between synthesized ATP (“P”) and the water formed (“O”). During transport of two electrons from NADH+H+ to oxygen, about 10 protons are transported into the intermembrane space, while from ubiquinol (QH2), the number is only six. ATP synthase (see p. 142) probably requires three H+ to synthesize one ATP, so that maximum P/O quotients of around 3 or 2 are possible. This implies a yield of up to 38 ATP per mol of glucose. However, the actual value is much lower. It needs to be taken into account that the transport of specific metabolites into the mitochondrial matrix and the exchange of ATP4– for ADP3– are also driven by the proton gradient (see p. 212). The P/O quotients for the oxidation of NADH+H+ and QH2 are therefore more in the range of 2.5 and 1.5. If the energy balance of aerobic glycolysis is calculated on this basis, the result is a yield of around 32 ATP per glucose. However, this value is also not constant, and can be adjusted as required by the cell’s own uncouplers (UCPs; see p. 144) and other mechanisms.

|
|
|
|
|
|
|
|
|
|
|
Energy Metabolism |
147 |
|||
A. Aerobic and anaerobic oxidation of glucose |
|
|
|
|
|
|
|
||||||||
Glucose |
1 |
|
2 |
|
|
Glucose |
1 |
|
|
2 |
|
||||
|
|
|
A |
|
A |
|
|
|
|
A |
|
|
A |
|
|
Glyco- |
P P P |
|
P P P |
|
|
|
|
|
P P P |
|
|
P P P |
|
||
|
|
|
|
|
|
|
|
|
|
|
|
|
|||
lysis |
|
|
|
|
|
|
|
|
|
|
|
|
|
|
|
|
|
|
2 PEP |
4 |
3 |
|
|
|
|
2 |
PEP |
4 |
|
3 |
|
2 A |
|
|
P |
|
|
|
|
2 A |
|
P |
|
|
|
|
|
P |
P |
|
|
|
|
|
P |
P |
|
|
|
|
|
||
|
|
|
5 |
2 N |
A |
2 N |
A |
|
|
5 |
2 N |
A |
2 N |
A |
|
2 A |
P |
P |
P |
|
|
|
|
2 A |
P |
P P |
|
|
|
|
|
|
|
|
2 Pyruvate |
|
|
|
|
|
|
2 Pyruvate |
|
|
6 |
|
|
|
|
|
|
|
|
|
|
|
|
|
|
|
|
2 |
Lactate |
|
|
|
|
|
Malate shuttle |
|
|
|
|
|
|
|
|||
|
|
|
Pyruvate |
|
|
|
|
|
|
Pyruvate |
|
|
|
|
|
|
|
|
7 |
|
|
|
|
|
|
|
7 |
|
|
|
|
|
|
|
|
|
|
|
|
|
|
|
|
|
|
|
|
N |
A |
|
Acetyl |
N |
A |
|
|
N |
A |
|
Acetyl |
N |
A |
|
|
|
|
|
CoA |
|
|
|
|
|
|
|
CoA |
|
|
|
|
|
|
|
|
|
H |
|
|
Tricarboxylic |
|
|
|
H |
|
||
|
|
|
8 |
|
|
|
acid cycle |
8 |
|
|
|
||||
|
|
|
|
|
|
|
|
|
|
|
|||||
|
|
|
|
|
|
|
inhibited due |
|
|
|
|
||||
|
|
|
9 |
|
|
|
|
to high ratio of |
9 |
|
|
|
|
||
|
|
|
|
|
|
|
NADH/NAD |
|
|
|
|
||||
|
|
|
10 |
|
|
|
|
10 |
|
|
|
|
|||
|
|
|
|
H |
|
|
|
|
|
|
|
H |
|
||
|
|
|
11 |
|
|
|
|
|
|
|
11 |
|
|
|
|
|
|
|
12 |
|
|
|
|
|
|
12 |
|
|
|
|
|
2 GTP |
|
|
O2 |
H |
|
|
|
|
|
|
O2 |
H |
|
||
|
|
|
|
|
|
|
|
|
|
|
|
|
|
||
|
|
|
|
H2O |
|
|
|
|
|
|
|
|
|
|
|
A |
|
|
|
A |
P |
|
|
A |
|
|
|
A |
|
P |
|
|
|
|
|
|
|
|
|
|
|
|
|
||||
P |
P |
P |
|
P P |
|
|
|
P P |
P |
|
|
P |
P |
|
|
1. Aerobic |
|
|
|
|
2. Anaerobic |
|
|
|
|
|
|||||
ATP |
|
Coenzymes |
|
|
|
Enzymes |
|
|
|
Coenzymes |
ATP |
||||
–1 |
|
|
–1 ATP |
1 |
Hexokinase |
|
|
–1 ATP |
|
|
–1 |
||||
–2 |
|
|
–1 ATP |
2 |
6-Phosphofructokinase |
–1 ATP |
|
|
–2 |
||||||
+3 |
|
|
+5 ATP |
+2 NADH |
3 |
Glyceraldehyde-3 P DH |
+2 NADH |
|
|
–2 |
|||||
+5 |
|
|
|
+2 ATP |
4 |
Phosphoglycerate kinase |
+2 ATP |
|
NAD |
0 |
|||||
+7 |
|
|
|
+2 ATP |
5 |
Pyruvate kinase |
|
|
+2 ATP |
recycled |
+2 |
||||
|
|
|
|
|
|
6 |
Lactate dehydrogenase |
–2 NADH |
|
|
|
||||
+12 |
|
|
+5 ATP |
+2 NADH |
7 |
Pyruvate dehydrogenase |
|
|
|
|
|
||||
+17 |
|
|
+5 ATP |
+2 NADH |
8 |
Isocitrate dehydrogenase |
|
|
|
|
|
||||
+22 |
|
|
+5 ATP |
+2 NADH |
9 |
Oxoglutarate dehydrogenase |
|
|
|
|
|||||
+27 |
|
|
+5 ATP |
+2 NADH |
10 |
Malate dehydrogenase |
|
|
|
|
|
||||
+30 |
|
|
+3 ATP |
+2 QH2 |
11 |
Succinate dehydrogenase |
|
|
|
|
|
||||
+32 |
|
|
+2 ATP |
+2 GTP |
12 |
Succinate-CoA ligase |
|
|
|
|
|
||||
Sum: 32 ATP/glucose |
|
|
|
DH = dehydrogenase |
|
|
Sum: 2 ATP/glucose |
||||||||
|
|
|
|
|
|
|
|
|
|||||||

148 Metabolism
Fermentations
As discussed on p. 146, degradation of glucose to pyruvate is the only way for most organisms to synthesize ATP in the absence of oxygen. The NADH+H+ that is also formed in this process has to be constantly reoxidized to NAD+ in order to maintain glycolysis and thus ATP synthesis. In the animal organism, this is achieved by the reduction of pyruvate to lactate. In microorganisms, there are many other forms of NAD+ regeneration. Processes of this type are referred to as fermentations. Microbial fermentation processes are often used to produce foodstuffs and alcoholic beverages, or to preserve food. Features common to all fermentation processes are that they start with pyruvate and only occur under anaerobic conditions.
A. Lactic acid and propionic acid fermentation
Many milk products, such as sour milk, yogurt, and cheese are made by bacterial lactic acid fermentation (1). The reaction is the same as in animals. Pyruvate, which is mainly derived from degradation of the disaccharide lactose (see p. 38), is reduced to lactate by lactate dehydrogenase [1]. Lactic acid fermentation also plays an important role in the production of sauerkraut and silage. These products usually keep for a long time, because the pH reduction that occurs during fermentation inhibits the growth of putrefying bacteria.
Bacteria from the genera Lactobacillus and Streptococcus are involved in the first steps of dairy production (3). The raw materials produced by their effects usually only acquire their final properties after additional fermentation processes. For example, the characteristic taste of Swiss cheese develops during a subsequent propionic acid fermentation. In this process, bacteria from the genus Propionibacterium convert pyruvate to propionate in a complex series of reactions (2).
B. Alcoholic fermentation
Alcoholic beverages are produced by the fermentation of plant products that have a high carbohydrate content. Pyruvate, which is formed from glucose, is initially decarboxy-
lated by pyruvate decarboxylase [2], which does not occur in animal metabolism, to produce acetaldehyde (ethanal). When this is reduced by alcohol dehydrogenase [3], with NADH being consumed, ethanol [3] is formed.
Yeasts, unicellular fungi that belong to the eukaryotes (3), rather than bacteria, are responsible for this type of fermentation. Yeasts are also often used in baking. They produce CO2 and ethanol, which raise the dough. Brewers’ and bakers’ yeasts (Saccharomyces cerevisiae) are usually haploid and reproduce asexually by budding (3). They can live both aerobically and anaerobically. Wine is produced by other types of yeast, some of which already live on the grapes. To promote the formation of ethanol, efforts are made to generally exclude oxygen during alcoholic fer- mentation—for example, by covering dough with a cloth when it is rising and by fermenting liquids in barrels that exclude air.
C. Beer brewing
Barley is the traditional starting material for the brewing of beer. Although cereal grains contain starch, they hardly have any free sugars. The barley grains are therefore first allowed to germinate so that starch-cleaving amylases are formed. Careful warming of the sprouting grain produces malt. This is then ground, soaked in water, and kept warm for a certain time. In the process, a substantial proportion of the starch is broken down into the disaccharide maltose (see p. 38). The product (the wort) is then boiled, yeast and hops are added, and the mixture is allowed to ferment for several days. The addition of hops makes the beer less perishable and gives it its slightly bitter taste. Other substances contained in hops act as sedatives and diuretics.
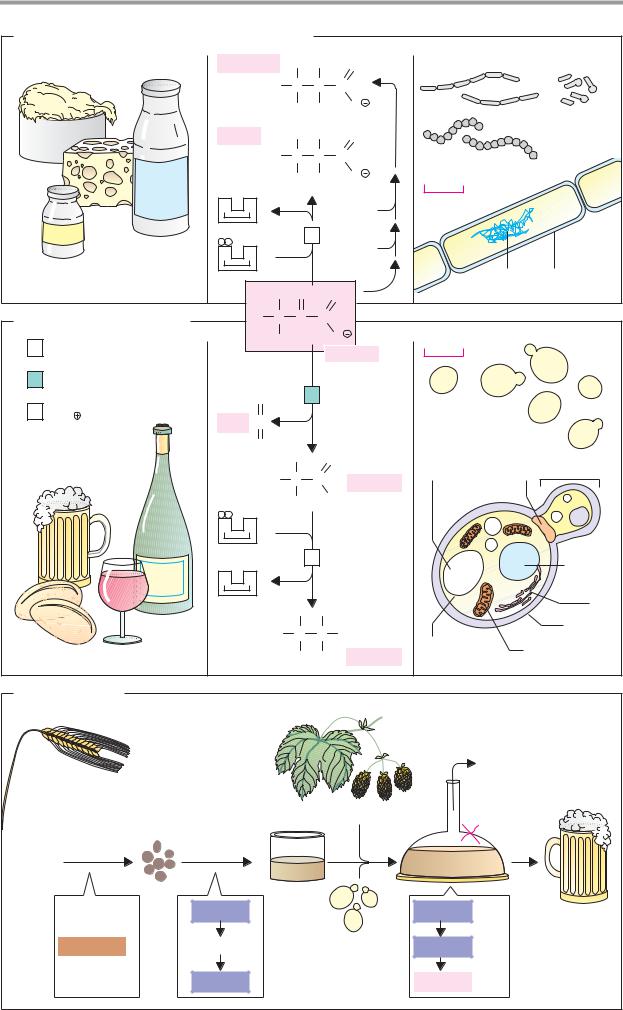
|
|
|
|
|
|
|
|
|
|
|
|
|
|
|
Energy Metabolism |
149 |
||
A. Lactic acid and propionic acid fermentation |
|
|
|
|
|
|
||||||||||||
|
|
|
|
|
|
|
1. |
Propionate |
H |
H |
O |
2. |
Lactobacillus |
|
3. |
|||
|
|
|
|
|
|
|
|
|
|
H |
C |
C |
C |
|
|
|
|
|
|
|
|
|
|
|
|
|
|
|
|
H |
H |
O |
|
|
|
Propioni- |
|
Sa |
|
t |
|
|
|
|
|
|
|
|
|
|
|
|
|
|
||
|
|
|
|
|
|
Lactate |
|
H |
OH |
O |
|
|
|
bacterium |
||||
rau |
|
|
|
|
|
|
|
|
|
|
|
|
|
|||||
uerk |
|
|
|
|
|
|
|
|
|
|
|
|
|
|
|
|
|
|
|
|
Sour |
|
|
|
H |
C |
C |
C |
|
Streptococcus |
|
|
|||||
|
|
|
|
|
|
|
|
|
|
|
|
|||||||
|
|
|
|
|
|
H |
H |
O |
|
10 m |
|
|
|
|||||
|
|
|
i |
|
|
|
|
|
|
|
|
|
|
|
||||
|
|
|
|
|
|
|
|
|
|
|
|
|
|
|
|
|
|
|
|
|
m lk |
|
|
N |
A |
|
|
|
2[H] |
|
|
|
|
|
|||
|
|
|
|
|
|
|
|
|
|
|
|
|
|
|
|
|||
|
|
|
|
|
|
|
|
|
|
|
|
|
|
|
|
|
|
|
|
Yogurt |
|
|
|
|
|
|
|
|
|
|
1 |
2[H] |
|
|
|
|
|
|
|
|
|
|
|
|
|
N |
A |
|
|
|
|
|
|
|
|
|
|
|
|
|
|
|
|
|
|
|
|
|
|
|
|
|
|
||
|
|
|
|
|
|
|
|
|
|
|
|
|
|
|
|
DNA |
Cell wall |
|
|
|
|
|
|
|
|
|
|
|
H |
O |
O |
|
|
|
|
|
|
B. Alcoholic fermentation |
|
|
H |
C |
C |
C |
|
|
|
|
|
|
||||||
1 |
1.1.1.27Lactate dehydrogenase |
|
|
1. |
|
|
H |
|
O |
2. |
10 m |
|
|
3. |
||||
|
|
|
|
|
Pyruvate |
|
|
|||||||||||
2 |
Pyruvate decarboxylase |
|
|
|
|
|
|
|
|
|
|
|
|
|
|
|||
|
[TPP] 4.1.1.1 |
|
|
|
|
|
|
O |
|
|
2 |
|
|
|
|
|
|
|
3 |
Alcohol dehydrogenase |
|
|
|
|
|
|
|
|
Yeast |
|
|
|
|||||
|
|
|
|
|
|
|
|
|
|
|
|
|
||||||
|
[Zn2 |
] 1.1.1.1 |
|
|
|
|
|
CO2 |
C |
|
|
|
|
|
(Saccharomyces |
|
|
|
|
|
|
|
|
|
|
|
|
O |
|
|
|
|
|
cerevisiae) |
|
|
|
|
|
|
|
|
|
|
|
|
|
H |
O |
|
|
|
|
|
|
|
|
|
|
|
|
|
|
|
|
|
|
|
|
Vacuole |
Septum |
Daughter cell |
|||
|
|
|
|
|
|
|
|
|
|
H |
C |
C |
Ethanal |
|||||
|
|
|
|
|
|
|
|
|
|
|
|
|
|
|||||
|
|
|
|
|
|
|
|
|
|
|
H |
H |
(Acet- |
|
|
|
|
|
|
|
|
|
|
|
|
|
N |
A |
|
|
|
aldehyde) |
|
|
|
|
|
|
|
|
|
|
|
|
|
|
|
|
|
|
|
|
|
|
||
|
|
|
|
|
|
e |
|
|
|
|
|
3 |
|
|
|
|
|
Nucleus |
|
|
|
|
|
n |
|
|
|
|
|
|
|
|
|
|
|
|
|
|
|
|
|
g |
|
|
|
|
|
|
|
|
|
|
|
|
|
|
|
|
|
a |
|
|
|
N |
A |
|
|
|
|
|
|
|
|
|
|
|
|
|
p |
|
|
|
|
|
|
|
|
|
|
|
|
|
||
|
|
|
m |
|
|
|
|
|
|
|
|
|
|
|
|
|
|
|
|
|
a |
|
|
|
|
|
|
|
|
|
|
|
|
|
|
|
|
|
|
h |
|
|
|
|
|
|
|
|
|
|
|
|
|
|
|
ER |
|
|
|
|
|
|
|
|
|
|
|
H |
H |
|
|
|
|
|
|
|
|
|
|
|
|
|
|
|
|
|
|
|
|
|
|
Cell wall |
||
|
|
|
|
|
|
|
|
|
|
H |
C |
C |
OH |
|
|
|
|
|
|
|
|
|
|
|
|
|
|
|
|
|
|
|
|
||||
|
|
|
|
|
|
|
|
|
|
|
H |
H |
Ethanol |
Tonoplast |
Mitochondrium |
|||
|
|
|
|
|
|
|
|
|
|
|
|
|
|
|
||||
C. Beer brewing
|
|
|
CO2 |
Germinate, |
Malt Grind, |
Wort |
Hops |
dry |
incubate |
|
O2 |
|
in water |
|
|
Barley |
|
|
Fermentation |
Starch |
Amylases |
|
Amylases |
Yeast |
formed in |
|
Maltose |
|
seedling |
1. |
||
2. |
Maltose |
Glucose |
Ethanol + CO2 |
3. |
|

150 Metabolism
Glycolysis
A. Balance
Glycolysis is a catabolic pathway in the cytoplasm that is found in almost all organisms— irrespective of whether they live aerobically or anaerobically. The balance of glycolysis is simple: glucose is broken down into two molecules of pyruvate, and in addition two molecules of ATP and two of NADH+H+ are formed.
In the presence of oxygen, pyruvate and NADH+H+ reach the mitochondria, where they undergo further transformation (aerobic glycolysis; see p. 146). In anaerobic conditions, fermentation products such as lactate or ethanol have to be formed in the cytoplasm from pyruvate and NADH+H+, in order to regenerate NAD+ so that glycolysis can continue (anaerobic glycolysis; see p. 146). In the anaerobic state, glycolysis is the only means of obtaining ATP that animal cells have.
B. Reactions
Glycolysis involves ten individual steps, including three isomerizations and four phosphate transfers. The only redox reaction takes place in step [6].
[1]Glucose, which is taken up by animal cells from the blood and other sources, is first phosphorylated to glucose 6-phosphate, with ATP being consumed. The glucose 6-phos- phate is not capable of leaving the cell.
[2]In the next step, glucose 6-phosphate is isomerized into fructose 6-phosphate.
[3]Using ATP again, another phosphorylation takes place, giving rise to fructose 1,6- bisphosphate. Phosphofructokinase is the most important key enzyme in glycolysis (see p. 144).
[4]Fructose 1,6-bisphosphate is broken
down by aldolase into the C3 compounds glyceraldehyde 3-phosphate (also known as glyceral 3-phosphate) and glycerone 3-phosphate
(dihydroxyacetone 3-phosphate).
[5]The latter two products are placed in fast equilibrium by triosephosphate isomerase.
[6]Glyceraldehyde 3-phosphate is now
oxidized by glyceraldehyde-3-phosphate dehydrogenase, with NADH+H+ being formed. In this reaction, inorganic phosphate is taken up into the molecule (substrate-level phos-
phorylation; see p. 124), and 1,3-bisphos- phoglycerate is produced. This intermediate contains a mixed acid–anhydride bond, the phosphate part of which is at a high chemical potential.
[7]Catalyzed by phosphoglycerate kinase, this phosphate residue is transferred to ADP, producing 3-phosphoglycerate and ATP. The ATP balance is thus once again in equilibrium.
[8]As a result of shifting of the remaining phosphate residue within the molecule, the isomer 2-phosphoglycerate is formed.
[9]Elimination of water from 2-phospho- glycerate produces the phosphate ester of the enol form of pyruvate—phosphoenolpyruvate
(PEP). This reaction also raises the second phosphate residue to a high potential.
[10]In the last step, pyruvate kinase transfers this residue to ADP. The remaining enol pyruvate is immediately rearranged into pyruvate, which is much more stable. Along with step [7] and the thiokinase reaction in the tricarboxylic acid cycle (see p. 136), the pyruvate kinase reaction is one of the three reactions in animal metabolism that are able to produce ATP independently of the respiratorychain.
In glycolysis, two molecules of ATP are initially used for activation ([1], [3]). Later, two
ATPs are formed per C3 fragment. Overall, therefore, there is a small net gain of 2 mol ATP per mol of glucose.
C. Energy profile
Theenergybalanceofmetabolic pathways depends not only on the standard changes in enthalpy ∆G0, but also on the concentrations of the metabolites (see p. 18). Fig. C shows the actual enthalpy changes ∆G for the individual steps of glycolysis in erythrocytes.
As can be seen, only three reactions ([1], [3], and [10]), are associated with large changes in free enthalpy. In these cases, the equilibrium lies well on the side of the products (see p. 18). All of the other steps are freely reversible. The same steps are also fol- lowed—in the reverse direction—in gluconeogenesis (see p. 154), with the same enzymes being activated as in glucose degradation. The non-reversible steps [1], [3], and [10] are bypassed in glucose biosynthesis (see p. 154).

|
|
|
|
|
|
|
|
Carbohydrate Metabolism |
151 |
|||
A. Glycolysis: balance |
|
|
|
|
|
|
|
|
|
|||
HO |
CH2 |
|
2 |
N |
A |
|
2 |
N |
A |
|
|
|
|
|
|
|
|
|
|
COO |
COO |
||||
H |
|
O OH |
|
|
|
|
|
|
||||
H |
|
|
|
|
|
|
|
|
|
|
||
|
|
|
|
|
|
Glycolysis |
|
C |
O |
C |
O |
|
|
OH H |
|
|
|
|
|
||||||
HO |
H |
H |
|
|
|
|
∆GOI = –35 kJ · mol–1 |
|
CH3 |
CH3 |
||
|
OH |
2 |
A |
P |
P |
2 |
A |
P P P |
|
|
|
|
|
|
|
|
|
|
|
|
|
|
|||
Glucose |
|
2 |
P |
|
|
|
Pyruvate |
Pyruvate |
||||
|
|
|
|
|
|
|
|
|
|
|
||
B. Reactions
|
|
|
|
|
|
|
Glucose |
|
|
|
|
Fructose |
|
|
|
|
Fructose |
|
|
||||
|
Glucose |
|
|
|
6-phosphate |
|
|
|
6-phosphate |
|
|
|
1,6-bisphosphate |
||||||||||
HO |
CH2 |
|
|
|
P |
O |
CH2 |
|
|
P |
O |
CH2 |
OH |
|
P |
O |
CH2 |
OH |
|
||||
|
H |
|
O OH |
|
|
|
H |
|
O OH |
|
|
O |
|
|
|
O |
|
||||||
|
H |
|
|
|
H |
|
|
H HO |
|
|
|
|
H HO |
|
|
|
|||||||
|
|
|
|
|
|
|
|
|
|
|
|
|
|
|
|
|
|
||||||
|
|
OH H |
1 |
|
|
OH H |
|
2 |
H |
CH2OH |
|
3 |
|
H |
CH2 O |
P |
|||||||
|
HO |
|
H |
|
|
|
HO |
|
H |
|
|
|
|
|
|||||||||
|
|
|
|
|
|
|
|
OH H |
|
|
|
|
OH H |
|
|
|
|||||||
|
|
H |
OH |
|
|
|
|
H |
OH |
|
|
|
|
|
|
|
|
|
|
||||
|
|
|
|
|
|
|
|
|
|
|
|
|
|
|
|
|
|
|
|
||||
|
|
|
A |
|
|
A |
|
|
|
|
|
|
|
|
|
A |
|
A |
|
|
|
|
|
|
|
|
P |
P |
P |
|
P P |
|
|
|
|
|
|
|
|
|
P P |
P |
P P |
|
|
|
|
|
|
|
|
|
|
|
2 |
|
|
2 |
A |
|
|
2 |
2 |
|
|
|
|
4 |
|
|
|
|
|
|
|
|
|
|
A |
|
|
N |
A |
N |
A |
|
|
|
|
|
|
|
|||
|
|
|
|
|
|
|
P |
P P |
|
P P |
|
|
|
|
|
|
|
||||||
|
|
|
|
|
|
|
|
|
|
|
|
|
|
|
|
|
|
|
|||||
O |
|
O |
|
|
|
O |
O |
|
|
|
O |
|
O P |
|
|
O |
|
H |
|
|
|
|
|
|
C |
|
|
|
|
C |
|
|
|
|
|
C |
|
|
|
|
C |
|
|
|
|
H2C |
OH |
|
|
|
|
|
|
|
|
|
|
|
|
|
|
|
|
|
|
|
|
|
|
||
|
HC |
O |
P 8 |
|
|
HC |
OH |
|
7 |
|
HC |
OH |
6 |
|
HC |
OH |
|
5 |
|
C |
O |
||
H2C OH |
|
|
H2C O P |
|
|
H2C O P |
|
2 P |
H2C O P |
P |
O CH2 |
||||||||||||
2 glycerate2-Phospho- |
|
|
3-Phospho- |
|
|
1,3-Bisphospho- |
|
|
Glyceraldehyde |
Glycerone |
|||||||||||||
|
|
|
|
|
|
|
|||||||||||||||||
|
|
2 glycerate |
|
|
2 glycerate |
|
|
|
3-phosphate |
3-phosphate |
|||||||||||||
|
9 |
|
2 H2O |
|
|
|
|
|
|
|
|
|
C. Energy profile |
|
|
|
|
|
|
||||
|
|
|
|
|
|
|
|
|
|
|
|
|
|
|
|
|
|
||||||
O |
|
O |
|
|
|
|
|
O |
|
O |
|
|
0 |
|
|
|
|
|
|
|
|
|
|
C |
|
|
|
|
|
C |
|
|
|
|
|
|
|
Steps 1, 3 and 10 |
|
||||||||
|
|
|
|
|
|
|
|
|
|
|
|
|
A |
|
|
|
|||||||
|
|
|
|
|
|
|
|
|
|
|
|
|
|
P |
P P |
are bypassed in |
|
|
|||||
|
|
|
|
|
|
|
|
|
|
|
|
|
|
|
|
|
|
|
|
||||
|
C |
O |
P |
|
|
10 |
|
|
C |
O |
|
|
|
1 |
|
|
|
gluconeogenesis |
|
||||
|
|
|
|
|
|
|
|
|
|
|
|
|
|
|
|
|
|
|
|
|
|
|
|
|
CH2 |
|
|
|
|
|
|
CH3 |
|
|
-20 |
|
A |
P |
P |
|
|
|
|
|
|
||
2 Phospho- |
|
|
|
|
2 Pyruvate |
|
|
|
|
|
|
|
|
|
|
|
|
||||||
|
enolpyruvate2 A |
P |
P 2 A |
P |
P P |
|
|
|
|
|
|
|
2 |
|
|
A |
|
|
|
|
|||
|
|
|
|
|
|
|
|
|
|
|
|
|
|
|
|
|
|
A |
P P |
|
P |
|
|
|
|
|
|
|
|
|
|
|
|
|
|
|
-40 |
P |
P P |
|
|
|
P P |
|
|
||
|
|
|
|
|
|
|
|
|
|
|
|
|
|
|
|
|
|
|
|
|
|||
|
|
|
|
|
|
|
|
|
|
|
|
|
|
A |
|
|
|
|
|
|
|
|
|
1 |
Hexokinase 2.7.1.1 |
|
|
6 |
Glyceraldehyde- |
|
|
|
|
|
|
|
|
|
|
|
|||||||
|
|
3- P dehydro- |
|
|
|
|
|
|
|
|
|
|
|
|
|||||||||
|
|
|
|
|
|
|
|
|
|
|
|
3 |
|
|
|
|
|
|
|
||||
2 |
Glucose 6-phosphate |
|
genase 1.2.1.12 |
|
|
|
|
5 |
|
|
8 |
|
9 |
|
|||||||||
Isomerase 5.3.1.9 |
|
|
|
Phosphoglycerate |
|
A |
|
|
|
|
|
|
|||||||||||
|
|
|
7 |
|
|
|
|
|
|
|
|
|
|
||||||||||
|
|
|
|
|
|
|
|
P |
P |
|
|
|
|
|
|
|
|
||||||
|
6-Phosphofructo- |
|
|
kinase 2.7.2.3 |
|
|
|
|
|
|
|
|
|
|
|
|
|||||||
3 |
|
|
|
|
-60 |
|
|
|
|
|
|
|
|
|
|
||||||||
kinase 2.7.1.11 |
|
|
|
|
Phosphoglycerate |
|
|
4 |
|
|
|
|
|
|
|
||||||||
|
|
|
|
8 |
|
|
|
|
6 |
7 |
A |
|
|
|
|||||||||
4 |
Fructose bisphosphate |
mutase 5.4.2.1 |
|
|
|
|
|
|
|
P |
P |
|
|||||||||||
|
|
|
|
|
|
|
|
|
|
|
|
|
|
|
10 |
|
|||||||
aldolase 4.1.2.13 |
|
|
|
9 |
Phosphopyruvate |
|
|
|
|
|
|
A |
|
|
|||||||||
|
|
|
|
|
|
|
|
|
|
|
|
|
|
|
|
||||||||
|
Triose-phosphate |
|
|
hydratase 4.2.1.11 |
|
|
|
|
|
|
|
P |
P |
P |
|
||||||||
|
|
|
|
|
|
|
|
|
|
|
|
|
|
|
|
||||||||
5 |
|
|
|
|
|
|
|
|
-80 |
|
|
|
|
|
|
|
|
|
|
||||
isomerase 5.3.1.1 |
|
|
|
Pyruvate kinase |
|
|
|
|
|
|
|
|
|
|
|
||||||||
|
|
|
10 |
|
|
|
|
|
|
|
|
|
Pyruvate |
||||||||||
|
|
|
|
|
|
|
|
∆G' (kJ · mol-1) |
|
|
|
|
|
|
|||||||||
|
|
|
|
|
|
|
2.7.1.40 |
|
|
|
|
|
|
|
|
|
|||||||
152 Metabolism
Pentose phosphate pathway
The pentose phosphate pathway (PPP, also known as the hexose monophosphate pathway) is an oxidative metabolic pathway located in the cytoplasm, which, like glycolysis, starts from glucose 6-phosphate. It supplies two important precursors for anabolic pathways: NADPH+H+, which is required for the biosynthesis of fatty acids and isoprenoids, for example (see p. 168), and ribose 5- phosphate, a precursor in nucleotide biosynthesis (see p. 188).
A. Pentose phosphate pathway: oxidative part
The oxidative segment of the PPP converts glucose 6-phosphate to ribulose 5-phosphate. One CO2 and two NADPH+H+ are formed in the process. Depending on the metabolic state, the much more complex regenerative part of the pathway (see B) can convert some of the pentose phosphates back to hexose phosphates, or it can pass them on to glycolysis for breakdown. In most cells, less than 10% of glucose 6-phosphate is degraded via the pentose phosphate pathway.
B. Reactions
[1] The oxidative part starts with the oxidation of glucose 6-phosphate by glucose-6- phosphate dehydrogenase. This forms NADPH+H+ for the first time. The second product, 6-phosphogluconolactone, is an intramolecular ester (lactone) of 6-phospho- gluconate.
[2] A specific hydrolase then cleaves the lactone, exposing the carboxyl group of
6-phosphogluconate.
[3] The last enzyme in the oxidative part is phosphogluconate dehydrogenase [3], which releases the carboxylate group of 6-phospho- gluconate as CO2 and at the same time oxidizes the hydroxyl group at C3 to an oxo group. In addition to a second NADPH+H+, this also produces the ketopentose ribulose 5-phosphate. This is converted by an isomerase to ribose 5-phosphate, the initial compound for nucleotide synthesis (top).
The regenerative part of the PPP is only shown here schematically. A complete reaction scheme is given on p. 408. The function
of the regenerative branch is to adjust the net production of NADPH+H+ and pentose phosphates to the cell’s current requirements. Normally, the demand for NADPH+H+ is much higher than that for pentose phosphates. In these conditions, the reaction steps shown first convert six ribulose 5-phosphates to five molecules of fructose 6-phosphate and then, by isomerization, regenerate five glucose 6-phosphates. These can once again supply NADPH+H+ to the oxidative part of the PPP. Repeating these reactions finally results in the oxidation of one glucose 6-phosphate into six CO2. Twelve NADPH+H+ arise in the same process. In sum, no pentose phosphates are produced via this pathway.
In the recombination of sugar phosphates in the regenerative part of the PPP, there are two enzymes that are particularly important:
[5] Transaldolase transfers C3 units from sedoheptulose 7-phosphate, a ketose with seven C atoms, to the aldehyde group of glyceraldehyde 3-phosphate.
[4] Transketolase, which contains thiamine diphosphate, transfers C2 fragments from one sugar phosphate to another.
The reactions in the regenerative segment of the PPP are freely reversible. It is therefore easily possible to use the regenerative part of the pathway to convert hexose phosphates into pentose phosphates. This can occur when there is a high demand for pentose phosphates—e.g., during DNA replication in the S phase of the cell cycle (see p. 394).
Additional information
When energy in the form of ATP is required in addition to NADPH+H+, the cell is able to channel the products of the regenerative part of the PPP (fructose 6-phosphate and glyceraldehyde 3-phosphate) into glycolysis. Further degradation is carried out via the tricarboxylic acid cycle and the respiratorychain to CO2 and water. Overall, the cell in this way obtains 12 mol NADPH+H+ and around 150 mol ATP from 6 mol glucose 6-phos- phate. PPP activity is stimulated by insulin (see p. 388). This not only increases the rate of glucose degradation, but also produces additional NADPH+H+ for fatty acid synthesis (see p. 168).

|
|
|
|
|
|
|
Carbohydrate Metabolism |
|
153 |
|||||
A. Pentose phosphate pathway: oxidative part |
|
|
|
|
|
|
|
|
|
|||||
P |
O CH2 |
|
|
|
|
CO2 |
P |
O H H O H |
|
|||||
|
|
|
|
|
|
|||||||||
|
H |
O OH |
|
|
PPP – |
|
|
H |
C |
C |
C |
C |
C |
H |
|
H |
|
|
|
oxidative |
|
|
|||||||
|
OH H |
|
|
part |
|
|
|
H |
OH OH |
|
OH |
|
||
|
|
|
|
|
|
|
|
|
|
|||||
|
HO |
H |
|
|
|
|
|
|
|
|
||||
|
2 N |
A |
2 |
N |
A |
|
|
|
|
|
|
|
||
|
H |
OH |
|
P |
|
|
P |
|
|
|
|
|
|
|
Glucose 6-phosphate |
NADP |
NADPH + H |
|
Ribulose 5-phosphate |
||||||||||
B. Reactions |
|
|
|
|
|
|
|
|
|
|
|
|
|
|
|
|
|
|||
|
|
|
|
P |
O H H O H |
|
P P |
|
P P |
P P |
|
|
||||||||
|
6 |
Ribulose |
H |
C |
C |
C |
C |
C |
H |
|
|
|
|
|
|
|
Ribulose |
|||
|
|
5-phosphate |
|
|
|
|
|
|
|
|
|
|
|
|
|
|
|
|
5- P |
|
|
|
|
|
|
H |
OH OH |
|
OH |
|
|
|
|
|
|
|
|
|
|
||
|
6 N |
A |
|
|
|
|
|
|
6 CO2 |
|
|
|
|
|
|
|
|
|||
|
|
|
P |
|
|
|
|
|
|
|
|
|
|
|
|
|
|
|||
|
|
|
|
|
|
|
|
3 |
|
|
|
P |
P |
|
P |
P |
P |
P |
a |
Ribose |
|
6 N |
|
|
|
|
|
|
|
|
|
|
|
||||||||
|
A |
|
|
|
|
|
|
|
|
|
|
|
|
|
|
|
|
|
5- P |
|
|
|
P |
|
|
|
|
|
|
|
|
|
|
|
|
|
|
|
|
b |
Xylulose |
|
|
|
|
P |
O |
|
H |
H |
OH H |
|
|
|
|
|
|
|
|
|||
|
|
|
|
|
|
O |
a |
|
b |
|
b |
|
5- P |
|||||||
|
|
|
|
|
|
|
|
|
|
|||||||||||
|
|
6-Phospho- H |
C |
|
C |
C |
C |
C |
|
C |
|
|
|
|
||||||
|
6 |
|
|
|
4 |
|
|
|
|
|
|
|||||||||
|
gluconate |
|
H |
|
OH OH H |
OH |
O |
|
|
|
|
|
|
|
||||||
|
|
|
|
|
|
|
|
|
|
|
|
|
|
|||||||
Anabolic |
|
|
|
|
|
|
|
|
|
P |
P |
|
|
|
|
|
|
Sedo- |
||
|
|
|
|
|
2 |
|
|
|
|
|
|
|
|
|
|
a |
heptulose |
|||
pathways |
|
|
|
|
|
|
|
|
|
|
|
P |
P |
|
|
|
7- P |
|||
|
|
|
|
|
|
|
H2O |
|
|
|
|
|
|
|||||||
|
|
|
|
P |
O |
|
CH2 |
|
|
|
|
|
|
|
|
b |
Glyceral |
|||
|
|
6-Phospho- |
|
|
H |
|
O |
|
|
|
|
a |
|
b |
|
|
|
|
3- P |
|
|
6 |
|
|
|
|
|
|
|
|
|
|
|
|
|
||||||
|
glucono- |
|
|
|
H |
|
|
|
|
|
|
|
|
|
|
|
|
|
||
|
|
lactone |
|
|
|
OH H C |
O |
|
|
|
5 |
|
|
|
|
|
|
|||
|
|
|
|
|
HO |
|
|
|
|
|
|
|
|
|
|
|
|
|
|
|
|
|
|
|
|
|
|
H |
OH |
|
|
P |
P |
|
|
|
|
|
a |
Fructose |
|
|
|
|
|
|
|
|
|
|
|
|
|
|
|
|
|
|||||
|
6 N |
A |
|
|
|
|
|
|
|
|
|
|
|
|
P |
P |
|
|
|
6- P |
|
|
|
|
|
|
|
|
|
|
|
|
|
|
|
|
|
|
Erythrose |
||
|
|
P |
|
|
|
|
|
|
|
|
|
|
|
|
|
|
|
|
b |
|
|
|
|
|
|
|
|
|
|
|
|
|
|
|
|
|
|
|
|
||
|
|
|
|
|
|
|
|
1 |
|
|
|
|
|
|
|
|
|
|
|
4- P |
|
6 |
N |
A |
|
|
|
|
|
|
|
|
|
a |
|
b |
|
|
|
|
|
|
|
|
P |
|
|
|
|
|
|
|
|
|
|
|
|
|
4 |
|
|
|
|
|
|
|
P |
O |
|
CH2 |
|
|
|
|
|
|
|
|
|
|
|
||
|
|
|
|
|
|
|
|
P |
P |
|
P |
|
|
|
|
Fructose |
||||
|
|
|
|
|
H |
|
O OH |
|
|
|
|
|
|
a |
||||||
|
|
Glucose |
|
|
|
|
|
|
|
|
6- P |
|||||||||
|
6 |
|
H |
|
|
|
|
|
|
|
|
|
||||||||
|
6-phosphate |
|
|
|
|
|
|
|
|
|
|
|
|
P |
P |
b |
Glycer- |
|||
|
|
|
|
|
|
|
OH H |
|
|
|
|
|
|
|
|
|
|
|||
|
|
|
|
|
|
|
|
|
|
|
|
|
|
|
|
|
|
|
|
aldehyde |
|
|
|
|
|
HO |
|
|
H |
|
|
|
a |
|
a |
|
|
b |
|
3- P |
|
|
|
|
|
|
|
|
H |
OH |
|
|
|
|
|
|
|
|
||||
|
|
|
|
|
|
|
|
|
|
|
|
|
|
|
|
|
|
|||
1 |
Glucose 6-phosphate dehydrogenase 1.1.1.49 |
|
|
|
4 |
Transketolase 2.2.1.1 |
|
|||||||||||||
2 |
Gluconolactonase 3.1.1.17 |
|
|
|
|
|
|
|
|
5 |
Transaldolase 2.2.1.2 |
|
||||||||
3 |
Phosphogluconate dehydrogenase (decarboxylating) 1.1.1.44 |
|
|
|
|
|
|
|
|
|||||||||||

154 Metabolism
Gluconeogenesis
Some tissues, such as brain and erythrocytes, depend on a constant supply of glucose. If the amount of carbohydrate taken up in food is not suf cient, the blood sugar level can be maintained for a limited time by degradation of hepatic glycogen (see p. 156). If these reserves are also exhausted, de-novo synthesis of glucose (gluconeogenesis) begins. The liver is also mainly responsible for this(see p. 310), but the tubular cells of the kidney also show a high level of gluconeogenetic activity (see p. 328). The main precursors for gluconeogenesis are amino acids derived from muscle proteins. Another important precursor is lactate, which is formed in erythrocytes and muscle proteins when there is oxygen deficiency. Glycerol produced from the degradation of fats can also be used for gluconeogenesis. However, the conversion of fatty acids into glucose is not possible in animal metabolism (see p. 138). The human organism can synthesize several hundred grams of glucose per day by gluconeogenesis.
A. Gluconeogenesis
Many of the reaction steps involved in gluconeogenesis are catalyzed by the same enzymes that are used in glycolysis (see p. 150). Other enzymes are specific to gluconeogenesis and are only synthesized, under the influence of cortisol and glucagon when needed (see p. 158). Glycolysis takes place exclusively when needed in the cytoplasm, but gluconeogenesis also involves the mitochondria and the endoplasmic reticulum (ER). Gluconeogenesis consumes 4 ATP (3 ATP + 1 GTP) per glucose—i.e., twice as many as glycolysis produces.
[1] Lactate as a precursor for gluconeogenesis is mainly derived from muscle (see Cori cycle, p. 338) and erythrocytes. LDH (see p. 98) oxidizes lactate to pyruvate, with NADH+H+ formation.
[2]The firststepsofactualgluconeogenesis take place in the mitochondria. The reason for this “detour” is the equilibrium state of the pyruvate kinase reaction (see p. 150). Even coupling to ATP hydrolysis would not be sufficient to convert pyruvate directly into phosphoenol pyruvate (PEP). Pyruvate derived
from lactate or amino acids is therefore initially transported into the mitochondrial matrix, and—in a biotin-dependent reaction catalyzed by pyruvate carboxylase—is carboxylated there to oxaloacetate. Oxaloacetate is also an intermediate in the tricarboxylic acid cycle. Amino acids with breakdown products that enter the cycle or supply pyruvate can therefore be converted into glucose (see
p.180).
[3]The oxaloacetate formed in the mitochondrial matrix is initially reduced to malate, which can leave the mitochondria via
inner membrane transport systems (see
p.212).
[4]In the cytoplasm, oxaloacetate is reformed and then converted into phosphoenol pyruvate by a GTP-dependent PEP carboxykinase. The subsequent steps up to fructose 1,6-bisphosphate represent the reverse of the corresponding reactions involved in
glycolysis. One additional ATP per C3 fragment is used for the synthesis of 1,3-bisphos- phoglycerate.
Two gluconeogenesis-specific phosphatases then successively cleave off the phosphate residues from fructose 1,6-bisphos- phate. In between these reactions lies the isomerization of fructose 6-phosphate to glucose 6-phosphate—another glycolytic reaction.
[5]The reaction catalyzed by fructose 1,6-bisphosphatase is an important regulation point in gluconeogenesis (see p. 158).
[6]The last enzyme in the pathway, glucose 6-phosphatase, occurs in the liver, but not in muscle. It is located in the interior of the smooth endoplasmic reticulum. Specific transporters allow glucose 6-phosphate to enter the ER and allow the glucose formed there to return to the cytoplasm. From there, it is ultimately released into the blood.
Glycerol initially undergoes phosphorylation at C-3 [7]. The glycerol 3-phosphate formed is then oxidized by an NAD+-depen- dent dehydrogenase to form glycerone 3- phosphate [8] and thereby channeled into gluconeogenesis. An FAD-dependent mitochondrial enzyme is also able to catalyze this reaction (known as the “glycerophosphate shuttle”; see p. 212).
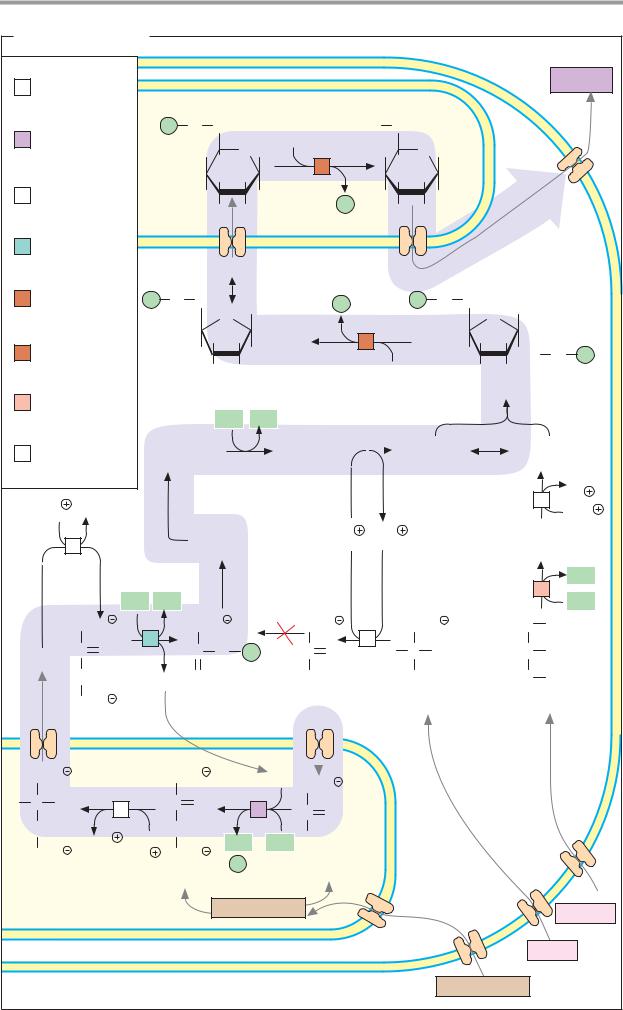
|
|
|
|
|
|
|
|
|
|
|
|
Carbohydrate Metabolism |
155 |
|||||||
A. Gluconeogenesis |
|
|
|
|
|
|
|
|
|
|
|
|
|
|
|
|
||||
|
Lactate |
|
|
|
|
|
|
|
|
|
|
|
|
|
|
|
Glucose |
|||
1 |
dehydrogenase |
|
|
|
|
|
|
|
|
|
|
|
|
|
|
|
||||
|
|
|
|
|
|
|
|
|
|
|
|
|
|
|
|
|
||||
|
1.1.1.27 |
|
|
Glucose 6-phosphate |
|
|
Glucose |
|
|
|
|
|
||||||||
|
|
|
|
|
|
|
|
|
|
|
|
|||||||||
2 |
Pyruvate |
|
P |
O |
CH2 |
|
H2O |
|
HO |
CH2 |
|
|
|
|
|
|
||||
carboxylase |
|
|
H |
O OH |
|
|
|
H |
O OH |
|
|
|
|
|
||||||
|
(biotin)6.4.1.1 |
|
|
|
|
|
|
|
|
|
|
|||||||||
|
|
|
|
|
|
|
H |
|
|
|
6 |
|
H |
|
|
|
|
|
|
|
|
Malate |
|
|
|
|
OH H |
|
|
|
|
OH H |
|
|
|
|
|
||||
3 |
dehydrogenase |
|
|
HO |
H |
|
|
P |
HO |
|
H |
|
|
|
|
|
||||
|
1.1.1.37 |
|
gER |
|
H |
OH |
|
|
|
H |
OH |
|
|
|
|
|
||||
|
|
|
|
|
|
|
|
|
|
|
|
|
|
|||||||
|
|
|
|
|
|
|
|
|
|
|
|
|
|
|
|
|
|
|
||
4 |
PEP |
|
|
|
|
|
|
|
|
|
|
|
|
|
|
|
|
|
|
|
carboxykinase |
|
|
|
|
|
|
|
|
|
|
|
|
|
|
|
|
|
|||
|
4.1.1.32 |
|
Glucose 6-phosphate |
|
|
|
|
|
|
|
|
|
|
|||||||
|
|
|
|
|
|
|
|
|
|
|
|
|
|
|
||||||
5 |
Fructose 1,6- |
P |
O |
CH2 |
|
|
|
|
|
|
P |
O |
CH2 |
|
|
|
|
|||
bisphosphate |
OH |
|
|
P |
|
|
OH |
|
|
|||||||||||
|
3.1.3.11 |
|
|
|
O |
|
|
|
|
|
|
|
O |
|
|
|||||
6 |
Glucose 6- |
|
|
|
H HO |
|
|
|
5 |
|
|
|
H HO |
|
|
|
||||
|
|
H |
|
CH |
OH |
|
|
|
|
|
H |
CH |
|
O |
P |
|||||
phosphatase |
|
|
|
|
|
|
|
|
|
2 |
||||||||||
|
3.1.3.9 |
|
|
|
|
|
2 |
|
|
|
H2O |
|
|
|
|
|
|
|||
|
|
|
|
|
OH H |
|
|
|
|
|
|
OH H |
|
|
|
|||||
7 |
Glycerol kinase |
Fructose 6-phosphate |
|
|
|
|
|
Fructose 1,6-bisphosphate |
||||||||||||
|
|
|
|
|
|
|
|
|
|
|
|
|
|
|
|
|
||||
|
2.7.1.30 |
|
|
|
ATP |
ADP |
|
|
|
|
|
|
|
|
|
|
|
|||
|
|
|
|
|
|
|
|
|
|
|
|
|
|
|
|
|
|
|||
|
Glycerol 3- |
3-Phospho- |
|
1,3-Bisphospho- Glyceraldehyde |
Glycerone |
|||||||||||||||
8 |
phosphate |
glycerate |
|
|
glycerate |
|
3-phosphate |
3-phosphate |
||||||||||||
|
dehydrogenase |
|
|
|
|
|
|
|
|
|
|
|
|
|
|
|
|
|
||
|
1.1.1.8 |
|
|
|
|
|
|
|
|
|
|
|
|
|
|
|
|
|
NADH |
|
|
|
|
|
|
|
|
|
|
|
|
|
|
|
|
|
|
|
|
|
|
|
NAD |
NADH |
|
|
|
|
|
|
|
|
|
|
|
|
|
|
8 |
|
+H |
|
|
|
|
|
|
|
|
|
|
|
|
|
|
|
|
|
|
NAD |
|||
|
|
|
|
|
|
|
|
|
|
|
|
|
|
|
|
|
|
|
|
|
|
|
3 |
|
|
|
2-Phospho- |
|
NADH+H |
NAD |
|
|
|
Glycerol |
|
||||||
|
|
|
|
|
glycerate |
|
|
|
|
|
|
|
|
3-phosphate |
||||||
|
|
|
|
|
|
|
|
|
|
|
|
|
|
|
|
|
|
7 |
|
ADP |
|
|
|
GTP |
GDP |
|
|
|
|
|
|
|
|
|
|
|
|
|
ATP |
||
|
|
|
|
|
|
|
|
|
|
|
|
|
|
|
|
|
||||
|
|
|
COO |
4 |
COO |
|
|
COO |
1 |
|
COO |
|
H2C |
|
OH |
|
||||
|
|
|
C O |
C O P |
|
C O |
H C OH |
|
HC OH |
|
||||||||||
Malate |
|
|
|
|
|
|
||||||||||||||
CH2 |
|
|
|
|
|
|
|
|
|
|
|
|
|
|
|
|
|
|||
|
|
|
|
CO2 |
CH2 |
|
|
CH3 |
|
|
CH3 |
|
H2C |
|
OH |
|
||||
|
|
|
COO |
|
|
Phospho- |
|
Pyruvate |
|
|
Lactate |
|
Glycerol |
|||||||
|
|
Oxaloacetate |
enolpyruvate |
|
|
|
|
|
|
|
|
|
|
|
||||||
|
COO |
|
|
COO |
|
|
CO2 |
COO |
|
|
|
|
|
|
|
|
|
|||
H |
C |
OH |
|
|
C |
O |
|
|
|
|
|
|
|
|
|
|
|
|
||
3 |
|
|
2 |
|
C |
O |
|
|
|
|
|
|
|
|
|
|||||
|
CH2 |
|
CH2 |
|
|
|
|
|
|
|
|
|
|
|
||||||
|
NAD |
|
ADP |
ATP |
CH3 |
|
|
|
|
|
|
|
|
|
||||||
|
COO |
NADH |
|
|
|
|
|
|
|
|
|
|
||||||||
|
|
+H |
COO |
P |
|
Pyruvate |
|
|
|
|
|
|
|
|
|
|||||
|
|
|
|
|
|
|
|
|
|
|
|
|
|
|
|
|
||||
|
Malate |
|
Oxaloacetate |
|
|
|
|
|
|
|
|
|
|
|
||||||
|
|
|
|
|
|
|
|
|
|
|
|
|
|
|
||||||
Mitochrondrion |
|
|
|
Amino acids |
|
|
|
|
|
|
|
|
|
Glycerol |
||||||
|
|
|
|
|
|
|
|
|
|
|
|
|
|
|
||||||
Cytoplasm |
|
|
|
|
|
|
|
|
|
|
|
|
|
|
Lactate |
|||||
|
|
|
|
|
|
|
|
|
|
|
|
|
|
|
Amino acids |
|
|
|
||

156 Metabolism
Glycogen metabolism
Glycogen (see p. 40) is used in animals as a carbohydrate reserve, from which glucose phosphates and glucose can be released when needed. Glucose storage itself would not be useful, as high concentrations within cells would make them strongly hypertonic and would therefore cause an influx of water. By contrast, insoluble glycogen has only low osmotic activity.
A. Glycogen balance
Animal glycogen, like amylopectin in plants, is a branched homopolymer of glucose. The glucose residues are linked by an α1 4-glyco- sidic bond. Every tenth or so glucose residue has an additional α1 6 bond to another glucose. These branches are extended by additional α1 4-linked glucose residues. This structure produces tree-shaped molecules consisting of up to 50000 residues (M > 1 107 Da).
Hepatic glycogen is never completely degraded. In general, only the nonreducing ends of the “tree” are shortened, or—when glucose is abundant—elongated. The reducing end of the tree is linked to a special protein, glycogenin. Glycogenin carries out autocatalytic covalent bonding of the first glucose at one of its tyrosine residues and elongation of this by up to seven additional glucose residues. It is only at this point that glycogen synthase becomes active to supply further elongation.
[1]The formation of glycosidic bonds between sugars is endergonic. Initially, therefore, the activated form—UDP-glucose—is synthesized by reaction of glucose 1-phos- phate with UTP (see p. 110).
[2]Glycogen synthase now transfers glucose residues one by one from UDP-glucose to the non-reducing ends of the available “branches.”
[3]Once the growing chain has reached a specific length (> 11 residues), the branching enzyme cleaves an oligosaccharide consisting of 6–7 residues from the end of it, and adds
this into the interior of the same chain or a neighboring one with α1 6 linkage. These branches are then further extended by glycogen synthase.
[4]The branched structure of glycogen allows rapid release of sugar residues. The most
important degradative enzyme, glycogen phosphorylase, cleaves residues from a nonreducing end one after another as glucose 1-phosphate. The larger the number of these ends, the more phosphorylase molecules can attack simultaneously. The formation of glucose 1-phosphate instead of glucose has the advantage that no ATP is needed to channel the released residues into glycolysis or the PPP.
[5] [6] Due to the structure of glycogen phosphorylase, degradation comes to a halt four residues away from each branching point. Two more enzymes overcome this blockage. First, a glucanotransferase moves a trisaccharide fromthe side chain to the end of the main chain [5]. A 1,6-glucosidase [6] then cleaves the single remaining residue as a free glucose and leaves behind an unbranched chain that is once again accessible to phosphorylase.
The regulation of glycogen metabolism by interconversion, and the role of hormones in these processes, are discussed on p. 120.
B. Glycogen balance
The human organism can store up to 450 g of glycogen—one-third inthe liver and almost all of the remainder in muscle. The glycogen content of the other organs is low.
Hepatic glycogen is mainly used to maintain the blood glucose level in the postresorptive phase (see p. 308). The glycogen content of the liver therefore varies widely, and can decline to almost zero in periods of extended hunger. After this, gluconeogenesis (see p. 154) takes over the glucose supply for the organism. Muscle glycogen serves as an energy reserve and is not involved in blood glucose regulation. Muscle does not contain any glucose 6-phosphatase and istherefore unable to release glucose into the blood. The glycogen contentofmusclethereforedoesnotfluctuate as widely as that of the liver.

|
|
|
|
Carbohydrate Metabolism |
157 |
||
A. Glycogen metabolism |
|
|
|
|
|||
α-1,4-Glucan chain |
|
|
|
α-1,4-Glucan chain |
|||
(unbranched) |
|
|
|
(α-1,6-branched) |
|||
|
|
|
|
3 |
|
|
|
|
|
|
|
R |
|
|
|
R |
|
|
|
|
|
|
|
|
|
|
|
Reducing |
|
|
|
U |
|
|
|
end |
|
|
|
|
|
|
|
|
|
P |
|
|
P |
P |
|
|
|
|
|
|
|
|
|
|
|
||
UDP- |
|
|
2 |
|
Degra- |
4 |
|
|
|
|
4 |
|
|||
|
|
|
dation |
|
|||
glucose |
|
|
|
|
|
||
U |
|
|
|
|
|
|
P |
|
P |
P |
|
|
|
|
|
|
|
|
|
|
|
||
|
|
|
|
|
|
Glucose 1- |
|
|
|
|
|
|
|
phosphate |
|
P P |
|
|
|
4 |
|
|
|
|
1 |
|
|
|
R |
|
|
UTP |
|
R |
|
Further |
|
|
|
|
|
|
degradation |
|
|
|
|
|
P |
|
|
|
|
|
|
|
|
|
|
|
5 |
|
|
Glucose |
|
|
|
|
|||
|
|
|
|
|
|||
1-phosphate |
|
|
|
|
|
||
|
|
|
|
6 |
|
|
|
Building block |
|
R |
|
|
|
||
synthesis |
Glucose |
|
|
|
|||
1 |
UTP-glucose 1-phosphate |
4 |
Phosphorylase 2.4.1.1 |
|
|||
uridyltransferase 2.7.7.9 |
|
||||||
2 |
Glycogen synthase 2.4.1.11 |
5 |
4-α-Glucanotransferase 2.4.1.25 |
||||
3 |
Glucan branching enzyme |
6 |
Amylo-1,6-glucosidase |
|
|||
|
2.4.1.18 |
|
|
3.2.1.33 |
|
|
|
B. Glycogen balance
Liver
150g
1g
Liver glycogen
Liver |
Blood |
Muscle |
Muscle |
|
glycogen |
4 – 6 g · l-1 |
glycogen |
300g |
|
Glucose |
Blood |
Glucose |
|
|
glucose |
|
|||
1-phosphate |
1-phosphate |
|
||
|
|
|||
|
|
|
200g |
|
Glucose |
De- |
Glucose |
Degra- |
|
grad- |
||||
6-phosphate |
6-phosphate |
dation |
||
ation |
||||
|
|
|
Glucose 


 Glucose

 Glucose
Muscle glycogen

158 Metabolism
Regulation
A. Regulation of carbohydrate metabolism
In all organisms, carbohydrate metabolism is subject to complex regulatory mechanisms involving hormones, metabolites, and coenzymes. The scheme shown here (still a simplified one) applies to the liver, which has central functions in carbohydrate metabolism (see p. 306). Some of the control mechanisms shown here are not effective in other tissues.
One of the liver’s most important tasks is to store excess glucose in the form of glycogen and to release glucose from glycogen when required (buffer function). When the glycogen reserves are exhausted, the liver can provide glucose by de novo synthesis (gluconeogenesis; see p. 154). In addition, like all tissues, the liver breaks glucose down via glycolysis. These functions have to be coordinated with each other. For example, there is no point in glycolysis and gluconeogenesis taking place simultaneously, and glycogen synthesis and glycogen degradation should not occur simultaneously either. This is ensured by the fact that two different enzymes exist for important steps in both pathways, each of which catalyzes only the anabolic or the catabolic reaction. The enzymes are also regulated differently. Only these key enzymes are shown here.
Hormones. The hormones that influence carbohydrate metabolism include the peptides insulin and glucagon; a glucocorticoid, cortisol; and a catecholamine, epinephrine (see p. 380). Insulin activates glycogen synthase ([1]; see p. 388), and induces several enzymes involved in glycolysis [3, 5, 7]. At the same time, insulin inhibits the synthesis of enzymes involved in gluconeogenesis (repression; [4, 6, 8, 9]). Glucagon, the antagonist of insulin, has the opposite effect. It induces gluconeogenesis enzymes [4, 6, 8, 9] and represses pyruvate kinase [7], a key enzyme of glycolysis. Additional effects of glucagon are based on the interconversion of enzymes and are mediated by the second messenger cAMP. This inhibits glycogen synthesis [1] and activates glycogenolysis [2]. Epinephrine acts in a similar fashion. The inhibition of pyruvate kinase [7] by glucagon is also due to interconversion.
Glucocorticoids—mainly cortisol (see p. 374)—induce all of the key enzymes involved in gluconeogenesis [4, 6, 8, 9]. At the same time, they also induce enzymes involved in amino acid degradation and thereby provide precursors for gluconeogenesis. Regulation of the expression of PEP carboxykinase, a key enzyme in gluconeogenesis, is discussed in detail on p. 244.
Metabolites. High concentrations of ATP and citrate inhibit glycolysis by allosteric regulation of phosphofructokinase. ATP also inhibits pyruvate kinase. Acetyl-CoA, an inhibitor of pyruvate kinase, has a similar effect. All of these metabolites arise from glucose degradation (feedback inhibition). AMP and
ADP, signals for ATP deficiency, activate glycogen degradation and inhibit gluconeogenesis.
B. Fructose 2,6-bisphosphate
Fructose 2,6-bisphosphate (Fru-2,6-bP) plays an important part in carbohydrate metabolism. This metabolite is formed in small quantities from fructose 6-phosphate and has purely regulatory functions. It stimulates glycolysis by allosteric activation of phosphofructokinase and inhibits gluconeogenesis by inhibition of fructose 1,6-bisphosphatase.
The synthesis and degradation of Fru-2,6- bP are catalyzed by one and the same protein [10a, 10b]. If the enzyme is present in an unphosphorylated form [10a], it acts as a kinase and leads to the formation of Fru-2,6-bP. After phosphorylation by cAMP-dependent protein kinase A (PK-A), it acts as a phosphatase [10b] and now catalyzes the degradation of Fru-2,6- bP to fructose 6-phosphate. The equilibrium between [10a] and [10b] is regulated by hormones. Epinephrine and glucagon increase the cAMP level (see p. 120). As a result of increased PK-A activity, this reduces the Fru- 2,6-bP concentration and inhibits glycolysis, while at the same time activating gluconeogenesis. Conversely, via [10a], insulin activates the synthesis of Fru-2,6-bP and thus glycolysis. In addition, insulin also inhibits the action of glucagon by reducing the cAMP level (see p. 120).

|
|
|
|
|
Carbohydrate Metabolism |
159 |
||
A. Regulation of carbohydrate metabolism |
|
|
|
|
|
|||
Epinephrine |
|
|
Glycogen |
|
|
Epinephrine |
|
|
Glucagon |
|
|
|
|
|
Glucagon |
|
|
Insulin |
1 |
2 |
|
AMP |
|
|
|
|
|
|
|
|
|
|
Fru-2,6-bis P |
ATP |
|
|
Insulin |
|
Glucose |
|
Insulin |
AMP |
Citrate |
|
|
|
|
|
|
|
|
|
|
|
|
|
1-phosphate |
|
|
|
|
|
|
3 |
|
|
|
|
5 |
|
|
|
3' |
|
Glucose |
Fructose |
|
Fructose1,6- |
||
Glucose |
|
|
||||||
|
6-phosphate |
6-phosphate |
|
bisphosphate |
||||
|
|
|
|
|||||
|
4 |
|
|
|
|
6 |
|
|
|
|
|
|
|
|
R |
Insulin |
|
|
|
R |
|
|
|
|
|
|
|
|
|
|
|
|
|
|
|
Cortisol |
Insulin |
|
Cortisol |
Fru 2,6-bis P |
|
|
||
Glucagon |
|
Glucagon |
AMP |
|
|
|||
|
|
|
|
|
||||
|
Glucagon |
ATP |
|
|
|
|
|
|
|
|
1 |
Glycogen synthase 2.4.1.11 |
|
||||
Insulin |
|
Acetyl CoA |
|
|||||
|
|
|
|
|
|
|
|
|
|
R |
|
|
2 |
Glycogen phosphorylase 2.4.1.1 |
|
||
|
|
|
|
3 |
Hexokinase 2.7.1.1 |
|
|
|
PEP |
7 |
|
Pyruvate |
3' Hexokinase (liver) 2.7.1.1 |
|
|
||
|
|
|
Acetyl |
4 |
Glucose 6-phosphatase 3.1.3.9 |
|
||
|
|
|
|
|
|
|
|
|
R |
Insulin |
R |
CoA |
5 |
6-Phosphofructokinase 2.7.1.11 |
|
||
9 |
Cortisol |
|
8 |
6 |
Fructose 1,6-bisphosphatase 3.1.3.11 |
|||
|
|
|
7 |
Pyruvate kinase 2.7.1.40 |
|
|
||
|
Glucagon |
|
|
|
|
|||
Oxalo- |
|
|
Oxalo- |
8 |
Pyruvate carboxylase 6.4.1.1 |
|
||
|
|
9 |
PEP carboxykinase (GTP) 4.1.1.32 |
|
||||
acetate |
|
|
acetate |
|
||||
|
|
|
|
|
|
|
||
B. Fructose 2,6-bisphosphate |
|
|
|
|
|
Insulin |
Citrate, PEP |
|
|
|
|
|
5 |
|
|
10a |
|
|
|
|
P |
ATP |
Fructose 2,6- |
Fructose 1,6- |
|
Fructose 6- |
|
||
|
phosphate |
|
bisphosphate |
bisphosphate |
|
|
ADP |
|
|
|
10b |
|
|
|
|
|
|
6 |
|
|
Insulin |
cAMP |
Glucagon |
|
10a |
6-Phosphofructo-2-kinase 2.7.1.105 |
10b |
Fructose 2,6-bisphosphatase 3.1.3.46 |
|

160 Metabolism
Diabetes mellitus
Diabetes mellitus is a very common metabolic disease that is caused by absolute or relative insulin deficiency. The lack of this peptide hormone (see p. 76) mainly affects carbohydrate and lipid metabolism. Diabetes mellitus occurs in two forms. In type 1 diabetes (in- sulin-dependent diabetes mellitus, IDDM), the insulin-forming cells are destroyed in young individuals by an autoimmune reaction. The less severe type 2 diabetes (non- insulin-dependent diabetes mellitus, NIDDM) usually has its first onset in elderly individuals. The causes have not yet been explained in detail in this type.
A. Insulin biosynthesis
Insulin is produced by the B cells of the islets of Langerhans in the pancreas. As is usual with secretory proteins, the hormone’s precursor (preproinsulin) carries a signal peptide that directs the peptide chain to the interior of the endoplasmic reticulum (see p. 210). Proinsulin is produced in the ER by cleavage of the signal peptide and formation of disulfide bonds. Proinsulin passes to the Golgi apparatus, where it is packed into vesicles—the β - granules. After cleavage of the C peptide, mature insulin is formed in the β-granules and is stored in the form of zinc-containing hexamers until secretion.
B. Effects of insulin deficiency
The effects of insulin on carbohydrate metabolism are discussed on p. 158. In simplified terms, they can be described as stimulation of glucose utilization and inhibition of gluconeogenesis. In addition, the transport of glucose from the blood into most tissues is also insulin-dependent (exceptions to this include the liver, CNS, and erythrocytes).
The lipid metabolism of adipose tissue is also influenced by the hormone. In these cells, insulin stimulates the reorganization of glucose into fatty acids. This is mainly based on
activation |
of |
acetyl CoA |
carboxylase |
(see |
p. 162) |
and |
increased |
availability |
of |
NADPH+H+ due to increased PPP activity (see p. 152). On the other hand, insulin also inhibits the degradation of fat by hormone-
sensitive lipases (see p. 162) and prevents the breakdown of muscle protein.
The effects of insulin deficiency on metabolism are shown by arrows in the illustration. Particularly noticeable is the increase in the
glucose concentration in the blood, from 5 mM to 9 mM (90 mg dL–1) or more
(hyperglycemia, elevated blood glucose level). In muscle and adipose tissue – the two most important glucose consumers—glucose uptake and glucose utilization are impaired by insulin deficiency. Glucose utilization in the liver is also reduced. At the same time, gluconeogenesis is stimulated, partly due to increased proteolysis in the muscles. This increases the blood sugar level still further. When the capacity of the kidneys to resorb glucoseisexceeded (atplasmaconcentrations of 9 mM or more), glucose is excreted in the urine (glucosuria).
The increased degradation of fat that occurs in insulin deficiency also has serious effects. Some of the fatty acids that accumulate in large quantities are taken up by the liver and used for lipoprotein synthesis (hyperlipidemia), and the rest are broken down into acetyl CoA. As the tricarboxylic acid cycle is not capable of taking up such large quantities of acetyl CoA, the excess is used to form ketone bodies (acetoacetate and Ε-hydroxy- butyrate see p. 312). As H+ ions are released in this process, diabetics not receiving adequate treatment can suffer severe metabolic acidosis (diabetic coma). The acetone that is also formed gives these patients’ breath a characteristicodor. In addition, large amounts of ketone body anions appear in the urine (ketonuria).
Diabetes mellitus can have serious secondary effects. A constantly raised blood sugar level can lead in the long term to changes in the blood vessels (diabetic angiopathy), kidney damage (nephropathy) and damage to the nervous system (neuropathy), as well as to cataracts in the eyes.

|
|
|
|
Carbohydrate Metabolism |
161 |
|||
A. Insulin biosynthesis |
|
|
|
|
|
|
||
B cells |
|
|
Preproinsulin 1 |
Proinsulin |
2 |
Insulin |
3 |
|
|
|
|
104 AS |
84 AS |
|
51 AS |
|
|
Nucleus |
|
H3N |
|
|
|
|
|
|
|
|
|
|
|
|
|
|
|
|
3 |
4 |
|
|
|
|
Zn2 |
|
|
|
|
|
|
|
|
|
|
1 |
|
|
Exo- |
|
|
|
|
|
|
β-Granules |
cytosis |
|
|
|
|
|
|
Rough |
2 |
|
|
|
|
|
|
|
|
Signal |
|
|
|
|
|||
ER |
Golgi apparatus |
C peptide |
|
Insulin |
|
|||
|
|
|
peptide |
4 |
|
|||
|
|
|
OOC |
|
|
hexamer |
|
|
|
|
|
|
|
|
|
||
|
|
|
|
|
|
|
|
|
B. Effects of insulin deficiency |
|
|
|
|
|
|||
Muscle and |
|
Blood |
|
Adipose |
|
|
|
|
other insulin- |
|
|
|
tissue |
Fat |
|
||
dependent tissues |
|
|
|
|
|
|||
|
|
|
|
|
|
|
||
|
|
|
Glucose |
|
|
|
|
|
|
|
|
uptake |
|
|
|
|
|
|
|
|
impaired |
|
|
|
|
|
|
Glucose |
C |
Glucose |
C |
Glucose |
|
Lipolysis |
|
|
Protein |
|
Amino |
|
Fatty acids |
|
|
|
|
|
acids |
|
|
|
|
||
|
|
|
|
|
|
|
||
|
|
Proteo- |
|
|
|
Maximal |
||
|
|
lysis |
|
|
|
|||
|
|
|
|
|
resorption |
|||
|
|
|
|
|
|
|
||
|
|
|
Hyper- |
|
|
|
capacity |
|
|
|
|
glycemia |
|
|
|
exceeded |
|
|
|
|
|
|
|
|
|
|
|
|
|
Glucose |
|
|
|
|
|
|
|
|
Amino |
|
|
|
|
|
|
|
|
acids |
Fatty acids |
|
|
|
|
|
|
|
|
Hyper- |
|
|
|
|
Glyco- |
|
|
lipid- |
|
|
|
|
|
Glucose |
emia |
|
|
|
|
|||
gen |
|
|
|
|
|
|||
|
|
|
|
|
|
|
|
|
|
|
|
|
Lipo- |
|
Kidney |
|
|
|
|
|
Fatty |
proteins |
|
|
|
|
|
|
|
acids |
|
Anions |
|
|
|
|
|
|
|
|
|
|
|
|
|
|
|
|
|
of ketone |
|
|
|
|
|
|
|
|
bodies |
Urine |
|
|
|
|
|
Acetyl |
Ketone |
|
|
|
|
|
|
Pyruvate |
|
|
|
|
||
Liver |
|
CoA |
bodies |
|
Glucose |
|
||
|
|
|
|
|||||
|
|
|
|
|
|
|
||
|
|
|
|
H |
|
Anions |
|
|
|
|
|
|
|
of ketone |
|
||
|
|
|
|
|
|
|
||
Insulin deficiency |
|
Metabolic |
bodies |
|
||||
|
acidosis |
|
Water |
|
||||
|
|
|
|
|
|
|
||
|
|
|
|
|
|
Electrolytes |
|
|
162 Metabolism
Overview
A. Fat metabolism
Fat metabolism in adipose tissue (top). Fats (triacylglycerols) are the most important energy reserve in the animal organism. They are mostly stored in insoluble form in the cells of adipose tissue—the adipocytes—where they are constantly being synthesized and broken down again.
As precursors for the biosynthesis of fats (lipogenesis), the adipocytes use triacylglycerols from lipoproteins (VLDLs and chylomicrons; see p. 278), which are formed in the liver and intestines and delivered by the blood. Lipoprotein lipase [1], which is located on the inner surface of the blood capillaries, cleaves these triacylglycerols into glycerol and fatty acids, which are taken up by the adipocytes and converted back into fats.
The degradation of fats (lipolysis) is catalyzed in adipocytes by hormone-sensitive lipase [2]—an enzyme that is regulated by various hormones by cAMP-dependent interconversion (see p. 120). The amount of fatty acids released depends on the activity of this lipase; in this way, the enzyme regulates the plasma levels of fatty acids.
In the blood plasma, fatty acids are transported in free form—i.e., non-esterified. Only short-chain fatty acids are soluble in the blood; longer, less water-soluble fatty acids are transported bound to albumin.
Degradation of fatty acids in the liver (left).
Many tissues take up fatty acids from the blood plasma in order to synthesize fats or to obtain energy by oxidizing them. The metabolism of fatty acids is particularly intensive in the hepatocytes in the liver.
The most important process in the degradation of fatty acids is Ε-oxidation—a metabolic pathway in the mitochondrial matrix (see p. 164). Initially, the fatty acids in the cytoplasm are activated by binding to coenzyme A into acyl CoA [3]. Then, with the help of a transport system (the carnitine shuttle [4]; see p. 164), the activated fatty acids enter the mitochondrial matrix, where they are broken down into acetyl CoA. The resulting acetyl residues can be oxidized to CO2 in the tricarboxylic acid cycle, producing reduced
coenzyme and ATP derived from it by oxidative phosphorylation. If acetyl CoA production exceeds the energy requirements of the hepa- tocytes—as is the case when there is a high levelof fatty acids in the blood plasma (typical in hunger and diabetes mellitus)—then the excess is converted into ketone bodies (see p. 312). These serve exclusively to supply other tissues with energy.
Fat synthesis in the liver (right). Fatty acids and fats are mainly synthesized in the liver and in adipose tissue, as well as in the kidneys, lungs, and mammary glands. Fatty acid biosynthesis occurs in the cytoplasm—in contrast to fatty acid degradation. The most important precursor is glucose, but certain amino acids can also be used.
The first step is carboxylation of acetyl CoA to malonyl CoA. This reaction is catalyzed by acetyl-CoA carboxylase [5], which is the key enzyme in fatty acid biosynthesis. Synthesis into fatty acids is carried out by fatty acid synthase [6]. This multifunctional enzyme (see p. 168) starts with one molecule of ace- tyl-CoA and elongates it by adding malonyl groups in seven reaction cycles until palmitate is reached. One CO2 molecule is released in each reaction cycle. The fatty acid therefore grows by two carbon units each time. NADPH+H+ is used as the reducing agent and is derived either from the pentose phosphate pathway (see p. 152) or from isocitrate dehydrogenase and malic enzyme reactions.
The elongation of the fattyacid by fatty acid synthase concludes at C16, and the product, palmitate (16:0), is released. Unsaturated fatty acids and long-chain fatty acids can arise from palmitate in subsequent reactions. Fats are finally synthesized from activated fatty acids (acyl CoA) and glycerol 3-phosphate (see p. 170). To supply peripheral tissues, fats are packed by the hepatocytes into lipoprotein complexes of the VLDL type and released into the blood in this form (see p. 278).
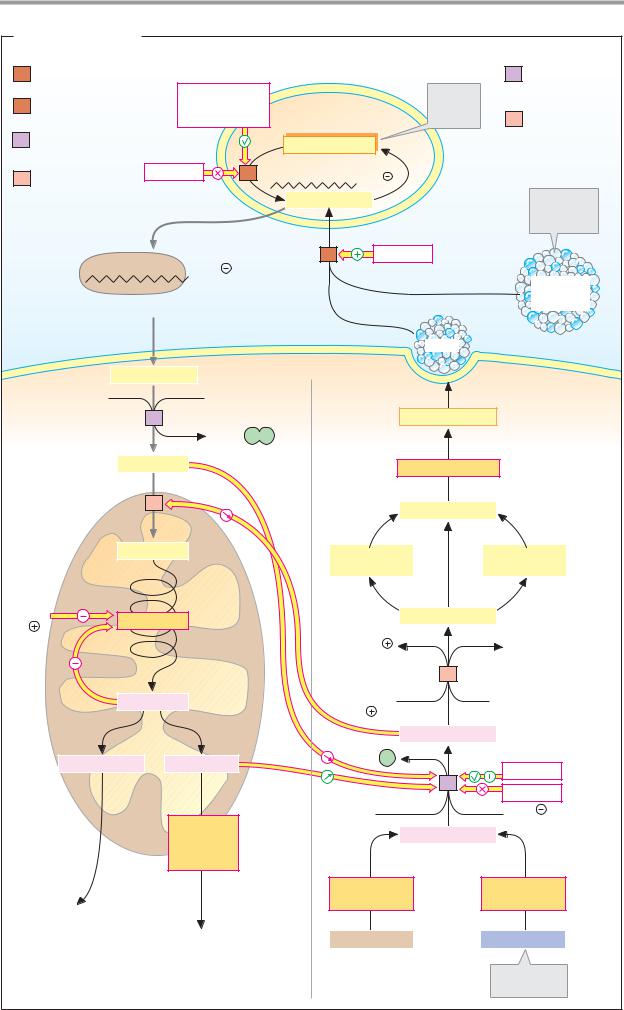
|
|
|
|
|
|
|
|
Lipid Metabolism |
163 |
||
A. Fat metabolism |
|
|
|
|
|
|
|
|
|
||
1 |
Lipoprotein |
|
|
|
|
|
|
|
5 |
Acetyl-CoA |
|
|
lipase 3.1.1.34 |
|
Epinephrine |
|
|
Largest |
|
carboxylase |
|
||
2 |
Hormone-sensitive |
|
Adipocyte |
|
6.4.1.2 [Biotin] |
||||||
Norepinephrine |
|
energy |
|
|
|
||||||
|
lipase 3.1.1.3 |
|
Glucagon etc. |
|
|
store |
6 |
Fatty acid |
|
||
3 |
Fatty acid-CoA |
|
|
|
|
|
|
|
|
synthase |
|
|
|
|
Triacylglycerols |
|
|
|
2.3.1.85 |
|
|||
|
ligase 6.2.1.3 |
|
|
|
|
|
|
|
|
|
|
4 |
Carnitine O- |
|
Insulin |
2 |
|
COO |
|
|
|
|
|
palmitoyltrans- |
|
|
|
|
|
|
|||||
|
|
|
|
|
|
|
|
||||
|
ferase 2.3.1.21 |
|
|
|
Free fatty acids |
|
|
|
From the |
|
|
|
|
|
|
|
|
|
|
|
|||
|
|
|
|
|
|
|
|
|
|
|
|
|
|
|
|
|
|
|
|
|
|
intestine |
|
|
|
|
|
|
|
1 |
Insulin |
|
|
|
|
|
|
|
COO |
|
|
|
|
|
|
Chylo- |
|
|
|
|
|
|
|
|
|
|
|
|
|
|
Fatty acid-albumin complex |
|
|
|
|
|
|
microns |
|
||
Blood |
|
|
|
|
|
VLDL |
|
|
|
||
|
|
|
|
|
|
|
|
|
|
||
|
|
Free fatty acids |
Hepatocyte |
|
|
|
|
|
|||
|
|
|
|
|
|
|
|
|
|
||
|
CoA |
|
ATP |
|
|
|
|
|
|
|
|
|
|
|
3 |
|
|
|
Triacylglycerols |
|
|
|
|
|
|
|
AMP+ P P |
|
|
|
|
|
|
|
|
|
|
Acyl CoA |
|
|
|
Fat biosynthesis |
|
|
|
||
|
|
|
|
|
|
|
|
|
|
||
Mitochondrion |
|
4 |
|
|
|
Acyl CoA |
|
|
|
||
|
|
|
|
|
|
|
|
|
|
||
|
|
Acyl CoA |
|
|
Unsaturated |
|
Elongated |
|
|||
|
|
|
|
|
|
fatty acids |
|
fatty acids |
|
||
NADH |
β-Oxidation |
|
|
|
Palmitate |
|
|
|
|||
+H |
|
|
|
|
|
|
|
|
|
||
|
|
|
|
|
|
|
|
|
|
|
|
|
|
|
|
|
|
NADP |
|
|
CO2 |
|
|
|
|
|
|
|
|
|
7x |
6 |
|
|
|
|
|
Acetyl CoA |
|
|
NADPH |
|
Acetyl CoA |
|
|||
|
|
|
|
|
or acyl CoA |
|
|||||
|
|
|
|
|
|
+H |
|
|
|
||
|
|
|
|
|
|
|
|
|
|
|
|
|
|
|
|
|
|
|
Malonyl CoA |
|
|
|
|
|
Ketone bodies |
Citrate |
|
|
ADP+ P |
|
Insulin |
|
|||
|
|
|
|
|
|
|
|||||
|
|
|
|
|
|
|
|
5 |
|
||
|
|
|
|
|
|
|
|
Glucagon |
|
||
|
|
|
|
|
|
|
|
|
|
||
|
|
|
Citric acid |
|
|
ATP |
|
|
HCO3 |
|
|
|
|
|
|
|
|
Acetyl CoA |
|
|
|
||
|
|
|
cycle |
|
|
|
|
|
|
||
|
|
|
Respiratory |
|
|
|
|
|
|
|
|
|
|
|
chain |
|
|
|
|
|
|
|
|
|
|
|
|
|
|
Amino acid |
|
Glycolysis |
|
||
|
Supply |
|
|
|
|
degradation |
|
|
|||
|
|
|
|
|
|
|
|
|
|||
|
of energy |
|
|
|
|
|
|
|
|
|
|
|
to other |
|
CO2+ATP |
|
|
Amino acids |
|
Glucose |
|
||
|
tissues |
|
|
|
|
|
|||||
|
|
|
|
Fatty acid |
|
Fatty acid |
|
|
Most important |
|
|
|
|
|
|
|
|
|
precursor |
|
|||
|
|
|
|
degradation |
biosynthesis |
|
|
||||
|
|
|
|
|
|
|
|
||||

164 Metabolism
Fatty acid degradation
A. Fatty acid degradation: Ε-oxidation
After uptake by the cell, fatty acids are activated by conversion into their CoA deriva- tives—acyl CoA is formed. This uses up two energy-rich anhydride bonds of ATP per fatty acid (see p. 162). For channeling into the mitochondria, the acyl residues are first transferred to carnitine and then transported across the inner membrane as acyl carnitine (see B).
The degradation of the fatty acids occurs in the mitochondrial matrix through an oxidative cycle in which C2 units are successively cleaved off as acetyl CoA (activated acetic acid). Before the release of the acetyl groups, each CH2 group at C-3 of the acyl residue (the β-C atom) is oxidized to the keto group— hence the term -oxidation for this metabolic pathway. Both spatially and functionally, it is closely linked to the tricarboxylic acid cycle (see p. 136) and to the respiratory chain (see
p.140).
[1]The first step is dehydrogenation of acyl
CoA at C-2 and C-3. This yields an unsaturated ∆2-enoyl-CoA derivative with a trans-config- ured double bond. The two hydrogen atoms are initially transferred from FAD-containing acyl CoA dehydrogenase to the electron-trans- ferring flavoprotein (ETF). ETF dehydrogenase
[5] passes them on from ETF to ubiquinone (coenzyme Q), a component of the respiratory chain (see p. 140). Other FAD-containing mitochondrial dehydrogenases are also able to supply the respiratory chain with electrons in this fashion.
There are three isoenzymes (see p. 98) of acyl CoA dehydrogenase that are specialized for long-chain fatty acids (12–18 C atoms), medium-chain fatty acids (4–14), and shortchain fatty acids (4–8).
[2]The next step in fatty acid degradation is the addition of a water molecule to the double bond of the enoyl CoA (hydration), with formation of -hydroxyacyl CoA.
[3]In the next reaction, the OH group at C- 3 is oxidized to a carbonyl group (dehydrogenation). This gives rise to -ketoacyl CoA,
and the reduction equivalents are transferred to NAD+, which also passes them on to the respiratory chain.
[4] β-Ketoacyl-CoA is now broken down by an acyl transferase into acetyl CoA and an acyl CoA shortened by 2 C atoms (“thioclastic cleavage”).
Several cycles are required for complete degradation of long-chain fatty acids—eight cycles in the case of stearyl-CoA (C18:0), for example. The acetyl CoA formed can then undergo further metabolism in the tricarboxylic acid cycle (see p. 136), or can be used for biosynthesis. When there is an excess of acetyl CoA, the liver can also form ketone bodies (see p. 312).
When oxidative degradation is complete, one molecule of palmitic acid supplies around 106 molecules of ATP, corresponding to an energy of 3300 kJ mol–1. This high energy yield makes fats an ideal form of storage for metabolic energy. Hibernating animals such as polar bears can meet their own energy requirements for up to 6 months solely by fat degradation, while at the same time producing the vital water they need via the respiratory chain (“respiratory water”).
B. Fatty acid transport
The inner mitochondrial membrane has a group-specific transport system for fatty acids. In the cytoplasm, the acyl groups of activated fatty acids are transferred to carnitine by carnitine acyltransferase [1]. They are then channeled into the matrix by an acylcarnitine/carnitine antiport as acyl carnitine, in exchange for free carnitine. In the matrix, the mitochondrial enzyme carnitine acyltransferase catalyzes the return transfer of the acyl residue to CoA.
The carnitine shuttle is the rate-determin- ing step in mitochondrial fatty acid degradation. Malonyl CoA, a precursor of fatty acid biosynthesis, inhibits carnitine acyltransferase
(seep. 162),and thereforealsoinhibitsuptake of fatty acids into the mitochondrial matrix.
The most important regulator of β-oxida- tion is the NAD+/NADH+H+ ratio. If the respiratory chain is not using any NADH+H+, then not only the tricarboxylic acid cycle (see p. 136) but also β-oxidation come to a standstill due to the lack of NAD+.
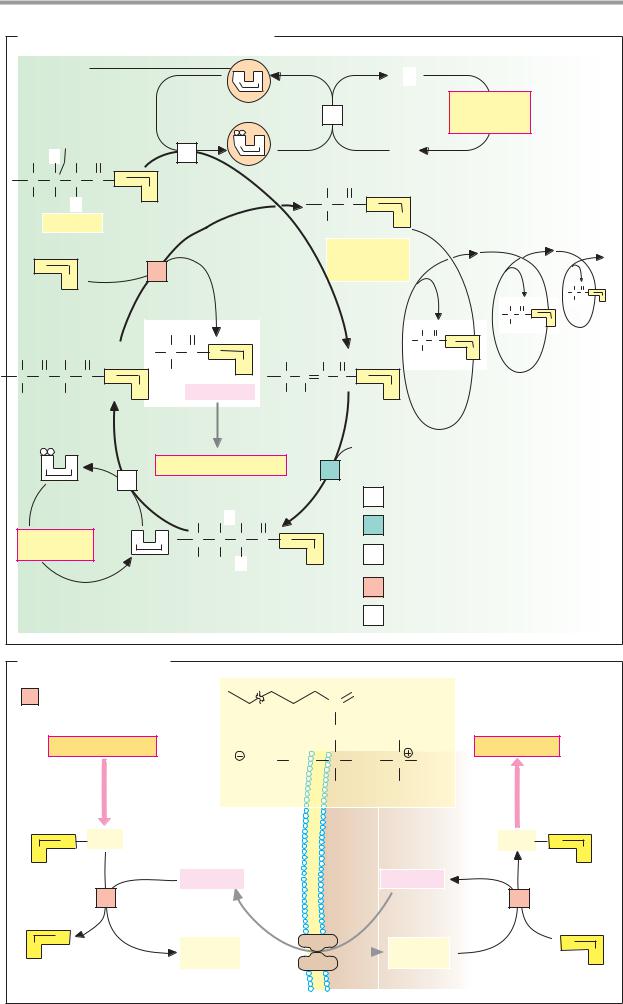
|
|
|
|
|
|
|
|
|
|
|
|
|
|
|
Lipid Metabolism |
|
165 |
|||
A. Fatty acid degradation: β-oxidation |
|
|
|
|
|
|
|
|
|
|
|
|||||||||
Electron- |
|
|
|
|
|
|
|
|
|
|
|
QH2 |
|
|
|
|
|
|
||
transferring |
|
|
|
|
|
F |
A |
|
|
|
|
|
|
|
|
|
|
|||
flavoprotein (ETF) |
|
|
|
|
|
|
|
|
|
|
|
Respiratory |
|
|
|
|||||
|
|
|
|
|
|
|
|
|
|
|
5 |
|
|
|
|
|
|
|
||
|
|
|
|
|
|
|
|
|
|
|
|
|
|
|
chain |
|
|
|
|
|
|
|
β-Carbon |
|
|
1 |
|
F |
A |
|
|
|
|
Q |
|
|
|
|
|
|
|
H |
H |
H |
O |
|
|
|
|
|
|
|
|
|
|
|
|
|
|
|
||
C |
C |
C |
C |
S |
A |
|
|
|
|
|
H |
O |
|
|
|
|
|
|
|
|
H |
H |
H |
|
|
|
|
|
|
|
C |
C |
S |
|
|
|
|
|
|
|
|
|
|
|
|
|
|
|
|
|
|
|
|
|
|
|
||||||
|
Acyl CoA |
|
|
|
|
|
|
|
H |
|
|
A |
|
|
|
|
|
|
||
|
|
|
|
|
|
|
|
|
|
|
|
|
|
|
|
|
|
|
|
|
|
|
|
|
|
|
|
|
|
|
|
Acyl CoA |
|
|
|
|
|
|
|
||
S |
|
|
|
|
4 |
|
|
|
|
|
(n – 2 carbons) |
|
|
|
|
|
|
|||
|
|
A |
|
|
|
|
|
|
|
|
|
|
|
|
|
|
|
|
|
|
|
|
|
|
|
|
|
|
|
|
|
|
|
|
|
|
|
H |
O |
|
|
|
|
|
|
|
|
|
|
|
|
|
|
|
|
|
|
|
|
H C |
C |
S |
|
|
|
|
|
|
|
|
|
|
|
|
|
|
|
|
H |
O |
H |
|
A |
|
|
|
|
|
|
|
|
|
|
|
|
|
|
|
|
|
|
|||
|
|
|
|
|
|
|
|
|
|
|
|
|
|
|
|
H C |
C |
S |
|
|
|
|
|
|
|
H |
O |
|
|
|
|
|
|
|
H |
O |
H |
|
A |
|
|
|
|
|
|
|
|
|
|
|
|
|
|
|
|
|
|
|||||
|
|
|
|
|
|
|
|
|
|
|
|
|
|
|
|
|
|
|
||
H O H O |
|
|
H C C S |
|
|
|
|
|
|
H C |
C |
S |
|
|
|
|
||||
|
|
A |
|
H |
H O |
|
H |
|
A |
|
|
|
|
|||||||
C C C C S |
|
H |
|
|
|
C C C C S |
|
|
|
|
|
|
|
|||||||
|
|
|
|
|
|
|
|
|
|
|
|
|||||||||
H |
|
H |
|
A |
|
Acetyl CoA |
|
H |
H |
|
|
A |
|
|
|
|
|
|
||
|
|
|
|
|
|
|
|
|
|
|
|
|
|
|
|
|
||||
|
|
|
|
|
|
|
|
|
|
|
|
|
H2O |
|
|
|
|
|
|
|
|
N |
A |
|
3 |
Tricarboxylic acid cycle |
|
2 |
|
|
|
|
|
|
|
|
|
||||
|
|
|
|
|
|
|
|
|
|
|
|
|
|
|
|
|
|
|
||
|
|
|
|
|
|
|
|
|
|
|
|
1 |
|
|
|
|
|
|
|
|
|
|
|
|
|
|
|
|
|
|
|
|
|
Acyl-CoA dehydrogenase 1.3.99.3 |
|
|
|||||
|
|
|
|
|
|
H |
OH H |
O |
|
|
|
2 Enoyl-CoA hydratase 4.2.1.17 |
|
|
||||||
Respiratory |
|
N |
A |
C |
C |
C |
C |
|
|
|
|
|
||||||||
|
S |
|
|
|
3-Hydroxyacyl-CoA dehydrogenase |
|
|
|||||||||||||
chain |
|
|
|
|
|
|
|
|
|
A |
|
3 |
|
|
||||||
|
|
|
|
|
|
H |
H |
H |
|
|
|
1.1.1.35 |
|
|
|
|
|
|
||
|
|
|
|
|
|
|
|
|
|
|
|
|
4 Acetyl-CoA acyltransferase 2.3.1.16 |
|
|
|||||
|
|
|
|
|
|
|
|
|
|
|
|
|
5 |
ETF dehydrogenase [FAD, Fe4S4] 1.5.5.1 |
||||||
B. Fatty acid transport |
|
|
|
|
|
|
||
1 |
Carnitine |
|
|
O |
Acyl |
|
|
|
|
O-palmitoyltransferase |
|
C |
|
carnitine |
|
||
|
2.3.1.21 |
|
O |
|
CH3 |
|
|
|
|
Fat degradation |
|
|
β-Oxidation |
||||
|
|
|
|
|
||||
|
|
OOC |
CH2 |
C |
CH2 |
N |
CH3 |
|
|
|
|
|
H |
|
CH3 |
|
|
A |
S |
Acyl |
|
|
|
|
Acyl |
S |
|
|
|
|
|
|
|
A |
|
|
|
Carnitine |
|
|
|
Carnitine |
|
|
|
|
1 |
|
|
|
|
1 |
|
A |
S |
Acyl |
|
|
|
Acyl |
|
S |
|
|
|
|
|
||||
|
|
carnitine |
|
A |
|
carnitine |
A |
|
|
|
|
|
|
|
|
|
|

166 Metabolism
Minor pathways of fatty acid degradation
Most fatty acids are saturated and even-num- bered. They are broken down via Ε-oxidation (see p.164). In addition, there are special pathways involving degradation of unsaturated fatty acids (A), degradation of fatty acids with an odd number of C atoms (B), α and ω oxidation of fatty acids, and degradation in peroxisomes.
A. Degradation of unsaturated fatty acids
Unsaturated fatty acids usually contain a cis double bond at position 9 or 12—e.g., linoleic acid (18:2; 9,12). As with saturated fatty acids, degradation in this case occurs via β-oxida- tion until the C-9-cis double bond is reached. Since enoyl-CoA hydratase only accepts substrates with trans double bonds, the corresponding enoyl-CoA is converted by an isomerase from the cis-∆3, cis- ∆6 isomer into the trans-∆3,cis-∆6 isomer [1]. Degradation by β - oxidation can now continue until a shortened trans-∆2, cis-∆4 derivative occurs in the next cycle. This cannot be isomerized in the same way as before, and instead is reduced in an NADPH-dependent way to the trans-∆3 compound [2]. After rearrangement by enoyl-CoA isomerase [1], degradation can finally be completed via normal β-oxidation.
B. Degradation of oddnumbered fatty acids
Fatty acids with an odd number of C atoms are treated in the same way as “normal” fatty acids—i.e., they are taken up by the cell with ATP-dependent activation to acyl CoA and are transported into the mitochondria with the help of the carnitine shuttle and broken down there by β−oxidation (see p. 164). In the last step, propionyl CoA arises instead of acetyl CoA. This is first carboxylated by propionyl CoA carboxylase into (S)-methylmalonyl CoA [3], which—after isomerization into the (R) enantiomer (not shown; see p. 411)—is isomerized into succinyl CoA [4].
Various coenzymes are involved in these reactions. The carboxylase [3] requires biotin, and the mutase [4] is dependent on coenzyme B12 (5 -deoxyadenosyl cobalamin; see p. 108). Succinyl-CoA is an intermediate in the tricar-
boxylic acid cycle and is available for gluconeogenesis through conversion into oxaloacetate. Odd-numbered fatty acids from pro- pionyl-CoA can therefore be used to synthesize glucose.
This pathway is also important for ruminant animals, which are dependent on symbiotic microorganisms to break down their food. The microorganisms produce large amounts of propionic acid as a degradation product, which the host can channel into the metabolism in the way described.
Further information
In addition to the degradation pathways described above, there are also additional special pathways for particular fatty acids found in food.
α Oxidation is used to break down methylbranched fatty acids. It takes place through step-by-step removal of C1 residues, begins with a hydroxylation, does not require coenzyme A, and does not produce any ATP.
ω Oxidation—i.e., oxidation starting at the end of the fatty acid—also starts with a hydroxylation catalyzed by a monooxygenase (see p. 316), and leads via subsequent oxidation to fatty acids with two carboxyl groups, which can undergo β -oxidation from both ends until C8 or C6 dicarboxylic acids are reached, which can be excreted in the urine in this form.
Degradation of unusually long fatty acids.
An alternative form of β-oxidation takes place in hepatic peroxisomes, which are specialized for the degradation of particularly long fatty acids (n > 20). The degradation products are acetyl-CoA and hydrogen peroxide (H2O2), which is detoxified by the catalase (see p. 32) common in peroxisomes.
Enzyme defects are also known to exist in the minor pathways of fatty acid degradation. In Refsum disease, the methyl-branched phytanic acid (obtained from vegetable foods) cannot be degraded by α-oxidation. In Zellweger syndrome, a peroxisomal defect means that long-chain fatty acids cannot be degraded.
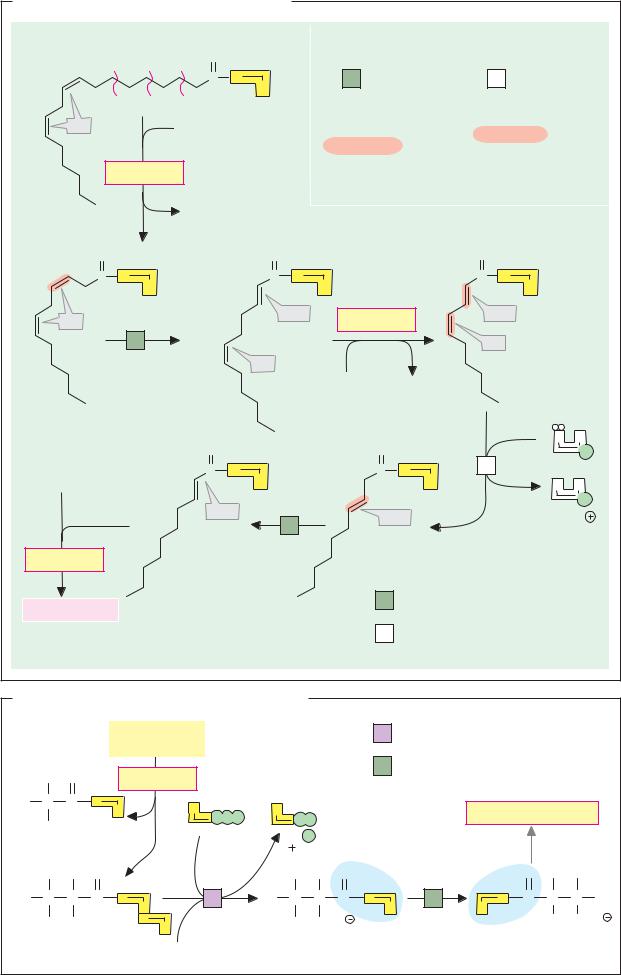
Lipid Metabolism |
167 |
A. Degradation of unsaturated fatty acids
Linoleoyl CoA (18 : 2; 9,12) |
O |
|
|
|
|
|
|
|
|
|
|
|
|
|
|
|
|
9 |
|
C |
S |
1 |
|
|
2 |
|
|
|
|
|
|
||||
|
|
|
A |
|
|
|
|
|
12 |
|
|
|
Shift and |
|
Reduction and |
|
|
|
|
|
izomerization |
shift of the |
|
|||
cis |
|
3 CoA |
|
|
||||
|
|
of the |
|
|
marked |
|
||
|
|
|
|
marked |
|
|
||
|
|
|
|
|
double bonds |
|
||
|
|
|
|
double bond |
|
|||
|
β-Oxidation |
|
|
|
|
|||
|
|
|
|
|
|
|
|
|
|
|
3 Acetyl CoA |
|
|
|
|
|
|
O |
|
|
O |
|
|
|
O |
|
3 |
S |
|
2 C S |
|
|
|
C S |
|
C |
|
|
|
2 |
|
|||
|
A |
|
A |
|
|
|
A |
|
6 |
|
|
trans |
|
|
4 |
trans |
|
cis |
|
|
β-Oxidation |
|
||||
|
|
|
|
|
||||
|
1 |
|
6 |
|
|
|
cis |
|
|
|
|
|
|
|
|
||
|
|
|
cis |
|
|
|
|
|
|
|
|
|
CoA |
Acetyl CoA |
|
|
|
|
|
|
|
|
|
|
NADPH |
|
|
|
|
|
|
|
|
N |
A |
|
|
O |
|
|
O |
|
|
P |
4 CoA |
|
2 C |
S |
|
C S |
2 |
|
|
|
|
|
|
|||||
|
|
A |
|
|
A |
N |
A |
|
|
|
trans |
3 |
|
|
|
P |
|
|
|
|
trans |
NADP |
||||
|
|
|
1 |
|
||||
|
|
|
|
|
|
|||
β-Oxidation |
|
|
|
|
|
|
|
|
|
|
|
|
|
1 |
Enoyl-CoA isomerase |
|
|
5 Acetyl CoA |
|
|
|
|
5.3.3.8 |
|
|
|
|
|
|
|
|
|
|
||
|
|
|
|
|
|
|
|
|
|
2 |
2,4-Dienoyl-CoA reductase |
|
|
||
|
|
|
|
|
|
|
|
|
|
1.3.1.34 |
|
|
|
|
|
|
|
|
|
|
|
|
|
|
|
|
|
|
|
|
|
B. Degradation of odd-numbered fatty acids |
|
|
|
|
|
|
|
|
|
||||||
|
|
|
|
Odd-numbered |
|
|
|
|
3 |
Propionyl-CoA carboxylase |
|
|
|||
|
|
|
|
|
|
|
|
6.4.1.3 [biotin] |
|
|
|
||||
|
|
|
|
fatty acids |
|
|
|
|
|
|
|
|
|||
|
|
|
|
|
|
|
|
|
|
|
|
|
|
||
|
|
|
|
|
|
|
|
|
|
4 |
Methylmalonyl-CoA mutase |
|
|
||
|
H |
O |
|
|
β-Oxidation |
|
|
|
|
5.4.99.2 [cobamide] |
|
|
|
||
|
|
|
|
|
|
|
|
|
|
|
|||||
|
|
|
|
|
|
|
|
|
|
|
|
|
|||
H |
C |
C |
S |
|
A |
A |
|
|
|
|
|
|
|
|
|
|
A |
|
|
|
|
|
Tricarboxylic acid cycle |
||||||||
|
|
|
|
|
|
|
|
|
|||||||
|
H |
|
|
|
P P P |
P |
P |
|
|
|
|
||||
|
|
|
|
|
|
|
|
|
|
|
|
|
|||
|
|
|
|
|
|
P |
|
|
|
|
|
|
|
|
|
n Acetyl CoA |
|
|
|
|
|
|
|
|
|
|
|
|
|||
|
|
|
|
|
|
|
|
|
|
|
|
|
|||
|
H |
H |
O |
|
|
H |
H |
O |
|
|
|
|
O |
H |
H |
H C C C |
S |
3 |
H C C C |
S |
|
4 |
S |
C C C H |
|||||||
|
|
|
|
|
A |
|
|
|
|
A |
|
A |
|
|
|
|
H |
H |
|
|
S |
H |
COO |
|
|
|
|
|
H |
COO |
|
|
|
|
A |
|
|
|
|
|
|||||||
Propionyl CoA |
|
CO2 |
Methylmalonyl CoA |
Succinyl CoA |
|
||||||||||

168 Metabolism
Fatty acid synthesis
In the vertebrates, biosynthesis of fatty acids is catalyzed by fatty acid synthase, a multifunctional enzyme. Located in the cytoplasm, the enzyme requires acetyl CoA as a starter molecule. In a cyclic reaction, the acetyl residue is elongated by one C2 unit at a time for seven cycles. NADPH+H+ is used as a reducing agent in the process. The end product of the reaction is the saturated C16 acid, palmitic acid.
A. Fatty acid synthase
Fatty acid synthase in vertebrates consists of two identical peptide chains—i.e., it is a homodimer. Each of the two peptide chains, which are shown here as hemispheres, catalyzes all seven of the partial reactions required to synthesize palmitate. The spatial compression of several successive reactions into a single multifunctional enzyme has advantages in comparison with separate enzymes. Competing reactions are prevented, the individual reactions proceed in a coordinated way as if on a production line, and due to low diffusion losses they are particularly ef cient.
Each subunit of the enzyme binds acetyl residues as thioesters at two different SH groups: at one peripheral cysteine residue (CysSH) and one central 4 -phosphopante- theine group (Pan-SH). Pan-SH, which is very similar to coenzyme A (see p. 12), is covalently bound to a protein segment of the synthase known as the acyl-carrier protein (ACP). This part functions like a long arm that passes the substrate from one reaction center to the next. The two subunits of fatty acid synthase cooperate in this process; the enzyme is therefore only capable of functioning as a dimer.
Spatially, the enzyme activities are arranged into three different domains. Domain 1 catalyzesthe entryofthe substrates acetyl CoA and malonyl CoA by [ACP]-S- acetyltransferase [1] and [ACP]-Smalonyl transferase [2] and subsequent condensation of the two partners by 3-oxoacyl-[ACP]- synthase [3]. Domain 2 catalyzes the conversion of the 3-oxo group to a CH2 group by 3- oxoacyl-[ACP]-reductase [4], 3-hydroxyacyl- [ACP]-dehydratase [5], and enoyl-[ACP]-re-
ductase [6]. Finally, domain 3 servesto release the finished product by acyl-[ACP]-hydrolase [7] after seven steps of chain elongation.
B. Reactions of fatty acid synthase
The key enzyme in fatty acid synthesis is acetyl CoA carboxylase (see p. 162), which precedes the synthase and supplies the malonylCoA required for elongation. Like all carboxylases, the enzyme contains covalently bound biotin as a prosthetic group and is hormonedependently inactivated by phosphorylation or activated by dephosphorylation (see p. 120). The precursor citrate (see p. 138) is an allosteric activator, while palmitoyl-CoA inhibits the end product of the synthesis pathway.
[1]The first cycle (n = 1) starts with the transfer of an acetyl residue from acetyl CoA totheperipheralcysteineresidue(Cys-SH). At the same time,
[2]a malonyl residue is transferred from malonyl CoA to 4-phosphopantetheine (PanSH).
[3]By condensation of the acetyl resi- due—or(inlatercycles)the acylresidue—with the malonyl group, with simultaneous decarboxylation, the chain is elongated.
[4]–[6] The following three reactions (reduction of the 3-oxo group, dehydrogenation of the 3-hydroxyl derivative, and renewed
reduction of it) correspond in principle to a reversal of β-oxidation, but theyare catalyzed by other enzymes and use NADPH+H+ instead of NADH+H+ for reduction. They lead to an acyl residue bound at Pan-SH with 2n + 2 C atoms (n = the number of the cycle). Finally, depending on the length of the product,
[1 ] The acyl residue is transferred back to the peripheral cysteine, so that the next cycle can begin again with renewed loading of the ACP with a malonyl residue, or:
[7]After seven cycles, the completed palmitic acid is hydrolytically released.
In all, one acetyl-CoA and seven malonylCoA are converted with the help of 14 NADPH+H+ into one palmitic acid, 7 CO2, 6 H2O, 8 CoA and 14 NADP+. Acetyl CoA carboxylase also uses up seven ATP.

|
|
|
|
|
|
|
|
|
|
|
|
|
Lipid Metabolism |
169 |
|||||
|
A. Fatty acid synthase |
|
|
|
|
|
B. Reactions of fatty acid synthesis |
||||||||||||
|
1 2 |
Substrate entry |
5 |
Water cleavage |
1 |
|
|
|
|
|
7 |
Palmitate |
|||||||
|
|
|
|
|
|
|
|
|
|
|
|
|
|
|
|
||||
|
|
3 |
Chain elongation |
6 |
Reduction |
|
|
|
|
|
H2O |
|
Product |
||||||
|
|
|
|
|
|
|
|
|
|
|
|
|
|
|
|
||||
|
|
4 |
Reduction |
|
7 |
Product release |
|
O |
H |
H |
H |
|
|
release |
|||||
|
|
|
|
|
|
|
|
|
|
|
|
|
|
|
|
||||
|
|
|
|
|
|
|
|
|
|
|
Pan–S |
C |
C |
C |
C |
H |
|
Acyl- |
|
|
|
|
|
|
|
|
|
|
Palmitate |
Cys–SH |
|
H |
H |
H |
|
|
|
|
|
|
|
|
domain |
|
|
|
|
|
|
|
|
|
|
|
|
||||
|
|
|
|
6 |
|
|
|
|
|
|
|
|
|
N |
A |
NADP |
|||
|
|
st |
1 |
5 |
|
|
|
|
|
6 |
|
|
|
P |
|||||
|
|
|
2 |
|
|
4 |
|
|
|
|
|
|
|
|
|
|
|||
|
|
1 |
|
|
|
|
|
|
|
|
|
|
|
|
|
|
|||
|
|
|
|
|
|
|
|
|
|
7 |
|
|
|
|
|
N |
A |
NADP+H |
|
|
|
|
|
|
P -Pantethein |
|
ACP |
|
|
|
|
|
|
P |
|||||
|
|
|
3 |
|
|
|
|
|
|
|
|
|
|
|
|
||||
|
|
|
|
|
|
|
|
|
|
|
O |
H |
|
H |
|
|
|
|
|
|
|
|
Cys |
SH |
|
|
|
|
SH |
|
|
|
|
|
|
|
|||
|
|
|
|
|
|
|
|
|
|
|
|
|
|
|
|
|
|||
|
|
|
SH |
|
|
|
|
SH |
Cys |
Pan–S |
C |
C |
C |
C |
H |
|
trans-Enoyl- |
||
|
|
|
|
|
|
|
|
3 |
|
|
|||||||||
|
|
|
ACP |
|
|
|
|
|
|
|
|
|
|
|
|
|
|
||
|
|
|
|
|
|
|
|
|
Cys–SH |
|
|
H |
H |
|
|
|
|
||
|
|
|
7 |
|
|
|
|
|
|
|
|
|
|
|
|
|
|||
|
|
|
|
|
|
|
|
|
|
|
|
|
|
|
|
|
|
|
|
|
|
|
|
4 |
5 |
|
2 |
1 |
|
|
|
|
|
|
|
H2O |
|
|
|
3 |
rd |
|
|
|
6 |
|
|
|
|
|
|
5 |
|
|
|
|
|
|
|
domain |
|
|
|
|
|
|
|
|
|
|
|
|
|
|
|||||
|
|
|
|
|
|
|
|
|
|
|
|
|
|
|
|
|
|||
|
|
|
|
|
|
|
|
|
|
|
|
|
|
|
|
|
|
||
|
|
|
2nd |
domain |
|
|
|
|
|
|
|
|
|
|
|
|
|
|
|
|
|
|
|
|
|
|
|
|
|
O |
H |
OH H |
|
|
|
|
|||
|
|
|
|
|
|
|
|
Acetyl |
S |
Pan–S |
C |
C |
C |
C |
H |
|
3-Hydroxy- |
||
|
|
|
|
|
|
|
|
|
|
|
|
|
|
|
acyl- |
||||
|
|
|
|
|
|
|
|
|
|
A |
Cys–SH |
|
H |
H |
H |
|
|
|
|
|
|
|
|
|
|
|
|
|
|
|
|
|
|
|
|
||||
|
|
|
|
|
|
Malonyl |
S |
A |
|
|
|
|
|
|
N |
A |
NADP |
||
|
|
|
|
|
|
|
|
|
|
|
|
|
|
|
|||||
|
|
|
|
|
|
|
|
|
|
|
|
|
|
|
|
P |
|||
|
|
|
|
|
|
|
|
|
|
|
|
|
4 |
|
|
|
|
|
|
|
|
|
|
|
|
|
|
|
|
|
|
|
|
|
|
|
|
|
|
|
|
|
|
|
|
|
|
|
|
|
|
|
|
|
|
N |
A |
|
|
|
1 |
[ACP]-S-Acetyl- |
|
|
|
|
|
|
|
|
|
|
|
P |
NADP+H |
||||
|
|
|
|
|
|
|
|
|
|
|
|
|
|
|
|||||
|
|
|
transferase 2.3.1.38 |
|
|
|
|
|
|
O |
H |
O |
H |
|
|
|
|
||
|
|
|
|
|
|
|
|
|
|
|
|
|
|
|
|
||||
|
2 |
[ACP]-S-Malonyl- |
|
|
|
|
|
Pan–S |
C |
C |
C |
C |
H |
|
3-Oxoacyl- |
||||
|
|
|
transferase 2.3.1.39 |
|
|
|
|
|
|
|
|
|
|
|
|
|
|
||
|
|
|
3-Oxoacyl-[ACP] |
|
|
|
|
|
Cys–SH |
|
H |
|
H |
|
|
|
|
||
|
3 |
|
|
|
|
7x |
|
|
|
|
|
|
|
|
|
||||
|
|
|
synthase 2.3.1.41 |
|
|
|
|
|
|
|
|
|
|
CO2 |
|
|
|
||
|
|
|
|
|
|
|
|
|
|
|
|
|
3 |
|
|
|
|
|
|
|
4 |
3-Oxoacyl-[ACP] |
|
|
|
|
|
|
|
|
|
|
|
|
|
||||
|
|
|
|
|
|
|
|
|
|
H |
|
|
|
|
|||||
|
|
|
reductase 1.1.1.100 |
|
|
|
|
|
|
|
|
|
|
|
|
|
|||
|
|
|
|
|
|
|
|
|
|
|
|
O |
H |
|
|
|
|
|
|
|
5 |
3-Hydroxypalmitoyl-[ACP] |
|
|
|
|
Pan–S |
C |
C |
COO |
|
|
|
|
|||||
|
|
|
dehydratase 4.2.1.61 |
|
|
|
|
|
|
|
|
|
|||||||
|
6 |
Enoyl-[ACP] |
|
|
|
|
|
|
|
|
H |
|
|
|
|
|
|
||
|
|
|
|
|
|
|
|
|
|
|
|
|
|
|
|
||||
|
|
|
reductase (NADPH) 1.3.1.10 |
|
|
|
|
O |
H |
|
|
|
|
|
|
||||
|
|
|
|
|
|
|
|
|
|
|
|
|
|
|
|
|
S |
||
|
|
|
|
|
|
|
|
|
|
|
|
|
|
|
|
|
|
|
|
|
7 |
Acyl-[ACP] |
|
|
|
S |
|
|
Cys–S |
C |
C |
H |
|
|
|
|
A |
||
|
|
|
|
|
|
|
|
|
|
|
|||||||||
|
hydrolase 3.1.2.14 |
|
|
|
A |
|
|
|
|
2 |
|
|
|||||||
|
|
|
|
|
|
|
|
|
|
1 |
|
|
H |
|
|
|
|
|
|
|
|
|
|
|
|
|
|
|
|
|
|
|
|
|
|
|
|
||
|
|
|
|
|
|
|
|
|
|
|
|
|
|
|
|
|
|
|
|
|
|
|
|
|
|
Starting reaction |
Acetyl |
S |
Acetyl or |
|
|
|
Malonyl |
S |
|||||
|
|
|
|
|
|
acyl residue |
|
|
|
|
A |
||||||||
|
|
|
|
|
|
|
|
|
|
|
A |
|
|
|
|
||||
|
|
|
|
|
|
|
|
|
|
|
|
|
|
|
|
|
|
|
|

170 Metabolism
Biosynthesis of complex lipids
A. Biosynthesis of fats and phospholipids
Complex lipids, such as neutral fats (triacylglycerols), phospholipids, and glycolipids, are synthesized via common reaction pathways. Most of the enzymes involved are associated with the membranes of the smooth endoplasmic reticulum.
The synthesis of fats and phospholipids starts with glycerol 3-phosphate. This compound can arise via two pathways:
[1]By reduction from the glycolytic intermediate glycerone 3-phosphate (dihydroxyacetone 3-phosphate; enzyme: glyc- erol-3-phosphate dehydrogenase (NAD+) 1.1.1.8), or:
[2]By phosphorylation of glycerol deriving from fat degradation (enzyme: glycerol kinase 2.7.1.30).
[3]Esterification of glycerol 3-phosphate with a long-chain fatty acid produces a strongly amphipathic lysophosphatidate (enzyme: glycerol-3-phosphate acyltransferase 2.3.1.15). In this reaction, an acyl residue is transferred from the activated precursor acyl-CoA to the hydroxy group at C-1.
[4]A second esterification of this type leads to a phosphatidate (enzyme: 1-acylglycerol-3- phosphate acyltransferase 2.3.1.51). Unsaturated acyl residues, particularly oleic acid, are usually incorporated at C-2 of the glycerol. Phosphatidates (anions of phosphatidic acids) are the key molecules in the biosynthesis of fats, phospholipids, and glycolipids.
[5]To biosynthesize fats (triacylglycerols), the phosphate residue is again removed by hydrolysis (enzyme: phosphatidate phosphatase 3.1.3.4). This produces diacylglycerols (DAG).
[6]Transfer of an additional acyl residue to DAG forms triacylglycerols (enzyme: diacylglycerol acyltransferase 2.3.1.20). This completes the biosynthesis of neutral fats. They are packaged into VLDLs by the liver and released into the blood. Finally, they are stored by adipocytes in the form of insoluble fat droplets.
The biosynthesis of most phospholipids also starts from DAG.
[7]Transfer of a phosphocholine residue to the free OH group gives rise to phosphatidylcholine (lecithin; enzyme: 1-alkyl-2-acetyl- glycerolcholine phosphotransferase 2.7.8.16). The phosphocholine residue is derived from the precursor CDP-choline (see p. 110). Phosphatidylethanolamine is similarly formed from CDP-ethanolamine and DAG. By contrast, phosphatidylserine is derived from phosphatidylethanolamine by an exchange of the amino alcohol. Further reactions serve to interconvert the phospholipids—e.g., phosphatidylserine can be converted into phosphatidylethanolamine by decarboxylation, and the latter can then be converted into phosphatidylcholine by methylation with S- adenosyl methionine (not shown; see also p. 409). The biosynthesis of phosphatidylinositol starts from phosphatidate rather than DAG.
[8]In the lumen of the intestine, fats from food are mainly broken down into monoacylglycerols (see p. 270). The cells of the intestinal mucosa re-synthesize these into neutral fats. This pathway also passes via DAG
(enzyme: acylglycerolpalmitoyl transferase 2.3.1.22).
[9]Transfer of a CMP residue gives rise first to CDP-diacylglycerol (enzyme: phosphatidatecytidyl transferase 2.3.1.22).
[10]Substitution of the CMP residue by inositol then provides phosphatidylinositol
(PtdIns; enzyme: CDPdiacylglycerolinositol-3- phosphatidyl transferase 2.7.8.11).
[12]An additional phosphorylation (enzyme: phosphatidylinositol-4-phosphate kinase 2.7.1.68) finally provides phosphaditylino-
sitol-4,5-bisphosphate (PIP2, PtdIns(4,5)P2). PIP2 is the precursor for the second messengers 2,3-diacylglycerol (DAG) and inositol-
1,4,5-trisphosphate (InsP3, IP3; see p. 367). The biosynthesis of the sphingolipids is
shown in schematic form on p. 409.
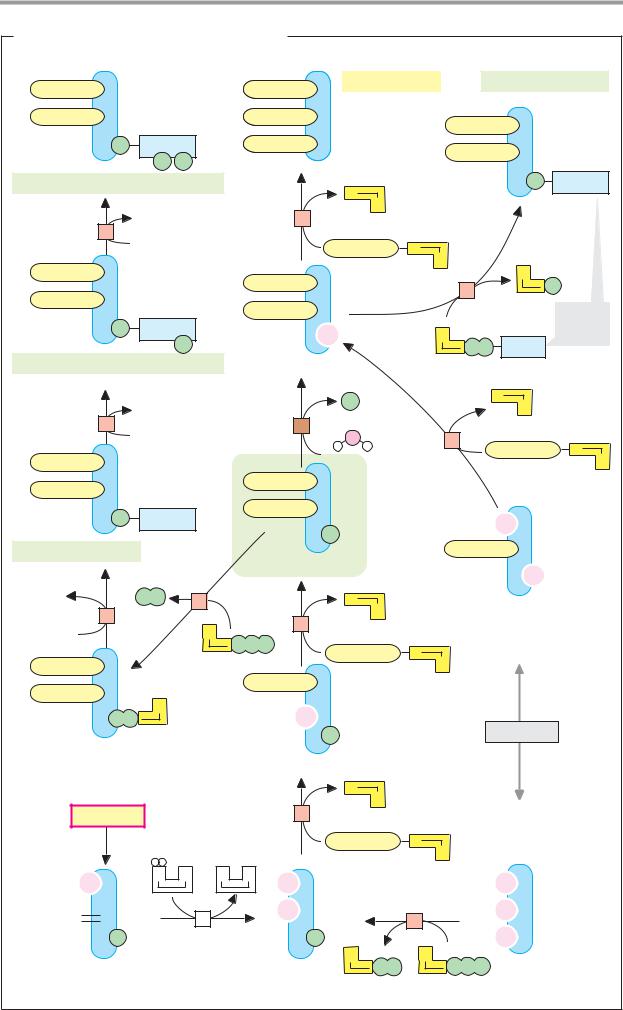
|
|
|
|
|
|
Lipid Metabolism |
171 |
||
A. Biosynthesis of fats and phospholipids |
|
|
|
|
|
||||
|
|
|
|
|
Triacylglycerol |
|
Phosphatidylcholine |
||
P |
Inositol |
|
|
|
|
|
|
|
|
|
P |
P |
|
|
|
|
|
|
|
Phosphatidylinositol 4,5-bisphosphate |
|
S |
|
|
P |
Choline |
|||
|
|
|
|
|
|
|
|
|
|
|
ADP |
|
|
6 |
A |
|
|
|
|
12 |
|
|
|
|
|
|
|
||
|
|
|
|
|
|
|
|
|
|
|
ATP |
|
|
|
|
S |
|
|
|
|
|
|
|
|
A |
|
C |
|
|
|
|
|
|
|
|
|
|
|
|
|
|
|
|
|
|
|
7 |
P |
|
|
|
|
|
|
|
|
|
|
|
|
|
|
|
|
|
|
|
|
or |
P |
Inositol |
|
|
|
C |
|
|
ethanol- |
|
|
|
|
|
|
amine |
||||
|
|
P |
|
|
|
P P |
Choline |
||
|
|
|
|
|
|
|
|||
Phosphatidylinositol 4-phosphate |
|
Diacylglycerol |
|
|
|
|
|
||
|
|
|
|
|
P |
|
|
S |
|
|
ADP |
|
|
|
|
|
A |
|
|
11 |
|
|
5 |
|
|
|
|
||
|
|
|
|
|
|
|
|
||
|
ATP |
|
|
|
|
|
8 |
|
S |
|
|
|
|
|
|
|
|
||
|
|
|
|
|
|
|
|
|
A |
P |
Inositol |
|
|
|
|
|
|
|
|
|
|
|
|
P |
|
|
|
|
|
Phosphatidylinositol |
|
|
|
Phosphatidate |
|
|
|
|
|
|
|
|
|
|
|
|
|
|
|
CMP |
P P |
9 |
|
|
S |
|
2-Monoacylglycerol |
|
|
10 |
|
|
|
4 |
A |
|
|
||
|
|
|
|
|
|
|
|
||
Inositol |
|
C |
|
|
|
|
|
|
|
|
|
P P P |
|
|
|
|
|
||
|
|
|
|
|
S |
|
|
|
|
|
|
|
|
|
|
|
|
|
|
|
|
|
|
|
Acyl CoA |
A |
|
|
|
|
|
|
|
|
|
|
|
|
|
P P |
C |
|
|
|
|
|
|
|
|
|
|
|
|
|
|
|
Food |
|
|
|
|
|
|
P |
|
|
|
|
|
CDP-diacylglycerol |
|
|
|
Lysophosphatidate |
|
|
|
|
|
|
|
|
|
|
|
|
|
||
|
|
|
|
|
S |
|
|
|
|
|
|
|
|
|
A |
|
|
|
|
Glycolysis |
|
|
|
3 |
|
|
|
|
|
|
|
|
|
|
|
S |
|
|
|
|
|
|
|
|
Acyl CoA |
A |
|
|
|
|
N |
A |
N |
A |
|
|
|
|
|
|
|
|
|
|
|
||||
O |
|
1 |
|
|
|
2 |
|
|
|
P |
|
|
|
P |
|
|
|
|
|
|
|
|
|
|
A |
A |
P P P |
|
|
Glycerone 3-phosphate |
|
|
Glycerol |
P P |
|
Glycerol |
|
||
|
|
|
|
|
|
||||
|
|
|
|
3-phosphate |
|
|
|
|
|
172 Metabolism
Biosynthesis of cholesterol
Cholesterol is a major constituent of the cell membranes of animal cells (see p. 216). It would be possible for the body to provide its full daily cholesterol requirement (ca. 1 g) by synthesizing it itself. However, with a mixed diet, only about half of the cholesterol is derived from endogenous biosynthesis, which takes place in the intestine and skin, and mainly in the liver (about 50%). The rest is taken up from food. Most of the cholesterol is incorporated into the lipid layer of plasma membranes, or converted into bile acids (see p. 314). A very small amount of cholesterol is used for biosynthesis of the steroid hormones (see p. 376). In addition, up to 1 g cholesterol per day is released into the bile and thus excreted.
A. Cholesterol biosynthesis
Cholesterol is one of the isoprenoids, synthesis of which starts from acetyl CoA (see p. 52). In a long and complex reaction chain, the C27 sterol is built up from C2 components. The biosynthesis of cholesterol can be divided into four sections. In the first (1), mevalonate, a C6 compound, arises from three molecules of acetyl CoA. In the second part (2), mevalonate is converted into isopentenyl diphosphate, the “active isoprene.” In the third part (3), six of these C5 molecules are linked to produce squalene, a C30 compound. Finally, squalene undergoes cyclization, with three C atoms being removed, to yield cholesterol (4). The illustration only shows the most important intermediates in biosynthesis.
(1) Formation of mevalonate. The conversion of acetyl CoA to acetoacetyl CoA and then to 3-hydroxy-3-methylglutaryl CoA (3-HMG CoA) corresponds to the biosynthetic pathway for ketone bodies (details on p. 312). In this case, however, the synthesis occurs not in the mitochondria as in ketone body synthesis, but in the smooth endoplasmic reticulum. In the next step, the 3-HMG group is cleaved from the CoA and at the same time reduced to mevalonate with the help of NADPH+H+. 3- HMG CoA reductase is the key enzyme in cholesterol biosynthesis. It is regulated by repression of transcription (effectors: oxysterols such as cholesterol) and by interconversion
(effectors: hormones). Insulin and thyroxine stimulate the enzyme and glucagon inhibits it by cAMP-dependent phosphorylation. A large supply of cholesterol from food also inhibits 3-HMG-CoA reductase.
(2) Formation of isopentenyl diphosphate.
After phosphorylation, mevalonate is decarboxylated to isopentenyl diphosphate, with consumption of ATP. This is the component from which all of the isoprenoids are built (see p. 53).
(3) Formation of squalene. Isopentenyl diphosphate undergoes isomerization to form dimethylallyl diphosphate. The two C5 molecules condense to yield geranyl diphosphate, and the addition of another isopentenyl diphosphate produces farnesyl diphosphate. This can then undergo dimerization, in a head-to-head reaction, to yield squalene. Farnesyl diphosphate is also the startingpoint for other polyisoprenoids, such as dolichol (see p. 230) and ubiquinone (see p. 52).
(4) Formation of cholesterol. Squalene, a linear isoprenoid, is cyclized, with O2 being consumed, to form lanosterol, a C30 sterol. Three methyl groups are cleaved from this in the subsequent reaction steps, to yield the end product cholesterol. Some of these reactions are catalyzed by cytochrome P450 systems (see p. 318).
The endergonic biosynthetic pathway described above is located entirely in the smooth endoplasmic reticulum. The energy needed comes from the CoA derivatives used and from ATP. The reducing agent in the formation of mevalonate and squalene, as well as in the final steps of cholesterol biosynthesis, is NADPH+H+.
The division of the intermediates of the reaction pathway into three groups is characteristic: CoA compounds, diphosphates, and highly lipophilic, poorly soluble compounds (squalene to cholesterol), which are bound to sterol carriers in the cell.

|
|
|
|
|
|
|
|
|
|
|
|
|
|
|
Lipid Metabolism |
|
173 |
|||||||
A. Cholesterol biosynthesis |
|
|
|
|
|
|
|
|
|
|
|
|
|
|
|
|
|
|
|
|
||||
Acetyl CoA |
1 |
Mevalonate |
2 |
|
|
Isopentenyl diphosphate |
3 |
Squalene |
4 |
|
|
|
Cholesterol |
|||||||||||
C2 |
3x |
C6 |
|
|
1C |
|
C5 |
|
|
|
6x |
|
C30 |
|
3C |
|
C27 |
|
||||||
|
|
|
|
|
|
|
|
|
|
|
|
|
|
|
|
|
||||||||
|
|
|
O |
|
|
|
|
|
|
|
|
|
|
|
|
|
|
|
|
|
|
|
|
|
Acetyl CoA |
3x H3C |
C |
S |
A |
|
|
|
|
|
|
|
|
|
CH3 |
CH2OH Mevalonate |
|||||||||
|
|
|
|
|
|
|
|
|
|
OOC |
CH2 |
C CH2 |
||||||||||||
|
|
|
|
|
|
|
|
|
|
|
|
|
||||||||||||
3-Hydroxy- |
|
|
|
|
|
|
|
|
|
|
|
|
|
OH |
|
|
|
|
|
|
|
|
|
|
|
|
|
|
|
|
|
|
|
|
|
|
|
|
|
|
|
|
|
|
|
|
|
||
3-methyl- |
|
|
|
|
|
|
|
|
2 |
A |
P |
P |
P |
|
|
|
|
|
|
|
|
|
|
|
glutaryl CoA |
|
|
|
|
|
|
|
|
|
|
|
|
|
|
|
|
|
|
|
|||||
CH3 |
O |
|
|
|
|
|
|
|
|
|
|
|
|
|
|
|
|
|
|
|
|
|
||
|
|
|
|
|
|
|
|
|
|
|
|
|
|
2 |
A |
|
|
|
|
|
|
|
||
OOC |
CH2 |
C CH2 |
C |
S |
|
|
|
|
|
|
|
|
|
|
|
|
P P |
|
|
|
|
|
|
|
|
|
|
|
|
|
|
|
|
|
|
|
|
|
|
|
|
|
|
||||||
A |
|
|
|
|
|
|
|
|
|
|
|
|
|
|
|
|
|
|
|
|||||
|
|
OH |
|
|
|
|
|
|
|
|
|
|
|
|
|
|
|
|
|
|
|
|
|
|
|
|
|
|
|
2 N |
A |
|
|
|
|
|
|
CH3 |
|
|
|
|
|
|
|
|
|
||
|
|
|
|
|
|
|
|
P |
|
|
|
OOC |
CH2 |
C CH2 |
CH2 |
O |
|
P |
P |
|
|
|||
Insulin |
|
|
|
|
|
|
|
|
|
|
|
|
|
|
||||||||||
|
|
|
|
|
|
|
|
|
|
|
|
|
|
|
|
|
||||||||
Thyroxin |
|
HMG-CoA |
|
|
Cholesterol |
|
|
|
|
|
|
OH |
|
|
Mevalonyl |
|
||||||||
|
reductase |
|
R |
|
|
|
|
|
|
|
|
|
diphosphate |
|||||||||||
|
|
|
|
A |
|
|
|
|
|
|
|
|||||||||||||
Glucagon |
|
1.1.1.34 |
|
|
|
|
|
|
|
|
|
|
|
|
|
|
|
|
|
|
|
|
||
|
|
|
|
|
|
|
P |
P |
|
P |
|
|
|
|
|
|
|
|
|
|
|
|||
|
|
|
|
|
|
|
|
|
|
|
|
|
|
|
|
|
|
|
|
|
||||
|
|
|
|
|
Key enzyme |
|
|
|
|
|
|
|
|
|
|
|
|
|
|
|
|
|||
|
|
|
|
|
|
|
|
|
|
|
|
|
|
|
|
CO2 |
|
|
|
A |
|
|
|
|
|
S |
|
|
|
|
2 N |
A |
|
|
|
|
|
|
|
P |
|
|
|
|
P P |
|
|||
|
A |
|
|
|
|
|
|
P |
|
|
|
|
|
|
|
|
|
|
|
|
|
|
|
|
|
|
CH3 |
|
|
|
|
|
|
|
|
|
|
CH3 |
|
|
|
|
|
|
|
|
|
||
|
|
|
|
|
|
|
|
|
|
|
|
C |
|
|
|
|
|
|
|
|
|
|
||
|
OOC |
CH2 C |
CH2 |
CH2OH |
|
|
|
|
|
|
|
|
O |
P |
P |
|
|
|
|
|
|
|
||
|
|
|
|
|
|
|
|
H2C |
|
|
|
|
|
|
|
|||||||||
|
|
OH |
|
|
|
|
|
|
|
|
|
|
|
|
|
|
|
|
|
|
||||
|
|
|
|
|
|
|
|
|
|
|
|
|
|
|
|
|
|
|
|
|
|
|
||
Mevalonate |
|
|
|
|
|
|
|
|
|
|
|
|
|
Isopentenyl diphosphate |
||||||||||
|
|
|
|
|
|
|
|
1 |
2 |
|
|
|
|
|
|
|
|
|
|
|
|
|
|
|
|
|
|
|
|
|
|
|
3 |
4 |
|
|
|
|
|
|
|
|
|
|
|
|
|
|
|
Dimethylallyl |
Isopentenyl diphosphate |
|
|
|
|
|
|
|
|
|
|
|
|
|
|
|
|
|||||||
diphosphate |
|
|
|
|
|
|
|
|
|
|
|
Squalene |
||||||||||||
|
|
|
|
|
|
|
|
|
|
|
|
|
|
|
|
|
|
|||||||
O |
P P |
|
|
|
O |
P |
P |
|
|
|
|
|
|
|
|
|
|
|
|
|
|
|
|
|
|
|
|
|
|
|
|
|
|
|
|
|
|
|
|
|
|
|
O |
2 |
+ |
N |
A |
|
|
|
|
|
|
|
|
|
|
|
|
|
|
|
|
|
|
|
|
|
|
|
P |
|
||
|
|
|
|
|
|
|
|
|
|
|
|
|
|
|
|
|
|
|
|
|
|
|
|
|
|
|
|
|
|
|
|
|
|
H2O + N |
|
A |
|
Two steps |
|
|
|
|
|
|
|||||
Geranyl |
|
|
|
|
|
|
|
|
|
|
|
|
|
|
|
|
|
|
|
|
||||
|
|
|
P |
P |
|
|
|
|
|
|
|
P |
|
|
|
|
|
|
|
|
|
|
|
|
diphosphate |
|
|
|
|
|
|
|
|
|
|
|
|
|
|
|
|
|
|
|
|
|
|||
|
|
|
|
|
|
|
|
|
|
|
|
|
|
|
|
|
|
|
|
|
|
|
||
|
|
|
O |
P |
P |
|
|
|
|
|
|
|
|
|
|
|
|
|
Lanosterol |
|||||
Farnesyl |
|
|
|
|
|
|
|
|
|
|
|
|
|
|
|
|
|
|
|
|
|
|
|
|
diphosphate |
|
|
|
|
P |
P |
|
|
HO |
|
|
|
|
|
|
|
x O |
2 |
+ x |
N |
A |
|||
|
|
|
|
|
|
|
|
|
|
|
|
|
|
|
|
|||||||||
|
|
|
|
|
|
|
|
|
|
|
|
|
|
|
|
|
|
|
|
|
|
|
P |
|
|
|
|
|
|
|
|
|
|
|
|
|
|
|
|
|
|
|
|
|
|
|
|
|
|
|
|
|
|
|
O |
P |
P |
|
|
|
|
|
|
|
|
|
2 CO2 |
|
|
|
|
|
|
|
|
|
|
|
|
|
|
|
|
x H2O + x |
|
N |
A |
|
|
|
|
|
|
|
|
||||
|
|
|
|
|
|
|
|
|
|
|
|
1 HCOOH |
|
|
|
|||||||||
|
|
|
|
|
|
|
|
|
|
|
|
|
|
P |
Multiple steps |
|
|
|
|
|
||||
|
|
|
|
|
|
|
|
|
|
|
|
|
|
|
|
|
|
|
|
|||||
|
|
|
|
NADPH+H |
|
|
|
|
|
|
|
|
|
|
|
|
|
|
|
|
|
|||
P |
P |
|
|
|
|
|
|
|
|
|
|
|
|
|
|
|
|
|
|
|
|
|
|
|
Squalene |
|
|
|
NADP |
|
|
|
|
|
|
|
|
|
|
|
|
|
|
|
|
|
|
|
|
|
|
|
|
|
|
|
|
|
|
|
|
|
|
|
|
|
|
|
|
|
|
|
|
|
|
|
|
|
|
|
|
|
|
|
HO |
|
|
|
|
|
|
|
|
Cholesterol |
|||||
|
|
|
|
|
|
|
|
|
|
|
|
|
|
|
|
|
|
|
|
|
|
|
|
|

174 Metabolism
Protein metabolism: overview
Quantitatively, proteins are the most important group of endogenous macromolecules. A person weighing 70 kg contains about 10 kg protein, with most of it located in muscle. By comparison, the proportion made up by other nitrogencontaining compounds is minor. The organism’s nitrogen balance is therefore primarily determined by protein metabolism. Several hormones—mainly testosterone and cortisol—regulate the nitrogen balance (see p. 374).
A. Protein metabolism: overview
In adults, the nitrogen balance is generally in equilibrium—i.e., the quantities of protein nitrogen taken in and excreted per day are approximately equal. If only some of the nitrogen taken in is excreted again, then the balance is positive. This is the case during growth, for example. Negative balances are rare and usually occur due to disease.
Proteins taken up in food are initially broken down in the gastrointestinal tract into amino acids, which are resorbed and distributed in the organism via the blood (see p. 266). The human body is not capable of synthesizing 8–10 of the 20 proteinogenic amino acids it requires (see p. 60). These amino acids are essential, and have to be supplied from food (see p. 184).
Proteins are constantly being lost via the intestine and, to a lesser extent, via the kidneys. To balance these inevitable losses, at least 30 g of protein have to be taken up with food every day. Although this minimum value is barely reached in some countries, in the industrial nations the protein content of food is usually much higher than necessary. As it is not possible to store amino acids, up to 100 g of excess amino acids per day are used for biosynthesis or degraded in the liver in this situation. The nitrogen from this excess is converted into urea (see p. 182) and excreted in the urine in this form. The carbon skeletons are used to synthesize carbohydrates or lipids (see p. 180), or are used to form ATP.
It is thought that adults break down 300–400 g of protein per day into amino acids (proteolysis). On the other hand, approximately the same amount of amino acids
is reincorporated into proteins (protein biosynthesis). The body’s high level of protein turnover is due to the fact that many proteins are relatively short-lived. On average, their half-lives amount to 2–8 days. The key enzymes of the intermediary metabolism have even shorter half-lives. They are sometimes broken down only a few hours after being synthesized, and are replaced by new molecules. This constant process of synthesis and degradation makes it possible for the cells to quickly adjust the quantities, and therefore the activity, of important enzymes in order to meet current requirements. By contrast, structural proteins such as the histones, hemoglobin, and the components of the cytoskeleton are particularly long-lived.
Almost all cells are capable of carrying out biosynthesis of proteins (top left). The formation of peptide chains by translation at the ribosome is described in greater detail on pp. 250–253. However, the functional forms of most proteins arise only after a series of additional steps. To begin with, supported by auxiliary proteins, the biologically active conformation of the peptide chain has to be formed (folding; see pp. 74, 232). During subsequent “post-translational” maturation, many proteins remove part of the peptide chain again and attach additional groups— e.g., oligosaccharides or lipids. These processes take place in the endoplasmic reticulum and in the Golgi apparatus (see p. 232). Finally, the proteins have to be transported to their site of action (sorting; see p. 228).
Some intracellular protein degradation (proteolysis) takes place in the lysosomes (see p. 234). In addition, there are protein complexes in the cytoplasm, known as proteasomes, in which incorrectly folded or old proteins are degraded. These molecules are recognized by a special marking (see p. 176). The proteasome also plays an important part in the presentation of antigens by immune cells (see p. 296).

|
|
|
|
|
Protein Metabolism |
175 |
A. Protein metabolism: overview |
|
|
|
|
||
|
|
Functional |
|
|
|
|
|
|
proteins |
|
|
|
|
|
|
10 000 g |
|
|
|
|
Maturation |
|
|
Marking |
|
||
|
Sugars |
Protein synthesis (300–400 g/day) |
|
|
|
|
Folding |
|
|
|
Degradation |
|
|
|
|
|
|
|
||
|
|
Proteasome |
|
|
||
|
|
Proteolysisg/day)(300400– |
|
Lysosome |
||
|
|
|
|
|
||
|
|
|
|
|
Peptide |
|
Translation |
|
|
Degradation |
|
||
|
|
Amino acid pool |
|
|
|
|
|
|
100 g |
|
Excess |
|
|
|
|
|
|
|
|
|
|
|
|
|
amino |
|
|
|
|
|
|
acids |
|
|
|
Protein |
|
|
|
|
Lipids |
Food |
secretion |
|
|
|
Glucose |
|
50–100 g/day |
50 g/day |
|
|
|
|
|
|
|
De-novo |
|
|
|
|
|
Resorption |
synthesis |
Degradation |
|
|
|
|
Up to 150 g/day |
As required |
50–100 g/day |
|
|
|
|
|
|
|
|
2-Oxo- |
Ketone |
Digestion |
|
|
|
|
acids |
bodies |
|
|
|
|
|
|
|
|
Pyruvate |
|
NH3 |
A |
|
|
Amino |
|
|
P P P |
|||
|
|
|
||||
Phosphoenolpyruvate |
|
|
ATP |
|||
acids |
|
|
||||
3-Phosphoglycerate |
|
|
|
|||
|
|
|
|
|||
|
2-Oxoacids |
|
Urea |
CO2, H2O |
|
|
Intestine |
Sugar phosphates |
|
||||
|
|
|
|
|
|
|
10g/day |
|
|
|
|
Kidney |
|

176 Metabolism
Proteolysis
A. Proteolytic enzymes
Combinations of several enzymes with different specificities are required for complete degradation of proteins into free amino acids. Proteinases and peptidases are found not only in the gastrointestinal tract (see
p.268), but also inside the cell (see below). The proteolytic enzymes are classified into
endopeptidases and exopeptidases, according to their site of attack in the substrate molecule. The endopeptidases or proteinases cleave peptide bonds inside peptide chains. They “recognize” and bind to short sections of the substrate’s sequence, and then hydrolyze bonds betweenparticular amino acid residues in a relatively specific way (see p. 94). The proteinases are classified according to their reaction mechanism. In serine proteinases, for example (see C), a serine residue in the enzyme is important for catalysis, while in cysteine proteinases, it is a cysteine residue, and so on.
The exopeptidases attack peptides from their termini. Peptidases that act at the N terminus are known as aminopeptidases, while those that recognize the C terminus are called carboxypeptidases. The dipeptidases only hydrolyze dipeptides.
B. Proteasome
The functional proteins in the cell have to be protected in order to prevent premature degradation. Some of the intracellularly active proteolytic enzymes are therefore enclosed in lysosomes (see p. 234). The proteinases that act there are also known as cathepsins. Another carefully regulated system for protein degradation is located in the cytoplasm. This consists of large protein complexes (mass 2 106 Da), the proteasomes. Proteasomes contain a barrel-shaped core consisting of 28 subunits that has a sedimentation coef cient (see p. 200) of 20 S.Proteolytic activity (shown here by the scissors) is localized in the interior of the 20-S core and is therefore protected. The openings in the barrel are sealed by 19-S particles with a complex structure that control access to the core.
Proteins destined for degradation in the proteasome (e.g., incorrectly folded or old
molecules) are marked by covalent linkage with chains of the small protein ubiquitin. The ubiquitin is previously activated by the introduction of reactive thioester groups. Molecules marked with ubiquitin (“ubiquitinated”) are recognized by the 19S particle, unfolded using ATP, and then shifted into theinterior ofthenucleus, wheredegradation takes place. Ubiquitin is not degraded, but is reused after renewed activation.
C. Serine proteases
A large group of proteinases contain serine in their active center. The serine proteases include, for example, the digestive enzymes trypsin, chymotrypsin, and elastase (see pp. 94 and 268), many coagulation factors
(see p. 290), and the fibrinolytic enzyme plasmin and its activators (see p. 292).
As described on p. 270, pancreatic proteinases are secreted as proenzymes (zymogens). Activation of these isalsobasedonproteolytic cleavages. This is illustrated here in detail using the example of trypsinogen, the precursor of trypsin (1). Activation of trypsinogen starts with cleavage of an N-terminal hexapeptide by enteropeptidase (enterokinase), a specific serine proteinase that is located in the membrane of the intestinal epithelium. The cleav- ageproduct(β-trypsin)isalreadycatalytically active, and it cleaves additional trypsinogen molecules at the sites marked in red in the illustration (autocatalytic cleavage). The precursors of chymotrypsin, elastase, and carboxypeptidase A, among others, are also activated by trypsin.
The active center of trypsin is shown in Fig. 2. A serine residue in the enzyme (Ser195), supported by a histidine residue and an aspartate residue (His-57, Asp-102), nucleophilically attacks the bond that is to be cleaved (red arrow). The cleavage site in the substrate peptide is located on the C-terminal side of a lysine residue, the side chain of which is fixed in a special “binding pocket” of the enzyme (left) during catalysis (see p. 94).

|
|
Protein Metabolism |
177 |
||
A. Proteolytic enzymes |
|
|
|
|
|
COO |
C-Terminus |
Serine proteinase |
|
|
|
H3N N-Terminus |
|
|
|
||
3.4.21.n |
|
|
|
||
Aminopeptidase |
Exopeptidase |
Cysteine proteinase |
H3N |
COO |
|
[Zn2 ] 3.4.11.n |
3.4.22.n |
|
|
|
|
Endopeptidase |
|
|
|
||
|
Aspartate proteinase |
|
|
|
|
|
|
3.4.23.n |
|
|
|
|
|
Metalloproteinase |
Dipeptidase |
|
|
H3N |
|
3.4.24.n |
|
||
|
[Zn2 |
] 3.4.13.n |
|||
|
|
|
|
Carboxy- |
|
|
|
|
|
peptidase |
|
Amino acid residue |
|
|
3.4.17.n |
|
|
|
|
|
|
||
|
|
|
COO |
|
|
B. Proteasome |
|
C. Serine proteases |
|
|
|
Folded |
Activated |
Disulfide |
Autocatalytic |
|
|
protein |
ubiquitin |
bond |
cleavage |
|
|
Autocatalytic cleavage
Marking |
Activation |
|
|
with |
of |
|
|
ubiquitin |
ubiquitin |
|
|
Ubiquitinated |
|
|
|
protein |
Cleavage |
|
|
|
|
|
|
|
by entero- |
|
|
|
peptidase |
|
Active |
19 S |
and trypsin |
|
center |
particle |
|
|
|
Binding |
1 Enteropeptidase |
2 Trypsin |
|
3.4.21.9 |
|
3.4.21.4 |
|
|
|
||
20 S |
1. Trypsinogen activation |
|
|
nucleus |
|
||
|
|
|
|
19 S |
|
|
|
particle |
|
|
Asp-102 |
|
|
|
|
|
Lysine residue |
Ser-195 |
|
|
|
|
|
A |
|
|
|
|
|
|
His-57 |
Unfolding |
Degradation |
|
|
|
Substrate |
|
|
A |
2. Trypsin: active center |
|
|
|
|
||

178 Metabolism
Transamination and deamination
Amino nitrogen accumulates during protein degradation. In contrast to carbon, amino nitrogen is not suitable for oxidative energy production. If they are not being reused for biosynthesis, the amino groups of amino acids are therefore incorporated into urea (see p. 182) and excreted in this form.
A. Transamination and deamination
Among the NH2 transfer reactions, transaminations (1) are particularly important. They are catalyzed by transaminases, and occur in both catabolic and anabolic amino acid metabolism. During transamination, the amino group of an amino acid (amino acid 1) is transferred to a 2-oxoacid (oxoacid 2). From the amino acid, this produces a 2-oxo- acid (a), while from the original oxoacid, an amino acid is formed (b). The NH2 group is temporarily taken over by enzyme-bound pyridoxal phosphate (PLP; see p. 106), which thus becomes pyridoxamine phosphate.
If the NH2 is released as ammonia, the process is referred to as deamination. There are different mechanisms for this (see p. 180). A particularly important one is oxidative deamination (2). In this reaction, the α-amino group is initially oxidized into an imino group (2a), and the reducing equivalents are transferred to NAD+ or NADP+. In the second step, the imino group is then cleaved by hydrolysis. As in transamination, this produces a 2-oxo- acid (C). Oxidative deamination mainly takes place in the liver, where glutamate is broken down in this way into 2-oxoglutarate and ammonia, catalyzed by glutamate dehydrogenase. The reverse reaction initiates biosynthesis of the amino acids in the glutamate family (see p. 184).
B. Mechanism of transamination
In the absence of substrates, the aldehyde group of pyridoxal phosphate is covalently bound to a lysine residue of the transaminase (1). This type of compound is known as an aldimine or “Schiff’s base.” During the reaction, amino acid 1 (A, 1a) displaces the lysine residue, and a new aldimine is formed (2). The double bond is then shifted by isomerization.
The ketimine (3) is hydrolyzed to yield the 2- oxoacid and pyridoxamine phosphate (4).
In the second part of the reaction (see A, 1b), these steps take place in the opposite direction: pyridoxamine phosphate and the second 2-oxoacid form a ketimine, which is isomerized into aldimine. Finally, the second amino acid is cleaved and the coenzyme is regenerated.
C. NH3 metabolism in the liver
In addition to urea synthesis itself (see p. 182), the precursors NH3 and aspartate are also mainly formed in the liver. Amino nitrogen arising in tissue is transported to the liver by the blood, mainly in the form of glutamine (Gln) and alanine (Ala; see p. 338). In the liver, Gln is hydrolytically deaminated by glutaminase [3] into glutamate (Glu) and NH3. The amino group of the alanine is transferred by alanine transaminase [1] to 2-oxoglutarate (2- OG; formerly known as α-ketoglutarate). This transamination (A) produces another glutamate. NH3 is finally released from glutamate by oxidative deamination (A). This reaction is catalyzed by glutamate dehydrogenase [4], a typical liver enzyme. Aspartate (Asp), the second amino group donor in the urea cycle, also arises from glutamate. The aspartate transaminase [2] responsible for this reaction is found with a high level of activity in the liver, as is alanine transaminase [1].
Transaminases are also found in other tissues, from which they leak from the cells into the blood when injury occurs. Measurement of serum enzyme activity (serum enzyme diagnosis; see also p. 98) is an important method of recognizing and monitoring the course of such injuries. Transaminase activity in the blood is for instance important for diagnosing liver disease (e.g., hepatitis) and myocardial disease (cardiac infarction).

|
|
|
|
|
|
|
|
|
|
|
|
Protein Metabolism |
179 |
||||
A. Transamination and deamination |
|
|
B. Mechanism of transamination |
|
|||||||||||||
|
|
|
|
|
|
|
|
|
|
Amino |
|
|
H |
Lysine residue |
|||
|
|
|
|
|
|
|
|
|
|
|
|
|
|||||
O |
|
O |
|
|
|
O |
|
O |
|
acid |
|
OOC |
C |
R |
|
Enzyme |
|
C |
a |
|
|
C |
|
|
|
|
|
|
|
|
|||||
|
|
|
|
|
|
|
|
|
|
|
NH3 |
|
|||||
H3N |
C |
H |
|
|
|
O |
C |
|
|
|
|
|
|
|
N |
H |
|
|
|
|
|
|
|
|
|
|
|
|
|||||||
|
R1 |
|
|
|
|
|
R1 |
|
|
|
H |
Aldimine 2 |
H |
C |
|
||
|
|
|
|
|
|
|
|
|
O |
|
|
||||||
Amino acid 1 |
|
|
|
Oxoacid 1 |
|
OOC |
C |
R |
|
|
|
O |
|||||
|
|
|
|
|
|
|
|
||||||||||
|
|
H3N |
|
PLP |
Pyridoxamine |
|
|
N |
H |
|
|
H C |
N |
P |
|||
|
|
|
phosphate |
|
|
H |
|
|
|||||||||
|
|
|
|
|
|
|
|
|
|
|
C |
|
|
3 |
|
1. |
|
|
|
|
|
|
|
|
|
|
|
O |
|
|
|
|
|
H |
|
O |
|
O |
|
|
|
O |
|
O |
|
|
|
|
O |
|
|
||
C |
|
|
|
C |
|
|
|
|
|
PLP (Aldimine 1) |
|
||||||
|
|
|
|
|
|
|
|
|
|
|
|
P |
|
||||
|
|
|
|
|
|
|
|
|
|
|
|
|
|
|
|||
|
|
|
|
|
|
|
|
|
|
H3C |
|
N |
|
|
|
|
|
O |
C |
|
b |
|
|
H3N |
C |
H |
|
|
|
|
|
|
|
||
|
|
|
|
2. |
|
H |
|
|
|
Aldimine 2 |
|||||||
|
R2 |
|
|
|
|
|
R2 |
|
|
|
|
|
|
||||
|
|
|
|
|
|
|
|
|
|
|
|
|
|
|
|
||
Oxoacid 2 |
|
|
|
|
Amino acid 2 |
|
Rearrangement |
|
|
|
|
|
|||||
1. Transamination |
|
|
|
|
|
|
|
|
|
|
|
|
|
|
|
||
|
|
|
Imino acid |
|
|
|
|
OOC |
C |
R |
|
|
|
|
|
||
O |
|
O |
O |
|
O |
|
|
Ketimine |
|
|
|
||||||
C |
a |
|
|
C |
|
|
|
|
|
||||||||
|
|
|
|
|
|
|
|
N |
|
|
|
|
|
|
|||
|
|
|
|
|
|
|
|
|
|
H |
CH2 |
|
|
|
|
|
|
H3N C H |
|
|
|
H2N C |
|
|
|
|
|
|
|
|
|||||
|
R2 |
|
|
|
|
|
R2 |
|
|
O |
|
|
|
O |
|
|
|
|
|
|
|
|
|
|
|
|
|
|
|
|
|
|
|||
|
|
N |
A |
N |
A |
b |
|
|
|
|
|
|
|
P |
|
|
|
Amino acid |
|
P |
P |
|
H |
O |
H3C |
|
N |
|
|
|
|
||||
|
|
|
|
|
|
|
|
2 |
|
|
|
|
|
NH2 |
|
||
|
|
|
|
|
|
|
|
|
|
|
|
H |
|
|
|
|
|
|
|
|
|
|
|
|
|
|
|
|
|
|
|
|
CH2 |
|
|
|
|
|
|
|
|
|
|
|
|
3. |
|
H2O |
|
H |
|
|
|
|
|
|
|
|
|
O |
|
O |
|
|
|
HO |
|
|
|||
|
|
NH4 |
|
|
|
C |
|
|
|
|
|
|
|
O |
|||
|
|
|
|
|
|
|
|
|
|
|
|
|
|
|
|||
|
|
|
|
|
|
|
|
|
|
|
|
|
|
|
|
||
|
|
Oxoacid |
|
|
|
O |
C |
|
|
|
|
|
|
|
H3C |
N |
P |
|
|
|
|
|
|
|
|
|
|
|
|
|
|||||
|
|
|
|
|
|
|
R2 |
|
|
|
|
OOC |
C |
R |
|
H |
4. |
2. Oxidative deamination |
|
|
|
|
|
|
|
O |
|
|
|||||||
|
|
|
|
|
Oxoacid |
|
Pyridoxamine-P |
||||||||||
|
|
|
|
|
|
|
|||||||||||
C. NH3 metabolism in the liver
From |
Ala |
|
Gln |
|
3 |
||
|
|
||
the |
|
|
|
blood |
|
|
Glu |
|
|
|
|
|
|
|
A |
|
|
1 |
N |
Asp |
|
|
|
|
|
|
|
|
Pyr |
Urea |
cycle, |
2 |
- |
||
bio |
|
|
syntheses |
|
|
|
OAA |
|
4
2 |
-OG |
|
A
N
|
From |
|
Alanine trans- |
|
|
1 |
aminase [PLP] |
||
|
the |
|||
|
|
2.6.1.2 |
||
|
blood |
|
Aspartate trans- |
|
|
2 |
|||
|
|
|
aminase [PLP] |
|
|
|
|
|
|
NH |
3 |
|
2.6.1.1 |
|
|
|
|||
|
|
|
||
|
|
|
|
Glutaminase |
|
|
|
3 |
|
|
|
|
|
3.5.1.2 |
|
|
|
|
|
|
|
|
|
Glutamate |
|
cycle |
4 |
dehydrogenase |
|
Urea |
|
|||
|
|
1.4.1.2 |
||
|
|
|
|
|
|
|
3 |
|
Transamination |
|
|
|
||
NH |
|
|||
|
|
|||
|
|
|
||
Oxidative deamination
Hydrolytic deamination

180 Metabolism
Amino acid degradation
A large number of metabolic pathways are available for amino acid degradation, and an overview of these is presented here. Further details are given on pp. 414 and 415.
A. Amino acid degradation : overview
During the degradation of most amino acids, the α-amino group is initially removed by transamination or deamination. Various mechanisms are available for this, and these are discussed in greater detail in B. The carbon skeletons that are left over after deamination undergo further degradation in various ways.
During degradation, the 20 proteinogenic amino acids produce only seven different degradation products (highlighted in pink and violet). Five of these metabolites (2-oxo- glutarate, succinyl CoA, fumarate, oxaloacetate, and pyruvate) are precursors for gluconeogenesis and can therefore be converted into glucose by the liver and kidneys (see p. 154). Amino acids whose degradation supplies one of these five metabolites are therefore referred to as glucogenic amino acids. The first four degradation products listed are already intermediates in the tricarboxylic acid cycle, while pyruvate can be converted into oxaloacetate by pyruvate carboxylase and thus made available for gluconeogenesis (green arrow).
With two exceptions (lysine and leucine; see below), all of the proteinogenic amino acids are also glucogenic. Quantitatively, they represent the most important precursors for gluconeogenesis. At the same time, they also have an anaplerotic effect—i.e., they replenish the tricarboxylic acid cycle in order to feed the anabolic reactions that originate in it (see p. 138).
Two additional degradation products (acetoacetate and acetyl CoA) cannot be channeled into gluconeogenesis in animal metabolism, as there is no means of converting them into precursors of gluconeogenesis. However, they can be used to synthesize ketone bodies, fatty acids, and isoprenoids. Amino acids that supply acetyl CoA or acetoacetate are therefore known as ketogenic amino acids. Only leucine and lysine are purely ketogenic. Several amino acids yield degradation products that are both glucogenic
and ketogenic. This group includes phenylalanine, tyrosine, tryptophan, and isoleucine.
Degradation of acetoacetate to acetyl CoA takes place in two steps (not shown). First, acetoacetate and succinyl CoA are converted into acetoacetyl CoA and succinate (enzyme:
3-oxoacid-CoA transferase 2.8.3.5). Acetoacetyl CoA is then broken down by β-oxidation into two molecules of acetyl CoA (see p. 164), while succinate can be further metabolized via the tricarboxylic acid cycle.
B. Deamination
There are various ways of releasing ammonia (NH3) from amino acids, and these are illustrated here using the example of the amino acids glutamine, glutamate, alanine, and serine.
[1]In the branched-chain amino acids (Val, Leu, Ile) and also tyrosine and ornithine, degradation starts with a transamination. For alanine and aspartate, this is actually the only degradation step. The mechanism of transamination is discussed in detail on p. 178.
[2]Oxidative deamination, with the formation of NADH+H+, only applies to glutamate in animal metabolism. The reaction mainly takes
place in the liver and releases NH3 for urea formation (see p. 178).
[3]Two amino acids—asparagine and glu- tamine—contain acid–amide groups in the
side chains, from which NH3 can be released by hydrolysis (hydrolytic deamination). In the blood, glutamine is the most important transport molecule for amino nitrogen. Hydrolytic deamination of glutamine in the liver also supplies the urea cycle with NH3.
[4]Eliminating deamination takes place in
the degradation of histidine and serine. H2O is first eliminated here, yielding an unsaturated intermediate. In the case of serine, this intermediate is first rearranged into an imine (not shown), which is hydrolyzed in the second
step into NH3 and pyruvate, with H2O being taken up. H2O does not therefore appear in the reaction equation.

|
|
|
|
Protein Metabolism |
181 |
|||
A. Amino acid degradation: overview |
|
|
|
|
|
|||
|
Several |
|
Alanine |
|
|
Threonine |
|
|
|
pathways |
|
|
|
|
|
|
|
Glucose |
|
|
|
|
|
|
|
|
|
Cysteine |
|
Pyruvate |
Serine |
|
Glycine |
|
|
Asparagine |
|
|
|
|
|
|
||
|
|
|
Acetyl |
Aceto- |
|
|
|
|
Aspartate |
|
CoA |
acetate |
|
|
|
||
|
|
|
|
|
|
|||
|
Oxalo- |
|
|
Ketone |
|
|
||
|
acetate |
|
|
body |
|
|
||
Phenyl- |
|
|
|
|
|
|
|
|
alanine |
|
|
|
|
|
|
|
|
|
Fuma- |
Tricarboxylic |
|
|
Pyruvate |
|||
Tyrosine |
|
|
|
|
||||
rate |
acid cycle |
Leucine |
Lysine |
|
||||
|
|
|||||||
Iso- |
|
|
2-Oxo- |
|
|
|
|
|
leucine |
Succinyl |
|
|
|
|
|||
glutarate |
Tryptophan |
Alanine |
||||||
|
||||||||
|
CoA |
|
|
|
|
|
|
|
Valine |
|
|
|
|
|
|
|
|
|
Acetyl |
|
Glutamate |
|
Histidine |
|||
|
CoA |
|
|
|||||
|
|
|
|
|
|
|
||
|
Propionyl |
Glutamine |
|
|
Proline |
|
||
|
CoA |
|
|
|
|
|
|
|
Pyruvate |
Cysteine |
|
Methionine |
|
|
|
|
|
|
|
Serine |
|
Arginine |
|
|
|
|
Glucogenic |
Glucogenic |
|
Transamination |
|
Hydrolytic deamination |
|
||
Ketogenic |
and ketogenic |
Oxidative deamination |
Eliminating deamination |
|
||||
B. Deamination |
|
|
|
|
|
|
|
|
|
|
|||
|
|
COO |
NADH+H |
|
NAD |
COO |
|
COO |
|
||||
|
|
O C |
|
N |
A |
NH4 |
N |
A |
H3N C H |
|
H3N C H |
|
|
|
|
(CH ) |
|
|
|
|
(CH2)2 |
|
(CH2)2 |
|
|||
|
|
|
|
|
|
|
|
|
|||||
|
|
|
2 2 |
|
|
|
|
|
|
|
|
|
|
|
|
COO |
|
|
2 |
|
|
COO |
|
CONH2 |
|
||
|
|
|
|
|
|
|
|
|
|
|
|
|
|
|
|
|
|
2-OG |
|
|
Glu |
|
3 |
Gln |
|
|
|
|
|
COO |
|
|
1 |
|
|
NH4 |
|
H2O |
COO |
||
|
|
|
|
|
|
|
|
|
|
||||
|
H3N |
C |
H |
Ala |
|
|
|
Pyr |
|
4 |
Ser |
H3N C H |
|
|
|
CH3 |
|
|
|
|
|
H2C |
OH |
||||
|
|
|
|
|
|
|
|
|
|
|
|||
|
|
|
|
|
|
|
|
COO |
|
|
|
|
|
|
|
|
|
|
|
|
O |
C |
|
|
|
|
|
|
|
|
|
|
|
|
|
CH3 |
|
|
|
|
|
1 Alanine transaminase [PLP] 2.6.1.2 |
|
3 |
Glutaminase 3.5.1.2 |
|
|||||||||
2 |
Glutamate dehydrogenase 1.4.1.2 |
|
|
4 |
Serine dehydratase [PLP] 4.2.1.13 |
||||||||
182 Metabolism
Urea cycle
Amino acids are mainly broken down in the liver. Ammonia is released either directly or indirectly in the process (see p. 178). The degradation of nucleobases also provides significant amounts of ammonia (see p. 186).
Ammonia (NH3) is a relatively strong base, and at physiological pH values it is mainly present in the form of the ammonium ion NH4+ (see p. 30). NH3 and NH4+ are toxic, and at higher concentrations cause brain damage in particular. Ammonia therefore has to be effectively inactivated and excreted. This can be carried out in various ways. Aquatic animals can excrete NH4+ directly. For example, fish excrete NH4+ via the gills (ammonotelic animals). Terrestrial vertebrates, including humans, hardly excrete any NH3, and instead, most ammonia is converted into urea before excretion (ureotelic animals). Birds and reptiles, by contrast, form uric acid, which is mainly excreted as a solid in order to save water (uricotelic animals).
The reasons for the neurotoxic effects of ammonia have not yet been explained. It may disturb the metabolism of glutamate and its precursor glutamine in the brain (see p. 356).
A. Urea cycle
Urea (H2N–CO–NH2) is the diamide of carbonic acid. In contrast to ammonia, it is neutral and therefore relatively non-toxic. The reason for the lack of basicity is the molecule’s mesomeric characteristics. The free electron pairs of the two nitrogen atoms are delocalized over the whole structure, and are therefore no longer able to bind protons. As a small, uncharged molecule, urea is able to cross biological membranes easily. In addition, it is easily transported in the blood and excreted in the urine.
Urea is produced only in the liver, in a cyclic sequence of reactions (the urea cycle) that starts in the mitochondria and continues in the cytoplasm. The two nitrogen atoms are derived from NH4+ (the second has previously been incorporated into aspartate; see below). The keto group comes from hydrogen carbonate (HCO3–), or CO2 that is in equilibrium with HCO3–.
[1]In the first step, carbamoyl phosphate is
formed in the mitochondria from hydrogen carbonate (HCO3–) and NH4+, with two ATP molecules being consumed. In this com-
pound, the carbamoyl residue (–O–CO–NH2) is at a high chemical potential. In hepatic mitochondria, enzyme [1] makes up about 20% of the matrix proteins.
[2]In the next step, the carbamoyl residue is transferred to the non-proteinogenic amino acid ornithine, converting it into citrulline, which is also non-proteinogenic. This is passed into the cytoplasm via a transporter.
[3]The second NH2 group of the later urea molecule is provided by aspartate, which condenses with citrulline into argininosuccinate. ATP is cleaved into AMP and diphos-
phate (PPi) for this endergonic reaction. To shift the equilibrium of the reaction to the side of the product, diphosphate is removed from the equilibrium by hydrolysis.
[4]Cleavage of fumarate from argininosuccinate leads to the proteinogenic amino acid arginine, which is synthesized in this way in animal metabolism.
[5]In the final step, isourea is released from the guanidinium group of the arginine by hydrolysis (not shown), and is immediately rearranged into urea. In addition, ornithine is regenerated and returns via the ornithine transporter into the mitochondria, where it becomes available for the cycle once again.
The fumarate produced in step [4] is converted via malate to oxaloacetate [6, 7], from which aspartate is formed again by transamination [9]. The glutamate required for reaction [9] is derived from the glutamate dehy-
drogenase reaction [8], which fixes the second NH4+ in an organic bond. Reactions [6] and [7] also occur in the tricarboxylic acid cycle. However, in urea formation they take place in the cytoplasm, where the appropriate isoenzymes are available.
The rate of urea formation is mainly controlled by reaction [1]. N-acetyl glutamate, as an allosteric effector, activates carbamoylphosphate synthase. In turn, the concentration of acetyl glutamate depends on arginine and ATP levels, as well as other factors.
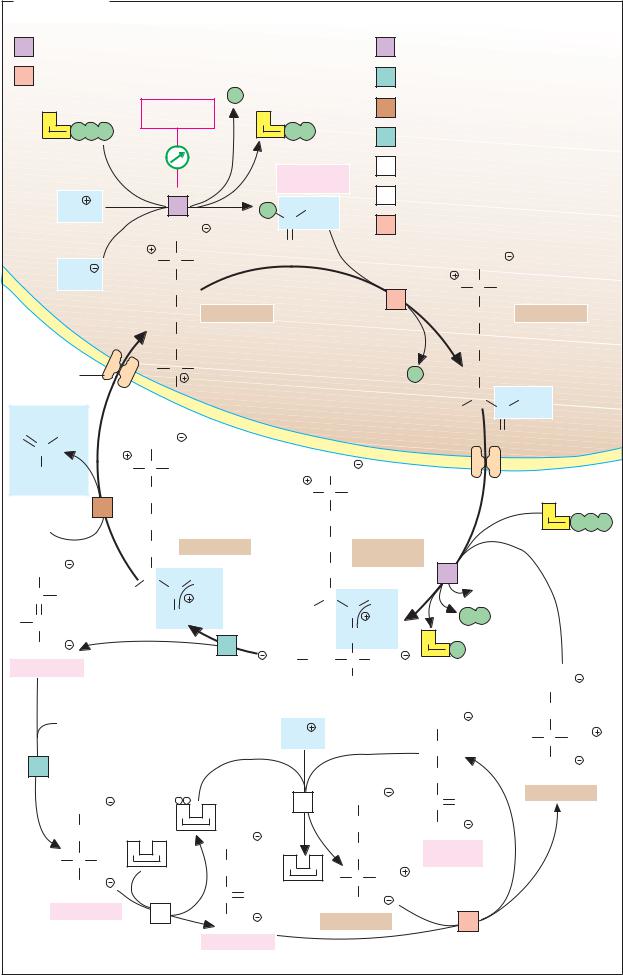
Protein Metabolism |
183 |
A. Urea cycle
1 Carbamoyl phosphate synthase (NH3) |
|
|
|
3 |
Argininosuccinate synthase 6.3.4.5 |
|
||||||||
|
6.3.4.16 |
|
|
|
|
|
|
|
|
|
|
|
|
|
2 |
Ornithine carbamoyltransferase 2.1.3.3 |
|
|
|
4 |
Argininosuccinate lyase 4.3.2.1 |
|
|||||||
|
|
|
|
N-Acetyl |
P |
|
|
|
5 |
Arginase 3.5.3.1 |
|
|
||
|
|
|
|
|
|
|
|
|
|
|||||
2 |
A |
P |
glutamate |
2 |
A |
P |
|
|
|
|
|
|
||
|
P P |
|
|
|
|
P |
|
6 |
Fumarate hydratase 4.2.1.2 |
|
||||
|
|
|
|
|
|
|
|
|
|
|
||||
|
|
|
|
|
|
|
Carbamoyl |
|
7 |
Malate dehydrogenase1.1.1.37 |
|
|||
|
|
|
|
|
|
|
|
|
|
|
|
|
||
|
|
|
|
|
|
|
phosphate |
|
8 |
Glutamate dehydrogenase1.4.1.2 |
|
|||
|
NH4 |
|
|
1 |
|
|
|
NH2 |
|
|
||||
|
|
|
|
|
P |
|
|
|
|
|
|
|||
|
|
|
|
COO |
|
C |
|
|
9 |
Aspartate transaminase [PLP] |
|
|||
|
|
|
|
|
O |
|
|
|
|
|
|
|
||
|
|
H3N C H |
|
|
|
|
|
COO |
|
|
||||
|
HCO3 |
|
|
|
|
|
|
|
|
|||||
|
|
|
CH2 |
|
|
|
|
|
H3N |
C H |
|
|
||
|
|
|
|
|
|
|
|
2 |
|
|
||||
|
|
|
|
CH2 |
Ornithine |
|
|
|
CH2 |
Citrulline |
|
|||
|
|
|
|
|
|
|
|
|
||||||
O |
NH2 |
|
|
CH2 |
|
|
|
|
|
|
CH2 |
|
Mitochondrion |
|
|
COO |
|
|
|
|
|
|
|
O |
|
||||
Transporter |
|
H |
N |
H |
|
|
|
|
|
P |
CH2 |
|
|
|
|
|
|
|
H |
|
|
|
|
|
|
|
N |
NH2 |
|
Urea |
|
|
|
|
|
|
|
|
|
|
H |
C |
|
|
C |
|
|
|
|
|
|
|
|
|
|
|
|
|
|
H2N |
H3N |
C |
H |
|
|
|
COO |
|
|
|
|
|
||
|
CH2 |
|
|
H3N C |
H |
|
|
|
|
|
||||
|
|
5 |
|
|
|
|
|
A |
|
|||||
H O |
CH2 |
|
|
|
CH2 |
|
|
|
|
|||||
|
|
|
|
|
|
|
P P P |
|||||||
2 |
|
|
|
|
|
|
|
|
|
|
|
|
|
|
|
|
|
CH2 |
Arginine |
|
CH2 |
Arginino- |
|
|
|
||||
COO |
|
|
|
|
|
|
CH2 |
succinate |
|
|
|
|||
|
N |
NH2 |
|
|
3 |
|
|
|
||||||
|
|
|
|
|
H2O |
|
|
|||||||
C |
H |
H |
|
C |
|
|
|
HN |
NH2 |
A |
|
Cytoplasm |
||
|
|
|
|
|
|
N |
C |
|
|
|
|
|||
H C |
|
|
H2N |
|
|
|
H |
|
P |
P |
|
|
||
|
|
|
|
|
|
|
|
|
|
|||||
|
|
|
|
|
|
|
|
|
|
|
|
|
||
COO |
|
|
|
|
4 |
OOC |
CH2 |
C |
COO |
P |
|
|
|
|
|
|
|
|
|
|
|
|
|||||||
Fumarate |
|
|
|
|
|
|
|
|
|
|||||
|
|
|
|
|
|
|
|
|
H |
|
|
|
COO |
|
|
H2O |
|
|
|
|
|
|
|
|
|
COO |
|
CH2 |
|
|
|
|
|
|
|
NH4 |
|
|
|
H C NH3 |
|
|||
|
|
|
|
|
|
|
|
|
CH2 |
|
|
|||
6 |
|
|
|
|
|
|
|
|
|
|
|
COO |
|
|
|
|
|
|
|
|
|
|
|
|
CH2 |
|
|
||
|
|
|
|
|
|
|
|
|
|
|
|
Aspartate |
|
|
|
COO |
|
|
|
|
|
8 |
COO |
C O |
|
|
|||
|
|
N |
A |
|
|
|
|
|
||||||
|
|
|
|
|
|
|
|
|
|
|
||||
|
|
|
|
|
|
|
CH2 |
|
|
|
|
|||
|
CH2 |
|
|
|
COO |
|
|
COO |
|
|
|
|||
|
|
|
|
|
|
CH2 |
2-Oxo- |
|
|
|
||||
|
H C |
N |
|
A |
|
|
|
|
|
|
|
|||
|
OH |
|
|
|
CH2 |
N |
A |
|
|
glutarate |
|
|
||
|
COO |
|
|
|
|
H |
C |
NH3 |
|
|
|
|
||
|
|
|
|
C O |
|
|
|
|
|
|||||
|
|
|
|
|
|
|
|
|
|
|
|
|||
|
Malate |
|
|
|
|
|
COO |
|
|
|
|
|||
|
|
7 |
|
|
|
|
9 |
|
|
|
||||
|
|
|
COO |
|
Glutamate |
|
|
|
||||||
|
|
|
|
|
|
|
|
|
|
|||||
Oxaloacetate

184 Metabolism
Amino acid biosynthesis
A. Symbiotic nitrogen fixation
Practically unlimited quantities of elementary nitrogen (N2) are present in the atmosphere. However, before it can enter the natural nitrogen cycle, it has to be reduced to NH3 and incorporated into amino acids (“fixed”). Only a few species of bacteria and bluegreen algae are capable of fixing atmospheric nitrogen. These exist freely in the soil, or in symbiosis with plants. The symbiosis between bacteria of the genus Rhizobium and legumes (Fabales)—such as clover, beans, and peas—is of particular economic importance. These plants are high in protein and are therefore nutritionally valuable.
In symbiosis with Fabales, bacteria live as bacteroids in root nodules inside the plant cells. The plant supplies the bacteroids with nutrients, but it also benefits from the fixed nitrogen that the symbionts make available.
The N2-fixing enzyme used by the bacteria is nitrogenase. It consists of two components: an Fe protein that contains an [Fe4S4] cluster as a redox system (see p. 106), accepts electrons from ferredoxin, and donates them to the second component, the Fe–Mo protein. This molybdenum-containing protein transfers the electrons to N2 and thus, via various intermediate steps, produces ammonia (NH3). Some of the reducing equivalents are transferred in a side-reaction to H+. In addition to NH3, hydrogen is therefore always produced as well.
B. Amino acid biosynthesis: overview
The proteinogenic amino acids (see p. 60) can be divided into five families in relation to their biosynthesis. The members of each family are derived from common precursors, which are all produced in the tricarboxylic acid cycle or in catabolic carbohydrate metabolism. An overview of the biosynthetic pathways is shown here; further details are given on pp. 412 and 413.
Plants and microorganisms are able to synthesize allof the amino acids fromscratch, but during the course of evolution, mammals have lost the ability to synthesize approximately half of the 20 proteinogenic amino acids. These essential amino acids therefore
have to be supplied in food. For example, animal metabolism is no longer capable of carrying out de-novo synthesis of the aromatic amino acids (tyrosine is only non-es- sential because it can be formed from phenylalanine when there is an adequate supply available). The branched-chain amino acids
(valine, leucine, isoleucine, and threonine) as well as methionine and lysine, also belong to the essential amino acids. Histidine and arginine are essential in rats; whether the same applies in humans is still a matter of debate. A supply of these amino acids in food appears to be essential at least during growth.
The nutritional value of proteins (see p. 360) is decisively dependent on their essential amino acid content. Vegetable pro- teins—e.g., those from cereals—are low in lysine and methionine, while animal proteins contain all the amino acids in balanced proportions. As mentioned earlier, however, there are also plants that provide high-value protein. These include the soy bean, one of the plants that is supplied with NH3 by symbiotic
N2 fixers (A).
Non-essential amino acids are those that arise by transamination from 2-oxoacids in the intermediary metabolism. These belong to the glutamate family (Glu, Gln, Pro, Arg, derived from 2-oxoglutarate), the aspartate family (only Asp and Asn in this group, derived from oxaloacetate), and alanine, which can be formed by transamination from pyruvate. The amino acids in the serine family (Ser, Gly, Cys) and histidine, which arise from intermediates of glycolysis, can also be synthesized by the human body.
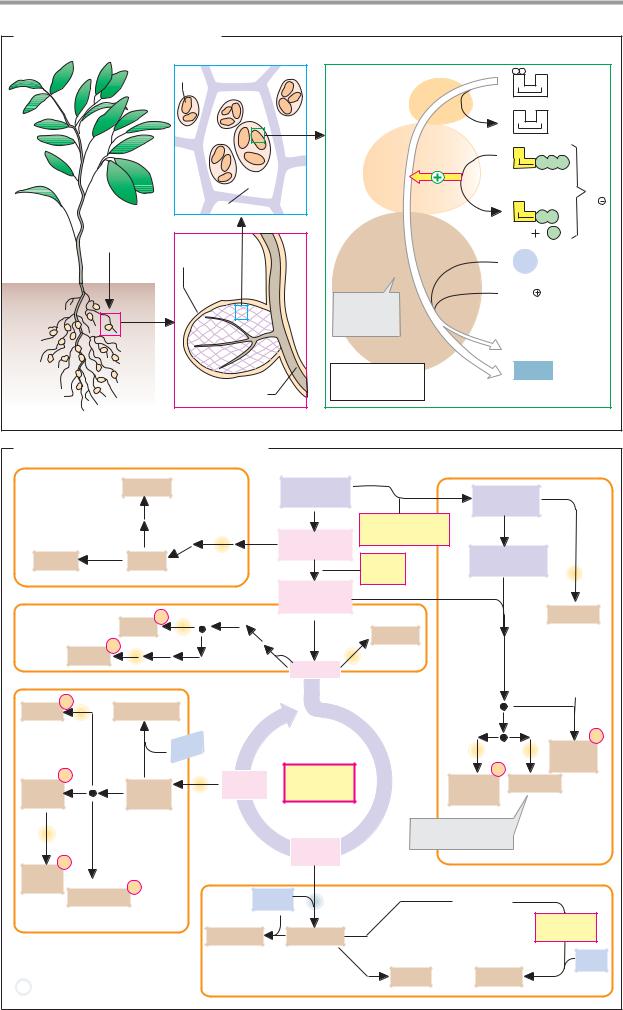
|
|
|
|
Protein Metabolism |
185 |
||
A. Symbiotic nitrogen fixation |
|
|
|
|
|
||
|
|
Bacteroids |
Ferredoxin |
4 N |
A |
|
|
|
|
|
|
|
|||
|
|
|
|
|
|
|
|
|
|
|
|
4 N |
A |
|
|
|
|
|
Fe-Protein |
2 A |
P |
P |
P |
|
|
|
[Fe4S4] |
|
|
|
|
|
|
Host cell |
|
|
|
|
per |
|
|
|
2 A |
|
|
e |
|
|
|
|
|
P |
P |
||
Air |
N2 |
|
|
|
|
P |
|
Root |
|
|
|
|
|
||
|
|
nodule |
FeMo-Protein |
N2 |
|
|
|
|
|
|
[Fe4S4], [FeMoCo] |
|
|
|
|
|
|
|
Iron-molyb- |
8 H |
|
|
|
|
|
|
|
|
|
|
|
|
|
|
denum |
|
|
|
|
|
|
|
cofactor |
|
|
|
|
|
|
|
|
H2 |
|
|
|
Soil |
|
|
Nitrogenase |
2 NH3 |
|
|
|
|
|
Vascular bundle |
1.18.6.1 |
Ammonia |
|||
B. Amino acid biosynthesis: overview
Serine family |
Cysteine |
|
Glucose 6- |
|
|
||
|
|
|
phosphate |
|
|
|
3-Phospho- |
Glycine |
Serine |
|
glycerate |
|
|
||
|
|
|
Phospho- |
Pyruvate family |
|
|
enolpyruvate |
Valine |
|
|
|
|
|
|
|
Leucine |
|
|
Pyruvate |
|
|
|
|
Lysine |
Asparagine |
|
|
|
NH3 |
|
|
Threo- |
Aspar- |
Oxalo- |
Tricarboxylic |
acetate |
acid cycle |
||
nine |
tate |
|
|
Ribose 5- phosphate
Pentose phosphate pathway
Erythrose Glyco- 4-phosphate lysis
Histidine |
Alanine |
Serine
Tryptophan
Phenyl- |
Tyrosine |
alanine |
|
Iso- |
leucine |
Methionine |
Aspartate family
 Essential amino acid
 Transamination
  Reductive amination
2-Oxo- glutarat
2 NH3
Glutamine |
Glutamate |
Glutamate family
Synthesized from
phenylalanine Aromatic family
 Ornithine
Urea cycle
|
NH3 |
Proline |
Arginine |

186 Metabolism
Nucleotide degradation
The nucleotides are among the most complex metabolites. Nucleotide biosynthesis is elaborate and requires a high energy input (see p. 188). Understandably, therefore, bases and nucleotides are not completely degraded, but instead mostly recycled. This is particularly true of the purine bases adenine and guanine. In the animal organism, some 90% of these bases are converted back into nucleoside monophosphates by linkage with phosphoribosyl diphosphate (PRPP) (enzymes [1] and [2]). The proportion of pyrimidine bases that are recycled is much smaller.
A. Degradation of nucleotides
The principles underlying the degradation of purines (1) and pyrimidines (2) differ. In the human organism, purines are degraded into uric acid and excreted in this form. The purine ring remains intact in this process. In contrast, the ring of the pyrimidine bases (uracil, thymine, and cytosine) is broken down into small fragments, which can be returned to the metabolism or excreted (for further details, see p. 419).
Purine (left). The purine nucleotide guanosine monophosphate (GMP, 1) is degraded in two steps—first to the guanosine and then to guanine (Gua). Guanine is converted by deamination into another purine base, xanthine.
In the most important degradative pathway for adenosine monophosphate (AMP), it is the nucleotide that deaminated, and inosine monophosphate (IMP) arises. In the same way as in GMP, the purine base hypoxanthine is released from IMP. A single enzyme, xanthine oxidase [3], then both converts hypoxanthine into xanthine and xanthine into uric acid. An oxo group is introduced into the substrate in each of these reaction steps. The oxo group is derived from molecular oxygen; another reaction product is hydrogen peroxide (H2O2), which is toxic and has to be removed by peroxidases.
Almost all mammals carry out further degradation of uric acid with the help of uricase, with further opening of the ring to allantoin, which is then excreted. However, the primates, including humans, are not capable of synthesizing allantoin. Uric acid is therefore the form of the purines excreted in these
species. The same applies to birds and many reptiles. Most other animals continue purine degradation to reach allantoic acid or urea and glyoxylate.
Pyrimidine (right). In the degradation of pyrimidine nucleotides (2), the free bases uracil (Ura) and thymine (Thy) are initially released as important intermediates. Both are further metabolized in similar ways. The pyrimidine ring is first reduced and then hydrolytically cleaved. In the next step, Ε-alanine arises by cleavage of CO2 and NH3 as the degradation product of uracil. When there is further degradation, Ε-alanine is broken down to yield acetate, CO2, and NH3. Propionate, CO2, and NH3 arise in a similar way from β-aminoisobutyrate, the degradation product of thymine (see p. 419).
B. Hyperuricemia
The fact that purine degradation in humans already stops at the uric acid stage can lead to problems, since—in contrast to allantoin—uric acid is poorly soluble in water. When large amounts of uric acid are formed or uric acid processing is disturbed, excessive concentrations of uric acid can develop in the blood (hyperuricemia). This can result in the accumulation of uric acid crystals in the body. Deposition of these crystals in the joints can cause very painful attacks of gout.
Most cases of hyperuricemia are due to disturbed uric acid excretion via the kidneys
(1). A high-purine diet (e.g., meat) may also have unfavorable effects (2). A rare hereditary disease, Lesch–Nyhan syndrome, results from a defect in hypoxanthine phosphoribosyltransferase (A, enzyme [1]). The impaired recycling of the purine bases caused by this leads to hyperuricemia and severe neurological disorders.
Hyperuricemia can be treated with allopurinol, a competitive inhibitor of xanthine oxidase. This substrate analogue differs from the substrate hypoxanthine only in the arrangement of the atoms in the 5-ring.

|
|
|
|
|
|
|
|
|
Nucleotide Metabolism |
187 |
|||||
A. Degradation of nucleotides |
|
|
|
|
|
|
|
|
|
|
|||||
|
|
1. Purine nucleotides |
|
|
2. |
Pyrimidine nucleotides |
|
||||||||
P |
P |
GMP |
PRPP |
|
AMP |
|
UMP |
CMP |
|
|
dTMP |
|
|||
|
|
|
|
|
|
|
|
|
|
|
|
||||
|
|
|
|
|
|
|
|
|
|
|
|
|
|
||
|
|
G |
|
|
|
A |
|
|
U |
|
C |
|
|
T |
|
|
|
P |
|
|
|
|
P |
|
P |
|
|
P |
|
P |
|
|
|
H2O |
2 |
|
|
H2O |
|
|
|
|
|
|
|
|
|
|
|
|
|
|
|
|
|
|
|
|
|
|
|
||
1 |
P |
|
|
|
|
NH3 |
Uracil |
|
|
|
|
Thymine |
|||
|
|
|
|
|
Free |
|
|
||||||||
|
|
|
Ade |
|
|
IMP |
|
Ura |
|
|
Thy |
|
|||
|
|
G |
|
I |
|
bases |
|
|
|
||||||
|
|
Adenine |
|
|
|
|
|
|
|
||||||
|
|
|
|
P |
N |
A |
|
|
|
|
N |
A |
|||
|
|
P |
|
|
|
|
|
|
P |
|
|
|
|
|
P |
|
|
|
|
|
|
|
|
|
|
|
|
|
|
|
|
|
|
|
|
|
|
|
|
N |
A |
|
O |
|
|
N |
A |
|
|
Rib |
P |
|
P |
|
|
|
P |
|
R |
|
|
P |
|
|
|
|
|
|
|
|
C |
|
|
||||||
|
|
|
|
|
|
|
|
|
|
|
|
|
|||
PRPP |
|
|
|
|
|
|
1 |
|
Dihydro- |
HN |
C |
H |
Dihydro- |
|
|
|
|
|
|
|
|
|
|
|
|||||||
|
|
Gua Guanine |
|
|
I |
|
|
uracil |
C |
|
CH2 |
thymine |
|
||
|
|
|
|
|
|
|
(R = H) |
|
(R = CH3) |
|
|||||
|
|
|
|
|
|
|
|
|
N |
|
|||||
|
|
|
|
|
|
|
|
|
|
O |
|
|
|
|
|
Phospho- |
H2O |
|
|
P |
|
|
|
H2O |
|
H |
|
|
H2O |
|
|
ribosyl |
|
|
|
|
|
|
|
|
|
|
|
|
|||
diphos- |
|
|
|
|
|
|
|
|
|
|
COO |
|
|
||
phate |
NH3 |
Rib |
P |
|
PRPP |
|
|
|
|
|
|
||||
|
|
|
H2N H |
C |
R |
N-Carbamoyl |
|||||||||
|
O |
|
O2 |
|
O |
|
N-Carbamoyl |
||||||||
|
|
|
|
|
|
CH2 |
β-amino- |
|
|||||||
|
C |
H2O2 H |
O |
|
C |
|
β-alanine |
C |
N |
isobutyrate |
|
||||
|
N |
2 |
|
|
N |
(R = H) |
O |
|
|
(R = CH3) |
|
||||
HN |
C |
3 |
|
HN |
C |
|
|
|
H |
|
|
|
|||
C |
C |
CH |
|
HC |
C |
CH |
|
H2O |
|
|
|
|
H2O |
|
|
N |
|
|
N |
|
|
|
|
|
|
||||||
O |
N |
H |
|
|
|
N |
H |
|
|
|
|
|
|
|
|
|
H |
|
|
|
|
|
NH3, |
|
COO |
|
NH3, |
||||
|
|
|
|
|
|
|
|
|
|
||||||
Xanthine (Xan) |
|
Hypoxanthine (Hyp) |
|
|
|
|
|
||||||||
|
|
CO2 |
H |
C |
R |
|
CO2 |
|
|||||||
|
|
|
|
|
|
|
|
|
|
|
|
|
|||
O2 |
|
|
|
|
|
|
|
|
β-Alanine |
|
CH2 |
|
β-Amino- |
|
|
H2O 3 |
|
|
|
|
|
|
|
|
|
|
isobutyrate |
|
|||
|
|
|
|
|
|
(R = H) |
|
NH3 |
|
(R = CH3) |
|
||||
H2O2 |
|
|
|
|
Excreted |
|
|
|
|
|
|
O |
|
|
|
by primates, |
B. Hyperuricemia (gout) |
|
|
||
|
|
H |
|
birds, and |
|
|
|
|
|
|
|
C |
|
|
reptiles |
|
2a |
|
|
Causes: |
|
|
|
N |
|
|
|
|
||||
HN |
C |
|
|
|
|
|
|
|||
|
C |
O |
|
|
|
1 |
Disturbed uric |
|||
|
|
|
|
|
|
|
||||
C |
|
C |
N |
|
|
|
|
|
|
acid excretion |
N |
|
|
|
|
AMP |
|
|
|||
O |
|
H |
|
Uric acid |
GMP |
|
2 |
Elevated uric acid |
||
|
H |
|
|
|
|
|||||
|
|
|
|
|
|
|
|
|
|
formation |
|
|
|
|
|
Excreted |
2b |
2b |
|
|
a) Unbalanced |
|
O |
|
H |
|
by most |
|
|
|
|
nutrition |
|
|
|
mammals |
|
|
|
|
b) Impaired |
||
H2N |
|
C |
N |
|
|
Gua |
Ade |
IMP |
|
|
|
|
C |
O |
|
recycling of |
|||||
C |
|
C |
|
|
|
|
|
|||
N |
N |
|
|
|
|
|
2b |
purine bases |
||
O |
H |
Allantoin |
|
|
|
|
||||
|
H |
|
H |
Xanthine |
|
Hypo- |
|
Recycling |
||
|
|
|
|
|
|
|
|
|||
|
|
|
|
|
|
|
xanthine |
|
reactions |
|
|
|
|
|
|
|
|
|
|
||
|
Allantoic acid |
2 Urea + |
|
|
|
|
|
|
glyoxylate |
|
|
|
O |
|
|
|
|
|
Allopurinol |
|
|
||
|
|
|
|
|
C |
H |
|
|
|
|
|
|
|
||
|
Hypoxanthine phosphoribosyl- |
|
|
HN |
C |
||
1 |
Uric |
|
C |
||||
transferase 2.4.2.8 |
|
1 |
HC |
C |
N |
||
|
Adenine phosphoribosyl- |
|
acid |
N |
|||
|
|
|
|||||
2 |
transferase 2.4.2.7 |
|
|
|
|
N |
H |
|
|
|
|
|
|||
3 |
Xanthine oxidase [Fe, Mo, FAD] 1.1.3.22 |
|
|
Allopurinol |
|||

188 Metabolism
Purine and pyrimidine biosynthesis
The bases occurring in nucleic acids are derivatives of the aromatic heterocyclic compounds purine and pyrimidine (see p. 80). The biosynthesis of these molecules is complex, but is vital for almost all cells. The synthesis of the nucleobases is illustrated here schematically. Complete reaction schemes are given on pp. 417 and 418.
A. Components of nucleobases
The pyrimidine ring is made up of three components: the nitrogen atom N-1 and carbons C-4 to C-6 are derived from aspartate, carbon C-2 comes from HCO3-, and the second nitrogen (N-3) is taken from the amide group of glutamine.
The synthesis of the purine ring is more complex. The only major component is glycine, which donates C-4 and C-5, as well as N- 7. All of the other atoms in the ring are incorporated individually. C-6 comes from HCO3–. Amide groups from glutamine provide the atoms N-3 and N-9. The amino group donor for the inclusion of N-1 is aspartate, which is converted into fumarate in the process, in the same way as in the urea cycle (see p. 182). Finally, the carbon atoms C-2 and C-8 are derived from formyl groups in N10- formyl-tetrahydrofolate (see p. 108).
B. Pyrimidine and purine synthesis
The major intermediates in the biosynthesis of nucleic acid components are the mononucleotides uridine monophosphate
(UMP) in the pyrimidine series and inosine monophosphate (IMP, base: hypoxanthine) in the purines. The synthetic pathways for pyrimidines and purines are fundamentally different. For the pyrimidines, the pyrimidine ring is first constructed and then linked to ribose 5 -phosphate to form a nucleotide. By contrast, synthesis of the purines starts directly from ribose 5 -phosphate. The ring is then built up step by step on this carrier molecule.
The precursors for the synthesis of the pyrimidine ring are carbamoyl phosphate, which arises from glutamate and HCO3– (1a) and the amino acid aspartate. These two components are linked to N-carbamoyl aspartate
(1b) and then converted into dihydroorotate by closure of the ring (1c). In mammals, steps 1a to 1c take place in the cytoplasm, and are catalyzed by a single multifunctional enzyme. In the next step (1d), dihydroorotate is oxidized to orotate by an FMN-dependent dehydrogenase. Orotate is then linked with phosphoribosyl diphosphate (PRPP) to form the nucleotide orotidine 5 -monophosphate (OMP). Finally, decarboxylation yields uridine 5 -monophosphate (UMP).
Purine biosynthesis starts with PRPP (the names of the individual intermediates are given on p. 417). Formation of the ring starts with transfer of an amino group, from which the later N-9 is derived (2a). Glycine and a formyl group from N10-formyl-THF then supply the remaining atoms of the five-mem- bered ring (2b, 2c). Before the five-membered ring is closed (in step 2f), atoms N-3 and C-6 of the later six-membered ring are attached (2d, 2e). Synthesis of the ring then continues with N-1 and C-2 (2g, 2i). In the final step (2j), the six-membered ring is closed, and inosine 5 -monophosphate arises. However, the IMP formed does not accumulate, but is rapidly converted into AMP and GMP. These reactions and the synthesis of the other nucleotides are discussed on p. 190.
Further information
The regulation of bacterial aspartate carbamoyltransferase by ATP and CTP has been particularly well studied, and is discussed on p. 116. In animals, in contrast to prokaryotes, it is not ACTase but carbamoylphosphate synthase that is the key enzyme in pyrimidine synthesis. It is activated by ATP and PRPP and inhibited by UTP.
The biosynthesis of the purines is also regulated by feedback inhibition. ADP and GDP inhibit the formation of PRRPP from ri- bose-5 -phosphate. Similarly, step 2a is inhibited by AMP and GMP.

Nucleotide Metabolism |
189 |
A. Components of nucleobases
Glu |
4 |
Fumarate |
|
C |
|
3 N |
C 5 2g |
|
[NH2] |
2h |
[NH2] |
|
Gln |
1a |
2 |
C |
N |
C 6 |
Asp |
|
|
|
||||
|
|
|
|
|
|
1 |
1 N |
|
|
THF |
|
|
|
1 |
2 C |
HCO3 |
|
[CHO] |
|
OOC |
2i |
|
|
|
|
||
|
|
CHO |
|
|
|
CH2 |
|
|
|
N10 |
|
C |
THF |
H3N H |
COO |
Aspartate |
Gln |
Pyrimidine |
Purine |
HCO3 |
NH3 |
Glycine |
2f |
H2C |
|
COO |
|
|
|
|
6 |
7 |
2b |
|
||
C 5 |
|
|
N |
THF |
|
C |
|
|
|
|
|
|
|
C |
[CHO] |
2c |
|
C |
|
8 |
||
N |
N |
|
OHC |
|
|
4 |
|
|
|||
9 |
|
N10 |
|
||
3 |
|
|
THF |
||
|
|
|
|||
[NH2] |
|
|
|
[NH2] |
|
2d |
Glu |
|
Gln |
Glu |
|
|
|
|
2a |
|
|
B. Pyrimidine and purine synthesis |
|
|
|
|
|
|
|
|
|
|
|
||||||||
[NH2] |
|
|
Carbamoyl |
Phosphoribosyl |
P |
|
R |
P P |
|
|
C |
|
|
||||||
|
|
|
N |
phosphate |
diphosphate |
|
|
|
|
|
|
|
|
|
|
||||
|
|
|
|
|
|
|
|
|
|
|
|
|
|
|
|
|
|
|
|
N |
|
|
C |
|
|
|
|
|
|
|
|
|
|
|
C |
|
|
|
C |
|
|
|
|
|
|
|
|
|
|
|
|
|
|
N |
C |
|
|
||
|
1a |
|
|
|
|
|
|
|
|
|
|
|
|
|
N |
C |
|||
|
|
|
O P |
|
|
|
|
|
|
|
|
|
|
|
|||||
|
|
|
|
|
C |
|
|
|
C |
|
|
|
|
|
|
||||
|
|
|
|
|
|
|
|
|
|
|
|
|
|
|
|
||||
|
|
|
|
|
|
|
|
|
|
|
|
C |
C |
|
|
|
|||
C |
|
|
|
|
|
N |
|
C |
|
N |
C |
|
|
|
|
C |
C |
||
|
|
|
|
|
|
|
|
|
|
|
|
|
|
N |
C |
|
|
N |
|
|
|
|
C |
1b |
C |
|
C |
1c |
C |
C |
|
1d |
1e |
|
|
1f |
|
||
HCO3 |
|
|
|
R |
|
|
R |
||||||||||||
|
|
C |
|
|
N |
C |
|
|
N |
C |
|
P |
|
|
P |
||||
|
|
|
|
C |
|
N-Carbamoyl |
|
Dihydro- |
|
Orotate 5'-mono- |
Uridine 5'-mono- |
||||||||
|
|
|
N |
C |
|
aspartate |
|
orotate |
|
|
phosphate |
|
phosphate (UMP) |
||||||
|
|
|
|
|
|
|
|
|
|
||||||||||
|
|
|
Aspartate |
|
|
|
|
|
|
5' |
|
|
|
|
|
|
O |
||
1. Pyrimidines |
|
|
|
|
|
|
|
|
|
UMP |
|
|
|||||||
|
|
|
|
|
P |
O CH2 |
|
|
|
|
|
|
|||||||
|
|
|
|
|
|
|
|
|
|
|
C |
||||||||
|
|
|
|
|
|
|
|
|
|
|
|
O |
|
|
|
|
HN |
||
Phosphoribosyl |
|
|
|
|
= |
|
|
H H |
1' |
|
|
|
CH |
||||||
|
|
P |
R |
|
|
|
|
|
C |
CH |
|||||||||
diphosphate |
|
|
|
|
|
|
|
H |
|
H |
|
|
|
||||||
|
|
|
|
|
N |
|
|
|
|
|
|
|
|
|
|
|
|
O |
N |
P |
R |
|
P P |
C |
|
|
|
|
|
|
OH OH |
|
P |
O |
CH2 |
|
|||
|
|
|
|
|
|
|
|
|
|
|
|
|
|||||||
|
|
2a |
|
|
|
|
|
|
|
|
|
|
|
|
|
||||
|
|
C |
Glycine |
|
5'-Phosphoribosyl residue |
|
|
|
O |
|
|||||||||
|
|
|
|
|
|
|
|
|
H H |
||||||||||
|
|
|
|
|
|
|
|
|
|
|
|
|
|
|
|
||||
|
|
|
|
|
|
|
|
|
|
|
|
|
|
|
|
|
|
||
|
N |
|
|
|
|
|
N |
|
|
|
N |
|
|
|
N |
|
H |
H |
|
|
|
|
|
|
C |
|
|
C |
|
|
C |
|
|
|
|
||||
|
|
|
|
|
|
|
|
|
C |
|
|
|
|
|
OH OH |
||||
P |
R |
|
|
2b |
|
|
|
2c |
|
C |
2d |
|
C |
|
|
||||
|
|
|
C |
|
|
N |
C |
|
|
|
|
|
|||||||
|
|
|
|
|
N |
|
N |
|
|
|
|
||||||||
|
|
|
|
|
|
|
|
|
|
|
|
N |
|
|
|
|
|||
|
|
|
|
|
|
|
|
|
|
|
|
|
|
|
|
|
|
|
|
|
|
|
|
|
|
P |
R |
|
|
P |
R |
|
|
P |
R |
IMP |
|
O |
|
|
|
|
|
|
|
|
|
|
|
|
|
|
|
|
|
|
HN |
C |
N |
|
|
|
|
|
|
|
|
|
|
|
|
|
|
|
|
|
C |
||
|
C |
C |
N |
N |
C |
C |
N |
|
C |
C |
N |
|
N |
C |
N |
|
HC |
C |
CH |
|
|
|
|
|
|
N |
|
|
C |
|
|
N |
|||||||
|
|
|
|
C |
|
|
C |
|
|
|
C |
|
|
|
C |
|
|||
2e, |
|
C |
|
2g, |
|
C |
|
2i |
C |
C |
|
2j |
C |
C |
|
|
|
N |
|
N |
N |
N |
N |
N |
N |
P |
O |
CH2 |
|
||||||||||
|
|
N |
|
|
N |
|
|||||||||||||
|
|
|
|
|
|
|
|
|
|
|
|
|
|
|
|
||||
2f |
P |
|
R |
2h |
|
P |
R |
|
|
P |
R |
|
|
P |
R |
|
|
O |
|
|
|
|
|
|
|
|
|
|
|
H |
H |
||||||||
|
|
|
|
|
|
|
|
|
|
|
|
Inosine 5'-mono- |
|
|
|||||
|
|
|
|
|
|
|
|
|
|
|
|
|
|
H |
H |
||||
2. Purines |
|
|
|
|
|
|
|
|
phosphate (IMP) |
|
|
OH OH |
|||||||
|
|
|
|
|
|
|
|
|
|
|
|
|
|
||||||

190 Metabolism
Nucleotide biosynthesis
De novo synthesis of purines and pyrimidines yields the monophosphates IMP and UMP, respectively (see p. 188). All other nucleotides and deoxynucleotides are synthesized from these two precursors. An overview of the pathways involved is presented here; further details are given on p. 417. Nucleotide synthesis by recycling of bases (the salvage pathway) is discussed on p. 186.
A. Nucleotide synthesis: overview
The synthesis of purine nucleotides (1) starts from IMP. The base it contains, hypoxanthine, is converted in two steps each into adenine or guanine. The nucleoside monophosphates AMP and GMP that are formed are then phosphorylated by nucleoside phosphate kinases to yield the diphosphates ADP and GDP, and these are finally phosphorylated into the triphosphates ATP and GTP. The nucleoside triphosphates serve as components for RNA, or function as coenzymes (see p. 106). Conversion of the ribonucleotides into deoxyribonucleotides occurs at the level of the diphosphates and is catalyzed by nucleoside diphosphate reductase (B).
The biosynthetic pathways for the pyrimidine nucleotides (2) are more complicated. The first product, UMP, is phosphorylated first to the diphosphate and then to the triphosphate, UTP. CTP synthase then converts UTP into CTP. Since pyrimidine nucleotides are also reduced to deoxyribonucleotides at the diphosphate level, CTP first has to be hydrolyzed by a phosphatase to yield CDP before dCDP and dCTP can be produced.
The DNA component deoxythymidine triphosphate (dTTP) is synthesized from UDP in several steps. The base thymine, which only occurs in DNA (see p. 80), is formed by methylation of dUMP at the nucleoside monophosphate level. Thymidylate synthase and its helper enzyme dihydrofolate reductase are important target enzymes for cytostatic drugs (see p. 402).
B. Ribonucleotide reduction
2 -Deoxyribose, a component of DNA, is not synthesized as a free sugar, but arises at the diphosphate level by reduction of ribonucleo-
side diphosphates. This reduction is a complex process in which several proteins are involved. The reducing equivalents needed come from NADPH+H+. However, they are not transferred directly from the coenzyme to the substrate, but first pass through a redox series that has several steps (1).
In the first step, thioredoxin reductase reduces a small redox protein, thioredoxin, via enzyme-bound FAD. This involves cleavage of a disulfide bond in thioredoxin. The resulting SH groups in turn reduce a catalytically active disulfide bond in nucleoside diphosphate reductase (“ribonucleotide reductase”). The free SH groups formed in this way are the actual electron donors for the reduction of ribonucleotide diphosphates.
In eukaryotes, ribonucleotide reductase is a tetramer consisting of two R1 and two R2 subunits. In addition to the disulfide bond mentioned, a tyrosine radical in the enzyme also participates in the reaction (2). It initially produces a substrate radical (3). This cleaves a water molecule and thereby becomes radical cation. Finally, the deoxyribose residue is produced by reduction, and the tyrosine radical is regenerated.
The regulation of ribonucleotide reductase is complex. The substrate-specificity and activity of the enzyme are controlled by two allosteric binding sites (a and b) in the R1 subunits. ATP and dATP increase or reduce the activity of the reductase by binding at site a. Other nucleotides interact with site b, and thereby alter the enzyme’s specificity.
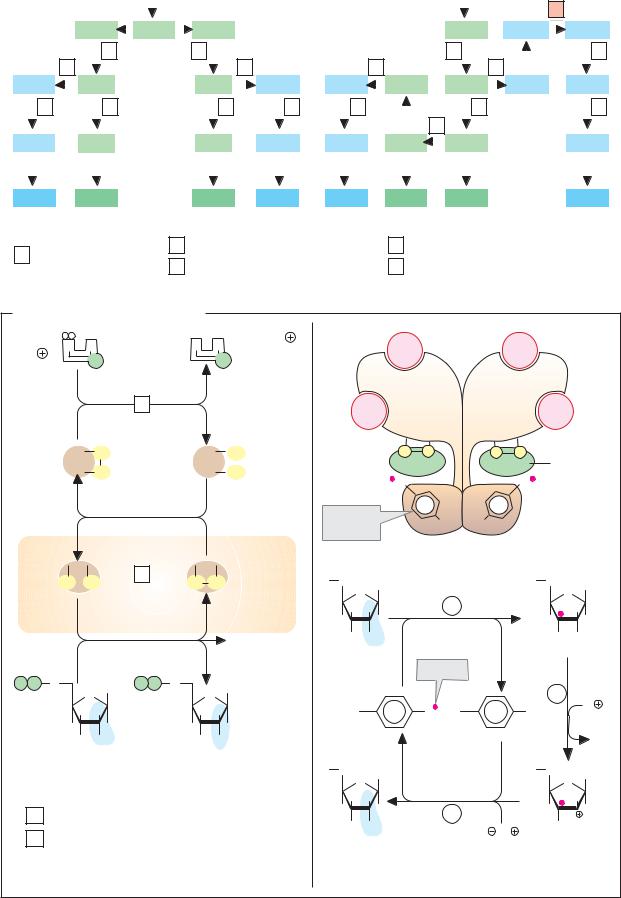

|
|
|
|
|
|
|
|
|
Porphyrin Metabolism |
195 |
|||||||
A. Degradation of heme groups |
|
|
|
|
|
|
|
|
|
|
|
|
|||||
|
|
|
|
|
|
Heme |
|
|
|
|
Cleavage by |
1 |
|
||||
3 |
N |
A |
3 |
N |
A |
|
|
|
R2 |
|
|
|
CH3 |
|
|
|
|
|
P |
|
CO |
|
|
|
|
|
|
|
|
|
|
|
|
||
|
|
|
|
P |
H3C |
|
|
|
|
|
|
R3 |
|
|
|
||
|
|
|
|
|
|
|
A |
|
|
B |
|
|
|
||||
|
|
|
|
|
|
|
|
|
N |
|
N |
|
|
|
|
|
|
2 |
|
|
1 |
|
|
|
|
|
|
Fe |
2 |
|
|
|
|
|
|
|
|
|
|
|
|
|
|
|
|
|
|
|
|
|
|
|
|
|
3 O2 |
|
3 H2O Fe2 |
|
|
|
N |
|
N |
|
|
|
|
|
|
||
|
|
|
R1 |
|
D |
|
|
C |
|
CH3 |
|
|
|
||||
|
|
|
|
|
|
|
|
|
|
|
|
|
|
|
|
||
Heme |
|
|
|
|
Reused |
|
|
|
|
|
|
|
|
|
|
|
|
|
|
|
|
|
for heme |
|
|
|
|
|
|
|
|
|
|
|
|
|
|
|
|
|
synthesis |
|
COO |
|
|
|
|
COO |
|
|
|
||
|
|
|
|
|
|
|
|
|
|
|
|
|
|
||||
|
|
Biliverdin |
|
|
CH2 |
OOC |
CH2 H2C |
COO |
|
|
CH2 |
||||||
|
|
|
|
|
|
|
|
|
|||||||||
|
|
|
|
|
|
CH3 |
CH |
|
CH3 |
CH2 |
CH2 |
CH3 |
CH3 |
CH |
|||
N |
|
A |
N |
A |
B |
|
|
C |
|
|
|
D |
|
|
A |
|
|
|
|
P |
|
|
P |
|
|
|
|
|
|
|
|
||||
|
|
|
|
N |
|
C |
N |
|
C |
|
N |
C |
|
N |
O |
||
|
|
|
|
|
O |
|
|
|
|
||||||||
|
|
|
|
|
|
H |
|
H |
H |
|
H2 |
|
H |
H |
|
H |
|
|
|
|
2 |
|
|
|
|
|
|
Bilirubin |
|
|
|
|
|
|
|
|
|
|
|
|
|
|
|
|
|
|
|
|
|
|
|
|
|
|
|
Bilirubin |
RES |
|
|
|
|
|
|
|
|
|
|
|
|
||
|
|
|
|
|
Bilirubin |
|
|
3 |
|
Bilirubin |
|
|
Urine |
||||
|
|
|
|
|
|
|
|
|
|
|
diglucuronide |
|
|
||||
|
|
|
|
|
|
|
|
|
|
|
|
|
|
||||
|
|
|
|
|
2 |
U |
P P |
GlcUA |
2 UDP |
|
|
|
|
Slowest |
|||
|
|
Albumin |
|
Blood |
|
|
|
|
|
|
|
|
|
|
step in |
||
|
|
|
|
|
|
|
|
|
|
|
|
|
|
hepatic |
|||
|
|
|
|
|
|
|
|
|
|
|
|
|
|
|
|
metabo- |
|
|
|
|
|
|
|
|
|
|
|
|
Gallbladder |
|
lism |
|
|||
|
|
|
|
|
|
|
|
|
|
|
|
|
|
||||
|
|
|
|
|
|
|
|
|
|
|
|
|
|
|
|
Entero- |
|
|
|
Albumin |
|
|
|
|
|
|
|
|
|
|
|
|
hepatic |
||
|
|
Bilirubin |
|
|
|
|
|
Bile |
|
|
|
|
|
|
circulation |
||
|
|
|
|
|
|
|
pigments |
|
|
|
|
|
|
|
|||
|
|
Binding |
|
Intestine |
|
|
|
|
|
|
|
|
|
|
|
||
|
|
|
|
|
|
|
|
|
|
|
|
|
|
|
|
||
|
|
site for |
|
|
|
|
|
|
|
|
|
|
|
|
|
|
|
|
|
bilirubin |
|
|
Bilirubin |
|
|
Bacterial |
|
|
|
|
|||||
|
|
and drugs |
|
|
|
|
|
|
|
||||||||
|
|
|
diglucuronide |
|
metabolism |
|
|
|
|||||||||
|
|
|
|
|
|
|
|
|
|
||||||||
|
|
|
|
|
2 GlcUA |
|
|
|
|
|
|
|
|
|
|
|
|
1 |
Heme oxygenase |
|
Bilirubin |
Stercobilinogen |
|
|
|
||||||||||
(decyclizing) 1.14.99.3 |
|
|
|
|
|||||||||||||
|
|
Urobilinogen |
|
|
|
||||||||||||
|
|
|
|
|
|
|
|
||||||||||
2 |
Biliverdin reductase |
|
|
|
|
|
|
|
|
|
|
|
|
||||
1.3.1.24 |
|
|
|
|
|
|
|
|
|
|
|
|
|
|
|
||
|
|
|
|
|
|
Stercobilin |
|
|
|
|
|
|
|
||||
|
|
|
|
|
|
|
|
|
|
|
|
|
|
|
|||
3 |
Glucuronosyl |
|
|
|
Urobilin |
|
|
|
|
|
|
|
|
||||
transferase 2.4.1.17 |
|
|
|
|
|
|
|
|
|
|
|
|
|||||
|
|
|
|
|
|
|
|
|
|
|
|
|
|||||