

Учебники / Diagnosis in Otorhinolaryngology Onerci 2009
.pdf6 |
Chapter 1 Ear |
Fig. 1.1.10 Inner ear organ of Corti. Color SEM of a section through the human inner ear, showing the organ of Corti (spiral organ). At the top right can be seen four rows of hair cells, supported by pillar-like Dieter cells. Each hair cell contains up to 100 individual hairs. The hairs translate mechanical movement caused by their displacement by sound waves into electrical impulses, which are transmitted to the brain via the cochlear nerve (visual photos)
Fig. 1.1.11 Sensory hair cells in the ear. Color SEM of hair cells in the cochlea, the inner ear’s auditory sense organ. The crescent-shaped areas across the center are numerous stereocilia, and are located on top of supporting hair cells. Sound waves entering the inner ear displace the fluid that surrounds the stereocilia, causing them to bend. This triggers a response in the hair cells, which release neurotransmitter chemicals that generate nerve impulses. The nerve impulses travel to the brain along the auditory nerve. This process can transmit information about the loudness and pitch of a sound. Magnification: ×2,000 when printed 10 cm wide (visual photos)

1.1 Ear Anatomy
Fig. 1.1.12 Balancing stone from inner ear. Color SEM of crystals of calcium carbonate on the surface of an otolith. An otolith or otoconium is a calcified stone that is found in the otolith organs of the inner ear. They are attached to sensory hairs, and, when the head tilts, the movement of the stones causes nerve impulses that form the basis of the sense of balance. In humans, otoconia can range in size from 3 to 30 µm (millionths of a meter) across (visual photos)
Table 1.1.1 Differences between anatomy of the eustachian tube (ET) in infants and adults
Anatomic features of the ET |
Infants |
Adults |
Length of tube |
Shorter |
Longer |
Lumen |
Smaller |
Wider |
Angle of tube to horizontal plane |
10° |
45° |
Mucosal folds |
Greater |
Lesser |
|
|
|
7
A E R
O N
E S
H T
O R
AT
K C E N D N A

8 |
Chapter 1 Ear |
1.2
ENT Examination
Tuning Fork Tests
Weber Test
Tuning fork tests are generally performed with a 512-Hz fork. The vibrating fork is placed on the patient’s forehead. Sound lateralized to the poor hearing ear indicates a conductive hearing loss. Sound lateralized to the better hearing ear suggests a sensorineural hearing loss in the opposite ear.
Rinne Test
The vibrating fork is placed first on the mastoid bone. When the patient no longer hears, the tuning fork is brought 1 cm away from the external meatus. The result is expressed as “Rinne positive” when sound is heard longer by air, and “Rinne negative” when sound is heard longer by bone. Normally the sound of the fork is perceived louder when placed in front of the ear canal (Rinne positive).
False Rinne
When the fork is placed on the bone, the vibrations are conducted by bones of the skull to both cochleas. A patient with a total loss of hearing in one ear can hear the sound in the better ear by bone cross-conduction if the fork is placed on the mastoid bone of the diseased ear. The patient does not hear when the fork is brought in front of the external meatus after sound is no longer heard by mastoid bone conduction. TheresultisreportedasanegativeRinneindicatingthepres- enceofconductivehearingloss,wheninfactafalse-negative Rinne has occurred.
Fig. 1.2.1 Pathologies in the external and middle ear cause conductive hearing loss
Fig. 1.2.2 Pathologies in the inner ear and the hearing nerve cause sensorineural hearing loss
Fig. 1.2.3 Tuning fork tests. (a) Normal hearing: Weber test, the sound heard by both ears is equal, no lateralization; Rinne test bilateral +. (b) Conductive hearing loss in the right ear: Weber test, the sound is lateralized to the right ear; Rinne test is negative on the right ear, positive in the left ear. (c) Sensorineural hearing loss in the right ear: Weber test, the sound is lateralized to the left ear. Rinne test is positive in both ears; however, the duration is shorter in the right ear. (d) Total hearing loss in the right ear: Weber test, the sound is lateralized to the left. Rinne is positive in the left ear and negative in the right ear

Table 1.2.1 Tuning fork tests and type of hearing loss
Rinne |
Weber |
Type of hearing loss |
(diseased ear) |
|
|
Positive |
Not lateralized |
Normal hearing |
Positive |
Lateralized to |
Sensorineural hearing |
|
the better ear |
loss |
Negative |
Lateralized to |
Conductive hearing |
|
the diseased ear |
loss |
Negative |
Lateralized to |
Total sensorineural |
|
the better ear |
hearing loss |
Fig. 1.2.4 Soundproof hearing test rooms
Fig. 1.2.5 Audiometer to test hearing
|
|
|
|
|
1.2 |
ENT Examination |
||
a |
|
|
Frekanslar (HZ) |
|
|
|
|
|
|
125 |
250 |
500 |
1000 |
2000 |
4000 |
8000 |
|
|
-10 |
|
|
|
|
|
|
|
|
0 |
|
|
|
|
|
|
|
1964)- |
10 |
|
|
|
|
|
|
|
20 |
|
|
|
|
|
|
|
|
|
|
|
|
|
|
|
|
|
(ISO |
30 |
|
|
|
|
|
|
|
40 |
|
|
|
|
|
|
|
|
|
|
|
|
|
|
|
|
|
dB |
50 |
|
|
|
|
|
|
|
|
|
|
|
|
|
|
|
|
Seviyesi |
60 |
|
|
|
|
|
|
|
70 |
|
|
|
|
|
|
|
|
|
|
|
|
|
|
|
|
|
Isitme |
80 |
|
|
|
|
|
|
|
90 |
|
|
|
|
|
|
|
|
|
|
|
|
|
|
|
|
|
|
100 |
|
|
|
|
|
|
|
|
110 |
|
|
|
|
|
|
|
|
120 |
|
750 |
1500 |
3000 |
6000 |
|
|
|
|
|
|
|||||
b |
|
|
Frekanslar (HZ) |
|
|
|
|
|
|
125 |
250 |
500 |
1000 |
2000 |
4000 |
8000 |
|
|
-10 |
|
|
|
|
|
|
|
|
0 |
|
|
|
|
|
|
|
1964)- |
10 |
|
|
|
|
|
|
|
20 |
|
|
|
|
|
|
|
|
|
|
|
|
|
|
|
|
|
(ISO |
30 |
|
|
|
|
|
|
|
40 |
|
|
|
|
|
|
|
|
|
|
|
|
|
|
|
|
|
dB |
50 |
|
|
|
|
|
|
|
|
|
|
|
|
|
|
|
|
Seviyesi |
60 |
|
|
|
|
|
|
|
70 |
|
|
|
|
|
|
|
|
|
|
|
|
|
|
|
|
|
Isitme |
80 |
|
|
|
|
|
|
|
90 |
|
|
|
|
|
|
|
|
|
|
|
|
|
|
|
|
|
|
100 |
|
|
|
|
|
|
|
|
110 |
|
|
|
|
|
|
|
c |
|
|
Frekanslar (HZ) |
|
|
|
|
|
|
125 |
250 |
500 |
1000 |
2000 |
4000 |
8000 |
|
|
-10 |
|
|
|
|
|
|
|
|
0 |
|
|
|
|
|
|
|
1964)- |
10 |
|
|
|
|
|
|
|
20 |
|
|
|
|
|
|
|
|
|
|
|
|
|
|
|
|
|
(ISO |
30 |
|
|
|
|
|
|
|
40 |
|
|
|
|
|
|
|
|
|
|
|
|
|
|
|
|
|
dB |
50 |
|
|
|
|
|
|
|
|
|
|
|
|
|
|
|
|
Seviyesi |
60 |
|
|
|
|
|
|
|
70 |
|
|
|
|
|
|
|
|
|
|
|
|
|
|
|
|
|
Isitme |
80 |
|
|
|
|
|
|
|
90 |
|
|
|
|
|
|
|
|
|
|
|
|
|
|
|
|
|
|
100 |
|
|
|
|
|
|
|
|
110 |
|
|
|
|
|
|
|
|
120 |
|
750 |
1500 |
3000 |
6000 |
|
|
|
|
|
|
|||||
Fig. 1.2.6 Audiograms. (a) Normal hearing curve, (b) hearing loss due to acoustic trauma, (c) conductive-type hearing loss due to otosclerosis
9
A E R
O N
E S
H T
O R
AT
K C E N D N A

10 |
Chapter 1 Ear |
Tympanometry
Tympanometry is an indirect measure of the mobility (compliance) of the tympanic membrane and ossicular chain under different pressures. The mobility of the tympanic membrane is greatest when the pressure on both sides of the tympanic membrane is equal. Compliance is reduced as air
pressure is increased or decreased from normal. High acoustic energy is applied in the ear canal, some of this energy is absorbed and the remainder is reflected back and received by the probe. When the mobility is decreased, the energy is reflected more than the normal. In ears filled with fluid, tympanic membrane thickening, or ossicular chain stiffening, the reflected energy is greater than in normal ears.
Fig. 1.2.7 Classification of tympanograms. (a) Type A: The curve peaks at 0 mm H2O, indicating no pressure difference exists between the middle ear and the external environment. (If the peak of the curve is lower than the normal type A curve, stiffening of the ossicular chain is often associated. If the peak of the curve is very high, it suggests ossicular discontinuity). (b) Type B: The tympanogram is relatively flat or dome shaped. This shows little change in the reflec-
tive quality of the tympano-ossicular system as air pressures change in the external canal. This type of tympanogram is generally associated with middle ear fluid. (c) Type C: The peak of the curve occurs with higher negative pressures (maximum compliance is reached at negative pressures, meaning the pressure in the middle ear is negative). This curve indicates eustachian tube dysfunction
a
Fig. 1.2.8 Auditory brain stem response test. (a) Illustration showing the organs of hearing and the cerebellum. Sound waves are channeled by the pinna (visible part of the ear) into the auditory canal (pink) toward the eardrum. The eardrum transmits the vibrations to three tiny bones, the malleus, incus, and stapes, in the middle ear. The stapes passes the vibrations to the inner ear structures (purple), the
semicircular canals and the cochlea (spiral). Auditory sensations are picked up by the cochlear nerve (yellow) and transmitted to the medulla (brain stem), the thalamus, and ultimately the cerebral cortex (visual photos). (b) The source of potentials. (c) Normal auditory brain stem response with six waves from five different anatomic sites

1.2 ENT Examination
b |
c |
Fig. 1.2.8 (Continued) |
|
|
Table 1.2.2 The source of the potentials (Fig. 1.2.8 a, b, c) |
a |
|
Anatomic localization |
Wave |
|
Cochlea, eighth nerve |
I and II |
|
Cochlear nucleus |
III |
|
Olivary complex |
IV |
|
Lateral lemniscus |
V |
|
Inferior colliculus |
VI |
|
|
|
|
Fig. 1.2.9 Dix Hallpike maneuver for benign positional vertigo. Bringing the head to the head-hanging position may cause vertigo and nystagmus
Table 1.2.3 Differential diagnosis in positional vertigo
|
Peripheral |
Central |
Latent period |
+ |
– |
Adaptationa |
+ |
– |
Fatiguea |
+ |
– |
b
Fig. 1.2.10 (a, b) Temporal bone CT scans. External auditory meatus, middle ear cavity, attic, mastoid aircells, cochlea, semicircular canals, and internal acoustic canal (and falciform crest in the internal acoustic canal) can be seen
aVertigo adapts by holding the patient’s head in the same position; vertigo fatigues on repeated positioning.
11
A E R
O N
E S
H T
O R
AT
K C E N D N A

12 |
Chapter 1 Ear |
Fig. 1.2.11 Axial temporal MR image of the cochlea. Semicircular canals and cochlear and vestibular nerves can be identified
Fig. 1.2.12 Axial temporal MR shows acoustic neuroma in the left cerebellopontine angle
Table 1.2.4 Causes of conductive hearing loss
a
Cerumen
Congenital ear atresia
Foreign body in the external ear canal
Hemotympanum
Chronic otitis media
Tympanic membrane perforation
Ossicular chain disruption
Temporal bone fractures, longitudinal
Benign tumors of the middle ear
Malignant tumors of the middle ear
Other
b
Fig. 1.2.13 (a, b) Electrovideonystagmography to record the eye movements and to analyze the nystagmus
Table 1.2.5 Causes of sensorineural hearing loss
Presbyacusis
Noise-induced hearing loss
Ototoxicity
Endolymphatic hydrops
Acoustic neuroma
Labyrinthitis
Transverse temporal bone fracture
Enlarged vestibular aqueduct syndrome
Congenital inner ear abnormalities
Other

1.2 ENT Examination
Vestibular tests should not be performed if the patient is taking vestibular suppressants or alcohol.
Electronystagmography (ENG) analyzes the eye movements. Eye movements that are tested include saccade, pursuit, and gaze. Saccade is a rapid eye movement made to bring the target onto the fovea. Pursuit is following a moving object.Gazeisfixationoftheeyesonatarget20–30°bilater- ally for at least 30 s. ENG recordings are also made with positional tests, optokinetic tests, and caloric tests.
All abnormalities in the oculomotor tests, such as in saccades, tracking, and gaze, indicate CNS disease. Failure of fixation suppression during caloric tests shows CNS disease.
Table 1.2.6 Electronystagmography abnormalities |
|
|
Test with abnormality |
Location |
|
|
|
of lesion |
Saccade test |
CNS |
|
Gaze test |
|
|
Spontaneous nystagmus suppressed by visual fixation |
Peripheral |
|
Spontaneous nystagmus not suppressed by visual |
CNS |
|
|
fixation |
|
Unilateral or bilateral gaze nystagmus |
CNS |
|
|
Periodic alternating nystagmus |
CNS |
|
Rebound nystagmus |
CNS |
Upbeating or downbeating nystagmus |
CNS |
|
Tracking test |
CNS |
|
Optokinetic test |
CNS |
|
|
|
|
Calorictest:Eachearisirrigatedwithwaterat30and44°. Air may also be used for this purpose. The caloric stimulus causes nystagmus. Nystagmus is classified according to the direction of the fast phase. Cold stimulus causes nystagmus to the opposite side and warm stimulus causes nystagmus to the same side. The caloric test only tests the horizontal semicircular canals. More than 20% difference between the two ears is interpreted as weakness or canal paresis on that side.
Table 1.2.7 Caloric test abnormalities
Unilateral or bilateral weakness |
Peripheral |
Directional preponderance |
Peripheral or CNS |
Failure of fixation suppression |
CNS |
Caloric inversion or perversion |
CNS |
|
|
13
A E R
O N
E S
H T
O R
AT
K C E N D N A
14 |
Chapter 1 Ear |
1.3
The Pinna
b
Fig. 1.3.3 Macrotia is a large pinna
a
Fig. 1.3.1 (a) Preauricular skin tags are generally unilateral. They can be removed before school age if they cause cosmetic deformities. (b) Cartilage remnants in front of the tragus
Fig. 1.3.2 Preauricular fistulas are due to fusion abnormalities during embryogenic development of the auricle. Seventy-five percent of cases are unilateral. If the orifice of the fistula is narrow, the debris may occlude the orifice and cause secondary infection. The whole sinus tract should be removed surgically
b
Fig. 1.3.4 Prominent ear. (a) Posterior view before the operation and
(b) 3 months after the operation. In prominent ears, the fold of the antihelix is either absent or poorly formed and the angle between the posterior surface of the conchal cartilage and the cranium is over 300°. There is an autosomal dominant inheritance. It is also referred to as bat ears or lop ears. Prominent ears should be corrected before school age, between 4 and 6 years

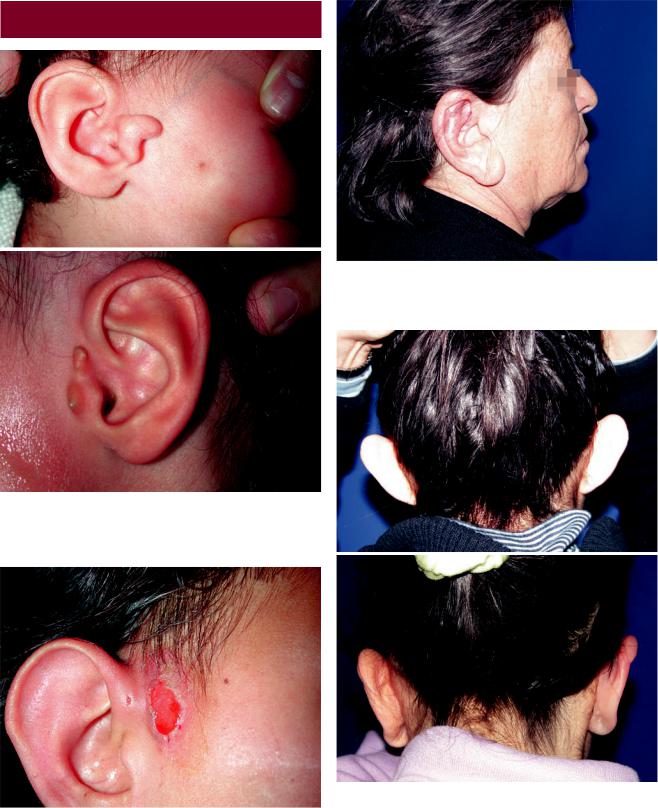
Fig. 1.3.5 Abnormalities of the auricle range from minor abnormalities that require no treatment to total absence of the pinna. Since the embryological development of the pinna is completely different from the middle and inner ear, it is not generally associated with middle and inner ear abnormalities. However, atresia of the external ear canal may accompany microtia. (a, b) In type I microtia deformity, the deformity is only limited to the helix and antihelix and it is a minimal deformity. (c, d) In type II there is severe deformity, although the remnant of the pinna is present. (e, f) In type III deformity there is no pinna. Generally the external ear canal is completely atresic. In some patients the lobule may be present. The optimum age for surgery is around 5 years, until the other auricle reaches its adult size and the costal cartilage development is sufficient to be used in reconstruction. It is also important to operate on children before school age
a
c
e
b
d
f
1.3 The Pinna 15
A E R
O N
E S
H T
O R
AT
K C E N D N A
Fig. 1.3.6 In the complete absence of the auricle, an auricular |
Fig. 1.3.7 Sebaceous cyst in the postauricular sulcus. Complete |
implant may give a natural appearance |
removal is necessary to prevent recurrences |