

TOM-3
.pdfНар яду с исчезновением жалоб на болевые ощущения в области сер дца, сер дцебиение, головные боли, головокр ужение, у подавляющего большинства больных отмечено улучшение: общего самочувствия, показателей качества жизни: в 1-й гр уппе с ГБ 1 ст. на 3,2%, во 2-й гр уппе с ГБ 1 ст. – на 6,3%, с ГБ 2 ст. – на 32,9%, с ГБ 3 ст. – на 30,9%. Улучшение ЛТ у пациентов в 1-й гр уппе с ГБ 1 ст. – на 36,8%, во 2-й гр уппы с ГБ 1 ст. – на 38,4%, с Гб 2 ст. – на 19,9%, с ГБ 3 ст. – на 40,7%. Улучшение РТ у пациентов 1-й гр уппы с ГБ 1 ст. – на 48,9%, во 2-й гр уппе с ГБ 1 ст. – на 40,8%, с ГБ 2 ст. – на 36,8%, с ГБ 3 ст. – на 40,7%. У пациентов в 3-й контр ольной гр уппе достовер ных изменений не выявлено.
Для оценки пр одолжительности положительного эффекта от ТЭСтер апии пр оводилось исследование центр альной и пер ифер ической гемодинамики и клинического состояния пациентов чер ез 1, 2 и 3 месяца. Было показано, что у пациентов с ГБ 1 ст. положительные эффекты сохр анялись на пр отяжении 1–2 месяцев с момента пр оведения ТЭСтер апии, у больных с ГБ 2, 3 ст. – на пр отяжении 2–3 месяцев.
Выводы
1.Оптимальными р ежимами ТЭС-тер апии пр и ГБ являются следующие: пр и 1-й стадии ГБ эффективна монотер апия ТЭС (силой тока 0,5–0,8 мА, пр одолжительность 30–40 мин. ежедневно) по 5–7 сеансов на кур с интер валом для повтор ных воздействий 1–2 месяца. Пр и 2-й
и3-й стадии ГБ ТЭС-тер апия (сила тока 0,8–1,2 мА той же пр одолжительности) в сочетании с медикаментозным лечением 8–10 сеансов на кур с с интер валом для повтор ных воздействий 2–3 месяца.
2.Гипотензивный эффект ТЭС-тер апии опоср едован пер естр ойкой микр оцир куляции, заключающейся в уменьшении спастических эффектов на ур овне р езистивного отдела и пр иводящей к коррр екции патологических типов микр оцир кулятор ного р усла.
3.Пр именение ТЭС-тер апии можно р ассматр ивать как один из альтер нативных методов коррр екции микр оцир кулятор ных нар ушений у больных с ГБ 1 стадии и дополнительный метод в комплексной медикаментозной тер апии пациентов со 2 и 3 стадиями ГБ, котор ый может шир око пр именяться как в условиях стационар а, так и поликлиниче ской и санатор но-кур ор тной пр актике.
Литература
1. Алмазов В. А., Арабидзе Г. Г., Белоусов Ю. Б. Пер вичный доклад экспер товНаучногообществапоизучениюар тер иальнойгипер тонии,Всер оссий скогонаучногообществакар диологовиМежведомственногосоветапосер деч- но-сосудистым заболеваниям // Русский медицинский жур нал. – 2000. – Т. 8, № 8. – С. 325–326.
241
16. Заказ № 282
2.Бритов А. Н. Вопр осы пр офилактики и лечения ар тер иальной гипер тонии на популяционном ур овне // Клин. мед. – 1984. – № 9. – С. 9–43.
3.Голиков А. П., Павлов В. А., Карев В. А. и соавт. Влияние тр анскр аниальной электр остимуляции на р епар ативные пр оцессы у больных инфар ктом миокар да // Кар диология. – 1989. – Т. 29, № 12. – С. 45–48.
4.Оганов Р. Г. Данные ГНИЦПМ РФ, пр едставленные в докладе ДАГ 1 // Кар диология. – 2000. – Т. 40. – С. 1–4.
5.Оганов Р. Г., Масленникова Г. Я. Смер тность от сер дечно-сосудистых
идр угих хр онических неинфекционных заболеваний ср еди тр удоспособного населения России // Кар диоваскуляр ная тер апия и пр офилактика. – 2002. – № 3. – С. 4–8.
6.Оганов Р. Г., Масленникова Г. Я. Совер шенствование пр офилактики неинфекционных заболеваний в России // Вр ач. – 2004, № 9. – С. 4–6.
7.Кушаковский М. С. Гипер тоническая болезнь / Москва.: «Сотис». – 1995. – С. 12–14.
8.Лебедев В. П., Фан А. Б., Кацнельсон Я. С. и др. Тр анскр аниальная электр остимуляция: новый подход / Сбор ник статей. Тр анскр аниальная электр остимуляция. Экспер иментально-клинические исследования. Ред. Лебедев В. П. – СПб.: 2003. – Т. 1. – С. 408–417.
9.Лебедев В. П. Тр анскр аниальная электр остимуляция: новый подход / Сбор ник статей. Тр анскр аниальная электр остимуляция Экспер иментальноклинические исследования. Ред. Лебедев В. П. – СПб.: 2003. – Т. 1. – С. 22– 38.
10.Левтов. В. А., Н. Шуваева. В. Н. Влияние тр анскр аниальной элект- р остимуляции на р еологические свойства кр ови // Новый метод тр анскр аниального обезболивания. Теор етические основы и пр актическая оценка: Тез. докл. Ленингр ад, «Наука». – 1987. – C. 9–10.
11.Маколкин В .И., Бранько В. В., Богданова Э. А. Метод лазер ной допле- р овской флоуметр ии в кар диологии. / М.: –1999. – 48 с.
12.Чазова И. Е., Ратова Л. Г., Дмитриев В. В. Синицин В. Е., Стукало-
ва О. В. Влияние длительной тер апии комбинацией лозар тана и гидр охлор - тиазида на суточный пр офиль ар тер иального давления и гипер тр офию левого желудочка у больных с мягкой и умер енной ар тер иальной гипер тонией // Кар - диология. – 2003. – С. 60–64.
13.Шевченко О. П., Праскурничий Е. А. Ар тер иальная гипер тония и це- р ебр альный инсульт / Москва, 2001.
14.Шальнова С. А., Деев А. Д., Вяхирева О. В. и др. Ар тер иальная гипер тония. Инфор мир ованность, лечение, контр оль // Укр епление здор овья и пр офилактика заболеваний. – 2001, № 4. – С. 3–7.
15.Boudier H. A. Microcirculation in hypertension // Eur. Heart J. – 1991. – suppl. P. L: 32–37
16.Kannel W. Epidemiological implications of left ventricular hypertrophy / Left ventricular hypertrophy and its regression. Eds. By Cruickshank J. M., F. H. Messerli. London, «Science Press». – 1992. – P. 1–13.
17.Liebeskind J. G., Gulbaud G., Besson J. M., Oliveras J. L. Analgesia from electrical stimulation of the periaqueductal grey mater in the cat: behavioral obser-
242
vations and inhibitori effects on spinal cord interneurons // Brain Res. – 1973. – Vol. 50, № 3. – P. 441–446.
18. Shurtleff D. Some characteristics related to the incidence of the cardiovascular disease and death. Framingham Study. 18-year follow-up / In: Kannel W. B. Gordon T., eds. The Framingham Study Monograph (section 30). Washington D. C.: USA-PO DHEW Public No. (NIH). – 1974. – P. 74–99.
34. Orthostatic Response in Rats
AfterR Hindlimb Unloading: EffectCT of Transcranial
Electrical Stimulation
Tarasova O., Borovik A., Tsvirkoun D., Lebedev V., Steeves J.,
Krassioukov A.
Institute for Biomedical Problems;
Dept. of Human & Animal Physiology, M. V. Lomonosov Moscow State University, Moscow; I. P. Pavlov Institute of Physiology, St.-Petersburg, Russia; ICORD, Dev. Phys. Med & Rehabilitation, School of Rehabilitation, Department of Medicine, University of British Columbia, and Vancouver Coastal Health, Vancouver, BC, Canada
Ортостатическая реакция у крыс после разгрузки задних конечностей: эффект транскраниальной электростимуляции
Резюме
Ор тостатическая гипотензия является обычно наблюдаемым явлением после модельной микр огр авитации и пр и р азличных фор мах вегетативной дистонии. Считается, что недостаточность активации нисходящей симпатоактивир ующей системы может игр ать существенную р оль в возникновении этого явления. Нами исследовалось влияние тр анскр аниальной электр остимуляции (ТЭС) на вегетативные ядр а мозга пр и ор тостатической гипотензии, вызванной воспр оизведением микр огр авитации на модели длительной р азгр узки задних конечно стей. 20 кр ыс-самцов линии Вистар подвешивали за хвост с углом линии тела по отношению к полу клетки пр имер но в 400. 11 таких же кр ыс служили контр олем, их помещали в такие же клетки без вывешивания. Ор тостатическая р еакция опр еделялась в тесте пр и подъеме головы на 450 в течение 3 мин. У 10 кр ыс, пр ошедших вывешивание, ор тостатическая пр оба пр оизводилась на фоне ТЭС. У животных после вывешивания без ТЭС ор тостатическая пр оба вызывала значительное падение ср еднего ар тер иального давления на 18,4 ± 2,2%. В то же вр е- мя на фоне ТЭС падение давления составляло 9,5 ± 1,8% (P < 0,05),
что пр иближалось к значениям, наблюдаемым в контр ольной гр уппе – 6,9 ± 1,1%. Результаты настоящего исследования показывают, что ТЭС значительно уменьшает падение ар тер иального давления пр и ор тостатической пр обе у животных с последствиями моделир ованной микр огр авитации. Возможно, что ослабление нисходящих симпатоактивир ующих влияний игр ает важную р оль в возникновении гипотензии и сосудистой недостаточности у космонавтов после возвр ащения из космического полета
244
Introduction
Orthostatic intolerance is a commonly observed phenomenon after exposuretomicrogravityandinvariousformsofautonomicfailure,including cervical and high thoracic spinal cord injury [3, 9, 16]. It is characterized by a failure of the body to properly adjust to an upright position, especially with respect to blood flow, heart rate, and blood pressure. Therefore, the development of novel tools (in particular, noninvasive treatments) that could ameliorate hypotensive events is of great importance to improve the quality of life both for patients and for astronauts upon their return to Earth. Although numerous mechanisms can contribute to any observed orthostatic hypotension, it has been suggested that a decrease of descending sympathoexcitatory input from supraspinal structures could contribute to this phenomenon [7].
It has been shown that noninvasive transcranial electrical stimulation (TES) can activate central autonomic structures involved in arterial blood pressureandpaincontrol[10,12,13].Thisnoninvasiveelectricalstimulation method has been observed to selectively activate the brain endorphinergic system, significantly increasing β-endorphin levels within the brain, cerebrospinal fluid, and blood of both animals and humans [15]. It has also been shown that TES has a significant homeostatic effect on vasomotor regulation [1, 12, 13]. The potential mechanisms and central nervous system (CNS) pathways for these TES effects were outlined in previous reports. It has been shown that TES attenuates the increased neuronal activity within sympathetic preganglionic fi bers, elicited by either electrical stimulation of somatic afferents or direct electrical stimulation of the ventrolateral medulla [12]. TES was also shown to attenuate the pressor response following cerebral ischemia [12]. Clinical studies have showed that TES can be used in the treatment of hypertension, different forms of vasomotor dystonia, and hypotension [1, 13]. The latter observation allowed us to hypothesize that TES might be useful for ameliorating orthostatic hypotension. The present study was directed to investigate the effects of TES on postural changes of arterial pressure in rats after 2 wk of simulated microgravity which was induced by maintained head-down tail suspension.
Methods
Animals. The Ethics Committees at the Pavlov Institute of Physiology (St.-Petersburg, Russia), the Institute for Biomedical Problems (Moscow, Russia), and the University of British Columbia (Vancouver, BC, Canada) approved the experimental protocol for the present study. Male Wistar rats, 12 wk old, were individually housed in standard cages (50 × 50 × 50 cm) under controlled conditions of temperature (22–24°C), humidity (50–70%), and a rotating 12-h light/dark cycle. At the beginning of the study, each animal weighed between 280–320 g. Water and standard rat chow were
245
provided ad libitum. After a 1-wk acclimatization to the cage environment, the rats were randomly assigned to one of three groups: tail-suspended rats to simulate a microgravity (Suspension, N = 10); tail-suspended rats that wouldalsosubsequentlyundergoTES(Suspension+TES,N= 10); andcage control rats, which did not undergo a simulated microgravity experience or TES (Cage-Control, N = 11).
TailSuspension. Ahindlimb unloadingmodelofsimulatedmicrogravity was originally developed by Morey et al. [19] and later modified in our experiments [24]. The hindlimbs of the rats were maintained in an elevated position via a metal wire attached to the proximal third of the tail with adhesivematerial.Thewirewasconnectedbyaharnesstoaswivelapparatus at the top of the cage. The height of the hindlimb elevation was adjusted to prevent the hindlimbs from touching any supporting surface, and normally required a suspension angle of 40–45° from horizontal. The forelimbs always maintained contact with the cage floor, allowing each animal a full range of motion and free access to food and water. The animals remained under tail suspension or in unsuspended control conditions for a total of 14 d, which ensured stable alterations in blood pressure control [24]. No signs of ischemia of the tail were observed in any of the tailsuspended animals.
Blood Pressure Measurement. The experiments were performed on day 15 under urethane anesthesia (1.2g∙kg-1, i.p.). The suspended animals were anesthetized while remaining in the headdown position. The order of experiments for all rats in the different groups was randomly assigned. For continuous blood pressure recording a polyethylene catheter (0.9 mm o.d., 0.58 mm i.d.) was inserted via the right common carotid artery into the aortic arch. To avoid any coagulation, the catheter was continuously flushed with heparinized saline (10 U∙ml-1) at the rate of 0.003 ml∙min-1. The trachea was intubated to facilitate spontaneous ventilation during the experiment. The rat was fixed in the horizontal position (ventral side of body down). Body temperature was maintained at a rectal temperature of 37 °C via a heating pad controlled by feedback circuit from the rectal probe. Blood pressure was recorded with a Statham P23AA pressure transducer (Gould, Cleveland, OH) that was placed at the level of the heart so that any body tilting would not influence the arterial blood pressure. The pressure transducer output was amplified and converted into a digital form (16-bit ADC, L-Card, Moscow, Russia) using a sampling time of 4 ms. The data were stored on a computer hard disk for off-line processing.
Observation of the tilt-induced blood pressure response (orthostatic challenge) was performed as follows: anaesthetized rats were quickly subjected to a consistent 45° head-up tilt from the horizontal. The axis of rotation was placed at the heart level. Each head-up tilt lasted 3 min. The fi rst tilt test was performed after a 15-min post-surgical stabilization period. In total, seven tilt tests were undertaken, each separated by a 7-min rest interval: two tests before TES, three tests during TES (TES was on) and two
246

tests after TES. This allowed us to estimate the reproducibility of orthostatic changes in blood pressure and dynamics due to the TES effect.
Transcranial Electrical Stimulation (TES). TES was performed through stainlesssteelelectrodes(0.8mmthick,15mmlong)insertedsubcutaneously. One electrode (cathode) was positioned within the interorbital region and two others electrodes (anodes) behind the auricles (12). Electrical stimulation consisted of monopolar rectangular DC impulses delivered from the Transair-01 stimulator (TES Center, St. Petersburg, Russia [13]) using the following pulse parameters: 0.8 mA amplitude, 3.5 ms duration, and 70 Hz frequency. We previously demonstrated that these DC impulse parameters are optimal to elicit analgesia and β-endorphin release in rats [12, 14, 15]. Commonly, the current was increased in 3 to 4 0.2-mA steps, so that the maximal amplitude of 0.8 mA was obtained in ~6 min. This stimulus amplitude was then maintained for 30 min during the third, fourth, and fifth (TES was on) tilt tests in the Suspension + TES group. In two groups (Cage-Control and Suspension without TES), the electrodes were inserted as described above, but no current was switched on.
DataandStatisticalAnalyses.Thebloodpressuresignalswereprocessed using software of our own design. Mean arterial pressure (MAP) and pulse interval (PI) values were calculated for each beat. Using linear interpolation, these data were transformed into an equidistant ( t= 100 ms) time series for further analysis. To study MAP dynamics in both the frequency and time domain, discrete wavelet transformation was used:
|
1 |
|
|
— t |
||
W (t, a) |
|
|
s( ) |
|
d, |
|
a |
a |
|||||
|
— |
|
|
|||
|
|
|
|
|
||
where a determines the time scale of analyzing wavelet ψ. Using wavelet decomposition we investigated the intrinsic dynamics of MAP in three time scales: 1) a highfrequency band (f ~ 1.0–1.5 Hz), where the rat’s blood pressure oscillations relate to respiration; 2) a midfrequency band (f ~ 0.15– 0.7 Hz) where sympathetically mediated vasomotor waves are manifested (1411 ); and 3) a smoothed signal (f < 0.1 Hz), characterizing the slower changesofMAP.Theamplitudesofhigh-andmediumfrequencyoscillations were calculated by means of an analytical signal approach:
S(t) = A(t)ei (t) = s(t) + is(t),
where s(t) is the Hilbert transform of the extracted signal and amplitude is
A(t) 
 s2 (t) s2 (t).
Amplitude values were then averaged over 10 s. MAP and PI changes duringtiltwerecalculatedfromthesmoothedsignals.ForMAPthefollowing
247
parameters were calculated: baseline – mean value for the 1-min period before tilt; maximal drop – the minimal value of MAP observed during the first 30 s of the tilt; plateau – mean value for the rest of the 2.5 min of the tilt minus baseline MAP; and overshoot – the mean value observed during the second post-tilt minute minus baseline MAP. For pulse interval response only baseline and plateau values were calculated. Statistical analysis was done using the Mann-Whitney and Wilcoxon non-parametric tests. All data are presented as mean ± SEM.
Results
On the day of blood pressure recording, no statistically signifi cant differenceinbodymasswasobservedbetweenthethreeexperimentalgroups. Body mass values for the Cage-Control, Suspension, and Suspension + TES groups were 326.9 ± 7.0 g, 309.5 ± 9.8 g, and 322.9 ± 10.3 g, respectively.
Baseline Values of Hemodynamic Parameters. At the beginning of each experiment, baseline values of MAP and PI did not differ among the three groups of rats (Table I). The Cage-Control and Suspension control
|
|
|
|
|
|
Table 1 |
|
Baseline Values of Hemodynamic Harameters Observed Prior |
|||||
|
|
to seven consecutive tilt tests |
|
|||
|
|
|
|
|||
Test |
Mean Arterial Pressure (mmHg) |
|
Pulse Interval (ms) |
|||
|
|
Suspension + |
|
|
Suspension + |
|
No |
Control |
Suspension |
Control |
Suspension |
||
|
|
|
TES |
|
|
TES |
1 |
108,8 ± 4,7 |
100,2 ± 5,2 |
105,3 ± 4,8 |
162,8 ± 7,3 |
166,3 ± 7,8 |
160,3 ± 7,1 |
2 |
111,7 ± 4,2 |
106,3 ± 6,0 |
104,5 ± 4,2 |
157,0 ± 4,7 |
161,2 ± 7,9 |
163,8 ± 6,8 |
3 |
110,1 ± 3,7 |
99,7 ± 4,4 123,8 ± 5,8* |
156,5 ± 4,4 |
163,0 ± 7,1 |
130,2 ± 1,9* |
|
4 |
114,0 ± 2,7 |
93,1 ± 4,2 115,0 ± 4,1* |
154,4 ± 3,6 |
164,4 ± 6,2 |
136,4 ± 2,5** |
|
5 |
115,5 ± 3,2 |
94,0 ± 5,6* |
111,0 ± 4,2 |
151,9 ± 3,6 |
159,5 ± 5,7 |
141,2 ± 2,5** |
6 |
114,7 ± 2,7 |
95,1 ± 5,2* |
109,8 ± 3,9* |
151,0 ± 3,1 |
157,9 ± 5,0 |
144,7 ± 2,3* |
7 |
115,9 ± 2,6 |
99,7 ± 6,7* |
107,6 ± 3,4 |
150,2 ± 3,0 |
155,4 ± 5,4 |
146,1 ± 2,3 |
* P < 0,05 vs Control; ** P < 0,05 vs. Suspension.
groups did not show prominent test-to-test changes in baseline MAP and PI values. During the entire 1.5-h experiment, MAP in the Cage-Control group tended to increase, whereas in the Suspension control group it tended to decrease. Therefore, before the fourth to seventh head-up tilt tests, MAP in the Suspension group was lower than in the Cage-Control group. There was also a small tachycardia observed in both the Cage-Control and Suspension groups throughout the recording period.
In the Suspension + TES animals, TES resulted in an increased MAP and shortened PI. These MAP alterations were observed immediately after initiation of the TES current and gradually increased while the current was
248
stepwise elevated up to 0.8 mA, so that before the third orthostatic tilt test, MAP was increased and reached resting parameters of the control group (Table I). Thereafter, slow normalization of MAP and PI was observed. However, a slight tachycardia persisted in the Suspension + TES group (as compared to the Suspension group without TES), even when the TES was turned off (Table I).
Changes of Hemodynamic Parameters During Orthostatic Challenge. In the Cage-Control group, head-up tilt resulted in a prominent and reproducible decline of MAP (Fig. 1). The maximal drop of MAP was 16.4 ± 1.1% of its baseline value (the valueaveragedforallseventests). Afterwards, MAP showed prompt restoration (compensatory phase of the response). During plateau, MAP level was 9.2 ± 1.7 mmHg lower than baseline (8.0 ± 1.1%, mean from first and second tests). A slight overshoot was observed after the test followed by arterial blood pressure returning to baseline values (Fig. 1).
In the Suspension group, a head-up tilt test caused a prominent decrease in MAP. In this group, the maximal drop was greater than in the Cage-Control: 22.0 ± 1.4%; P < 0.05. Of note, the compensatory phase of the response was virtually absent in the Suspension group. Therefore, plateau MAP level in the Suspension group was 17.4 ± 3.7 mmHg lower than baseline (15.2 ± 2.6%, from first and second tests,
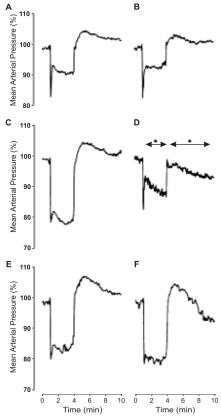
Fig. 1. Effect of transcranial electrical stimulation (TES) on mean arterial pressure (MAP) response to the tilt test in the A, B) Control; C,D) Suspension; and E,F) Suspension + TES groups. The figure shows an average of two pre-TES tilt responses (A, C, F) and the third response to tilt, i. e., the first response during TES in the Suspension + TES group (D) or respective responses in the Control (B) and Suspension (F) groups. Each line corresponds to the response averaged for rats in the group. In each plot Y-axis is responses MAP in % from baseline.
* – P < 0.05 vs. respective data in C.
249
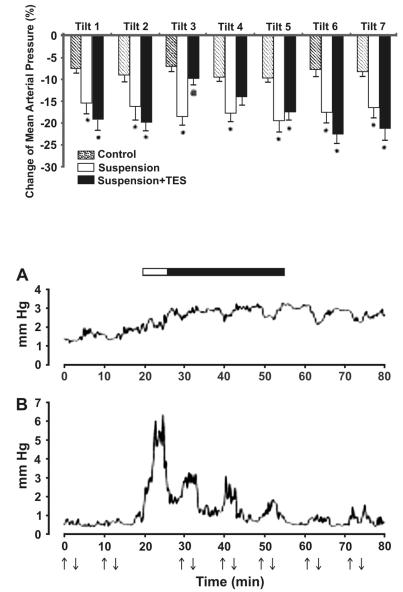
Fig. 2. Changes in mean arterial pressure (MAP, orthostatic drop) during seven tilt tests. * – P, 0.05 vs. respective responses in Suspension without TES.
Fig. 3. Amplitudes of MAP fluctuations A) high-frequency (1.0–1.5 Hz) and B) midfrequency (0.15–0.7 Hz) bands observed in the Suspension + TES group. Each line represents the response averaged for all animals in the group. Arrows up/down indicate tilt tests. Horizontal bar indicates the period of TES (white part: period of growing current; black part: period of constant current, 0.8 mA)
250