

Laser-Tissue Interactions Fundamentals and Applications - Markolf H. Niemz
.pdf118 3. Interaction Mechanisms
Fig. 3.47. (a) Threshold dependence of incident energy density on laser pulse duration for corneal tissue. Measured with a Nd:YLF laser and a Rhodamine 590 dye laser, respectively. The slope of the linear section is 0.52. Data according to Niemz et al. (1993). (b) Same dependence for teeth. The slope of the linear section is 0.46. Unpublished data

3.4 Plasma-Induced Ablation |
119 |
The ionization probability η was defined by (3.50). It is a tissue-dependent parameter and must thus be evaluated from experimental data. Its significance becomes evident when comparing di erent media with each other. In Table 3.13, some values of η are listed as calculated from published threshold data and (3.54). Obviously, the ionization probabilities of cornea and tooth are significantly higher than the corresponding values of water, lens, or vitreous. The accordance of values from di erent authors and experimental conditions is fairly good.
Table 3.13. Ionization probabilities of various targets as calculated from published threshold data
Target |
Reference |
Pulse duration |
η (J/cm2)−1 |
|
|
|
|
H2O (distilled) |
Docchio et al. (1986) |
30ps |
6.0 |
|
|
7ns |
6.4 |
|
Zysset et al. (1989) |
40ps |
2.2 |
|
|
10ns |
0.71 |
|
Vogel et al. (1994a) |
30ps |
1.3 |
|
|
6ns |
0.95 |
Cornea |
Stern et al. (1989) |
1ps |
16.2 |
|
|
30ps |
12.9 |
|
Niemz et al. (1993a) |
10ps |
8.0 |
|
|
30ps |
6.6 |
|
|
60ps |
7.3 |
|
|
200ps |
8.1 |
|
Vogel et al. (1994b) |
30ps |
8.8 |
|
|
6ns |
9.7 |
Lens |
Vogel et al. (1994b) |
30ps |
2.7 |
|
|
6ns |
3.1 |
Vitreous |
Vogel et al. (1994b) |
30ps |
3.8 |
|
|
6ns |
3.9 |
Tooth |
unpublished |
1.5ps |
14.0 |
|
|
30ps |
13.2 |
|
|
|
|
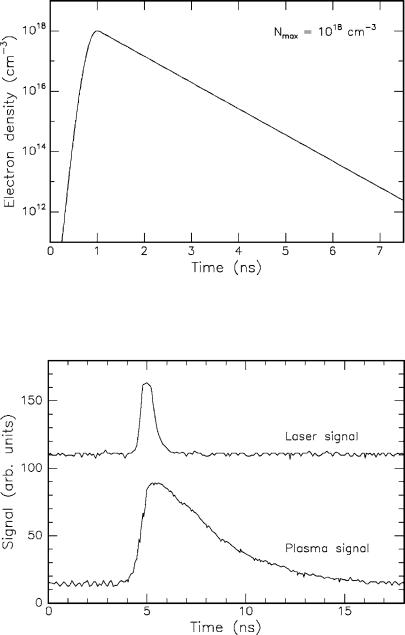
According to (3.58), the temporal evolution of the free electron density after the laser pulse can be approximated by
t
N(t) Nmax exp(− δt) = Nmax exp − τd .
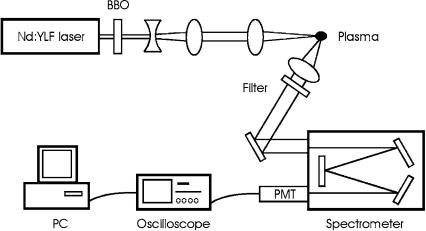
For the same τd = 500ps as chosen above and a typical laser pulse duration of 1ns, the temporal decrease in electron density is illustrated in Fig. 3.48. In theory, the lifetime of the plasma is thus a few nanoseconds. Time-resolved measurements of the plasma were performed by Docchio et al. (1988a-b) and Zysset et al. (1989). The photon emission of a plasma induced by a 30ps pulse from a Nd:YLF laser is captured in Fig. 3.49. The upper and lower traces represent laser pulse and plasma emission, respectively. Both signals
120 3. Interaction Mechanisms
Fig. 3.48. Temporal evolution of free electron density in a laser-induced plasma. The simulation is based on a laser pulse duration of 1ns, i.e. the maximum value Nmax of the electron density is reached after 1ns
Fig. 3.49. Temporal traces of a Nd:YLF laser pulse (pulse duration: 30ps, pulse energy: 500μJ) and plasma emission. The plasma signal was detected with a photodiode at a risetime of approximately 1ns
3.4 Plasma-Induced Ablation |
121 |
were detected with a photodiode at a risetime of 1ns. Even though the laser signal is broadened in time, the lifetime of the plasma can be determined to be approximately 3ns.
The model presented above finally explains the observed square root dependence for the time domain 4ps<τ < 8μs. It also indicates that femtosecond pulses are not associated with a lower threshold energy compared to picosecond pulses, thus providing no significant advantage to several medical laser applications.
3.4.2 Analysis of Plasma Parameters
The interaction type of plasma-induced ablation can be used for diagnostic purposes, as well. By means of a spectroscopic analysis of the induced plasma spark, the free electron density and the temperature of the plasma can be evaluated. Moreover, detailed information on the chemical consistency of the target can be obtained, thereby allowing certain conclusions to be drawn regarding the state of health of the investigated tissue volume.
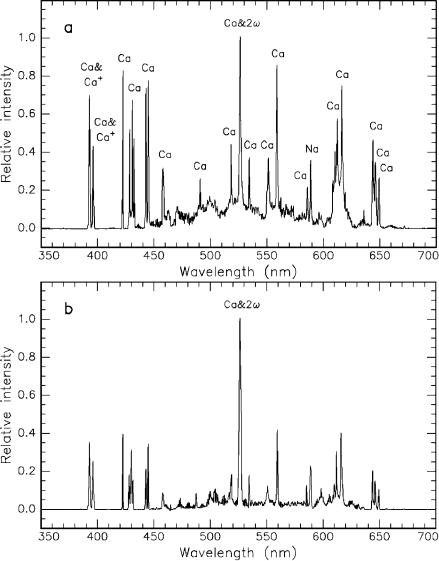
One example for the analysis of laser-induced plasmas is the simultaneous caries diagnosis and therapy developed by Niemz (1994a) which is based on the detection of tooth demineralization and is enabled by the evaluation of plasma spectra. A typical setup for such an experiment is shown in Fig. 3.50. Optical breakdown is induced on the tooth surface by a picosecond Nd:YLF laser. Then, the plasma is imaged on the entrance pupil of a spectrometer and analyzed. Finally, the data are fed into a computer and processed.
Fig. 3.50. Experimental setup for a computer-controlled spectroscopic analysis of laser-induced plasmas
122 3. Interaction Mechanisms
Two typical plasma spectra are shown in Figs. 3.51a–b, one of which was obtained from healthy tooth substance, the other from carious substance. Calcium in neutral and singly ionized states and the major doublet of neutral sodium is found in the spectra according to emission wavelengths listed by Weast (1981). They are the minerals occurring most in dental hydroxyapatite with the chemical formula Ca10(PO4)6(OH)2. Phosphorus is also expected, but neither of its strongest emission lines at 602.4nm and 603.4nm is observed. This result most probably stems from the fact that the plasma temperature is not high enough to transfer phosphate to its atomic constituents, i.e. phosphorus and oxygen. The two lines between 390nm and 400nm probably result from neutral calcium (394.8nm, 397.3nm) and the major emission of singly ionized calcium (393.3nm, 396.8nm). One strong peak can be seen at about 526.5nm that partly arises from a multiplet of calcium lines and from external second-harmonic generation (SHG). A few percent of the incident laser beam are converted to the second harmonic by means of a BBO crystal as seen in Fig. 3.50. Therefore, in the spectra, this peak is labeled “Ca & 2ω”. SHG at the tooth surface is also conceivable, but its amplitude is expected to be surpassed by the calcium multiplet. The detected signal at 526.5nm is normalized to unity. This normalization is useful when comparing spectra of healthy and carious teeth. The latter spectra show a strong decrease for all mineral lines due to the demineralization process induced by caries. Slight deviations in the ratio of calcium and sodium intensities might be observed because of di erent demineralization stages.
The normalization realized in this study is correct only if the di use reflectivities of healthy and carious teeth are the same for the second harmonic at 526.5nm. This was tested by filtering out the fundamental wavelength, thereby preventing plasma generation, and measuring the reflected signal while moving di erent areas of the tooth through the focus. No significant di erence in the intensities was observed. However, since the intensities of the calcium multiplet at 526.5nm are also decreased in carious teeth, the ratio of SHG photons contributing to the normalization signal at 526.5nm varies. Therefore, a direct comparison of absolute intensities cannot be derived from these spectra. For further details on the subject of simultaneous caries diagnosis and therapy, the reader is referred to Sect. 4.2.
An exact evaluation of the plasma temperature is di cult due to the short lifetime of the plasma. Temporal measurements are required to understand the dynamic behavior of the plasma temperature and the free electron density. However, by comparing the intensities of two di erent calcium lines, an estimate of a mean plasma temperature can be given. According to Lochte-Holtgreven (1968), the following relation applies for two spectral lines of the same atomic species in the same ionization stage
I1 |
= |
A1g1 |
λ2 |
exp |
− |
E1 −E2 |
, |
(3.59) |
||
I |
A g |
λ |
kT |
|||||||
|
|
|
|
|
||||||
2 |
|
2 |
2 |
1 |
|
|
|
|
|
|
3.4 Plasma-Induced Ablation |
123 |
Fig. 3.51. (a) Spectrum of plasma on healthy tooth substance induced by a Nd:YLF laser (pulse duration: 30ps, pulse energy: 500μJ). Lines of neutral calcium (Ca), singly ionized calcium (Ca+), and neutral sodium (Na) are seen. The signal at 526.5nm partly originates from calcium and from second harmonic generation (SHG) of the laser beam. (b) Spectrum of laser-induced plasma on carious tooth substance. Due to the process of demineralization, the intensity of all mineral lines is reduced. Data according to Niemz (1994a)
124 3. Interaction Mechanisms
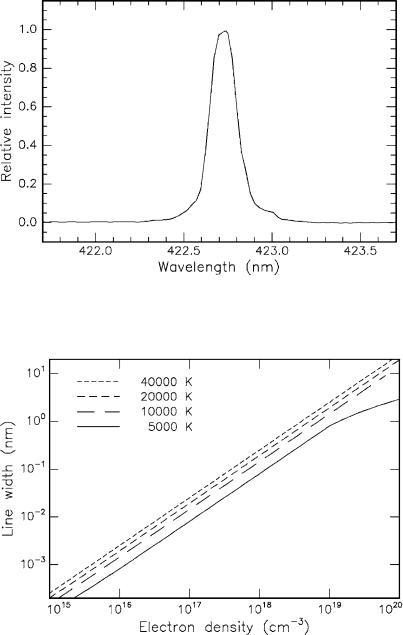
Fig. 3.52. Calcium line at 422.7nm of a plasma on healthy tooth substance. The plasma was induced by a Nd:YLF laser (pulse duration: 30ps, pulse energy: 500μJ). Unpublished data
Fig. 3.53. Dependence of spectral width on plasma density and temperature according to Saha’s equation (plasma temperature: as labeled). Given values apply for the calcium line at 422.7nm. Unpublished data
3.4 Plasma-Induced Ablation |
125 |
where I is the detected intensity, A is the transition probability, g is the statistical weight of the upper energy level, λ is the detected wavelength, E is the upper energy level, k is Boltzmann’s constant, and T is the plasma temperature. By di erentiating (3.59), we obtain
ΔT |
= |
|
kT |
|
(I1/I2) |
. |
(3.60) |
|
E1 −E2 |
|
|||||
T |
|
|
I1/I2 |
|
|||
Hence, the accuracy of temperature determination can be improved by choosing two upper energy levels far apart from each other. The accuracy of the measured intensities is better for singlets. Because of these two reasons, it is convenient to compare the intensities at the two calcium wavelengths of λ1 = 422.7nm and λ2 = 585.7nm. According to Weast (1981), the corresponding parameters are
A1 |
= 2.18 ×10⁸ s−1, |
g1 |
= 3, |
E1 |
= 2.94eV, |
A2 |
= 0.66 ×10⁸ s−1, |
g2 |
= 5, |
E2 |
= 5.05eV. |
On average, the intensity ratio of the spectra shown in Figs. 3.51a–b is about I1/I2 4. Thus, the mean plasma temperature corresponding to these spectra is about 5eV or 60000K which is in good agreement with theoretical predictions by Mulser et al. (1973). This plasma temperature is not to be mistaken for the local tissue temperature, since it represents the kinetic energy of plasma electrons only.
In order to evaluate the free electron density of the plasma, the spectral widths of singlet lines need to be measured. These experiments were performed by Niemz (1994a) and yielded typical spectral widths of 0.15nm for the calcium line at 422.7nm as shown in Fig. 3.52. From these, the free electron density can be determined by applying Saha’s equation of plasma physics. The derivation and significance of Saha’s equation is discussed in detail by Griem (1964). Its physical interpretation is summarized in Fig. 3.53, where the spectral width at a given wavelength – in this case the calcium line at 422.7nm – is plotted as a function of electron density and plasma temperature. In the example shown, a measured spectral width of 0.15nm corresponds to a free electron density of approximately 1018/cm3. Moreover, Fig. 3.53 illustrates that the free electron density shows a rather weak dependence on plasma temperature.
3.4.3 Summary of Plasma-Induced Ablation
•Main idea: ablation by ionizing plasma formation
•Observations: very clean ablation, associated with audible
report and blueish plasma sparking
•Typical lasers: Nd:YAG, Nd:YLF, Ti:Sapphire
•Typical pulse durations: 100fs... 500ps
•Typical power densities: 1011 ... 1013 W/cm2
•Special applications: refractive corneal surgery, caries therapy
126 3. Interaction Mechanisms
3.5 Photodisruption
The physical e ects associated with optical breakdown are plasma formation and shock wave generation. If breakdown occurs inside soft tissues or fluids, cavitation and jet formation may additionally take place. The meaning of these terms will be discussed in this section. The ablative process due to plasma ionization has already been described in Sect. 3.4. However, when discussing plasma-induced ablation, we neglected any secondary e ects of the plasma. At higher pulse energies – and thus higher plasma energies – shock waves and other mechanical side e ects become more significant and might even determine the global e ect upon the tissue. Primarily, this is due to the fact that mechanical e ects scale linearly with the absorbed energy. Then, because of the mechanical impact, the term disruption (from Latin: ruptus = ruptured) is more appropriate.
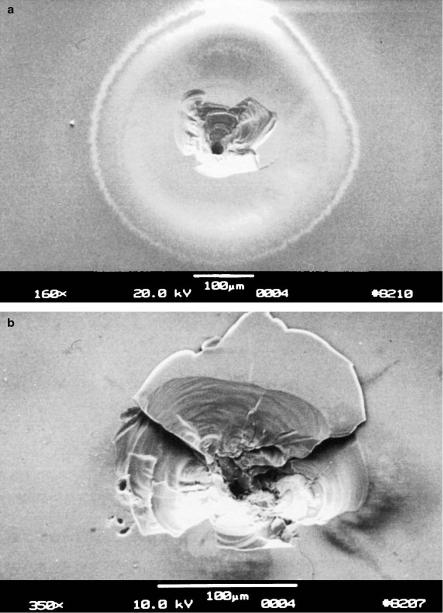
The e ect of rupturing becomes evident when looking at Figs. 3.54a–b. These two photographs show a 90μm thick glass plate on which picosecond pulses from a Nd:YLF laser were focused. Since glass is a simple detector for shocks – it splinters above a certain threshold value – the mechanical impact on the anterior and posterior surfaces are easily seen.
Cavitation is an e ect that occurs when focusing the laser beam not on the surface of a tissue but into the tissue. For instance, a cavitation within a human cornea is seen in Fig. 3.55. It was generated by focusing a single picosecond pulse from a Nd:YLF laser underneath the epithelium. Immediately after laser exposure, the tissue was fixated to prevent the cavitation bubble from collapsing. The cross-section of the cavitation is elongated on an axis determined by the orientation of the collagen fibrils, because shear forces can readily split the tissue in this direction. Cavitation bubbles consist of gaseous vapors – mainly water vapor and carbon oxides – which eventually di use again into the surrounding tissue.
Photodisruption has become a well-established tool of minimally invasive surgery (MIS), since it was introduced by Krasnov (1973) and then further investigated by Aron-Rosa et al. (1980) and Fankhauser et al. (1981). Two of the most important applications of photodisruptive interaction are posterior capsulotomy of the lens – frequently being necessary after cataract surgery – and laser-induced lithotripsy of urinary calculi.
During photodisruption, the tissue is split by mechanical forces. Whereas plasma-induced ablation is spatially confined to the breakdown region, shock wave and cavitation e ects propagate into adjacent tissue, thus limiting the localizability of the interaction zone. For pulse durations in the nanosecond range, the spatial extent of the mechanical e ects is already of the order of millimeters even at the very threshold of breakdown. Actually, purely plasmainduced ablation is not observed for nanosecond pulses, because the threshold energy density of optical breakdown is higher compared to picosecond pulses as shown in Fig. 3.45, and the pressure gradient scales with plasma energy. Hence, for nanosecond pulses, optical breakdown is always associated with
3.5 Photodisruption |
127 |
Fig. 3.54. (a) Anterior surface of a 90μm thick glass plate exposed to ten pulses from a Nd:YLF laser (pulse duration: 30ps, pulse energy: 1mJ, focal spot size: 30μm). (b) Posterior surface of a glass plate after a similar experiment. Reproduced from Niemz (1994a). c 1994 Springer-Verlag