

The Physics of Coronory Blood Flow - M. Zamir
.pdf370 10 Dynamic Pathologies
|
15 |
|
|
|
|
|
|
(mmHg) |
10 |
|
|
|
normal |
|
|
|
|
|
|
|
|
||
|
5 |
|
|
|
|
|
|
pressure |
|
0 |
|
|
|
|
|
|
|
|
|
|
|
|
|
oscillatory |
5 |
|
|
|
|
|
|
10 |
|
|
|
|
|
|
|
|
|
|
|
|
|
|
|
|
15 |
0 |
0.2 |
0.4 |
0.6 |
0.8 |
1 |
|
|
|
|
time t (normalized) |
|
|
|
|
15 |
|
|
|
|
|
15 |
|
|
|
|
|
||
(mmHg) |
10 |
|
|
|
vasoconstriction |
(mmHg) |
10 |
|
|
|
vasodilatation |
|
||
|
5 |
|
|
|
|
5 |
|
|
|
|
||||
|
|
|
|
|
|
|
|
|
|
|
|
|
||
pressure |
|
0 |
|
|
|
|
pressure |
|
0 |
|
|
|
|
|
oscillatory |
5 |
|
|
|
|
|
oscillatory |
5 |
|
|
|
|
|
|
|
10 |
|
|
|
|
|
|
10 |
|
|
|
|
|
|
|
15 |
0 |
0.2 |
0.4 |
0.6 |
0.8 |
1 |
15 |
0 |
0.2 |
0.4 |
0.6 |
0.8 |
1 |
|
|
|
|
time t (normalized) |
|
|
|
|
|
time t (normalized) |
|
|
||
Fig. 10.2.8. Propagation of the cardiac pressure wave along the 11-level tree model, the input waveform being shown in bold, while the thin curves indicate the changed form of the wave as it travels in that case. The three panels show the e ects of “vasoconstriction” and “vasodilatation”, as defined in the text, compared with the “normal” case as in Fig. 10.2.7, but here at a frequency of 10 Hz.
10.3Coronary Heart Disease, Physical Exercise, and the Conundrum of Coronary Flow Reserve
One of the characteristic features of the coronary circulation that distinguishes it from other circulations is its capacity to increase blood flow to the heart “on demand” by as much as five or six times normal flow rate, a feature generally referred to as “coronary flow reserve” [83, 42, 66, 64, 129, 128, 100, 183, 26, 112]. Elements of this subject were introduced earlier in Sections 1.8,9. In the present section we attempt to unify these elements into a useful whole and place the subject of coronary flow reserve in the context of coronary heart disease and physical exercise.
It was shown in Section 1.8 that coronary flow reserve is not provided by coronary arteries that are “oversized” compared with other arteries, or oversized in relation to the flow rate which they carry under normal conditions. It was shown in fact that the coronary arteries are of fairly normal caliber compared with arteries elsewhere in the body. It is widely accepted that coronary
10.3 Coronary Heart Disease, Physical Exercise, and Coronary Flow Reserve |
371 |
flow reserve is provided simply by an increase in the caliber of the so called “resistance vessels” within the coronary vascular tree, thus leading to a higher flow rate through the system [83, 42, 66, 64, 129, 128, 100, 183, 26, 112]. The conventional wisdom is that the fiveto six-fold increase in flow is achieved simply by decreasing the resistance to flow. While this wisdom is to a large extent correct, it is not entirely so because it is based on a model of the coronary circulation in which flow is assumed to be steady and flow rate is assumed to be determined entirely by resistance to flow.
Coronary blood flow, on the other hand, is pulsatile, and in pulsatile flow, as we have seen throughout this book, many more factors are involved in determining the flow rate through a vascular system. In particular, the e ects of capacitance, inductance, and wave reflections, as discussed in previous chapters, make it clear that the coronary circulation has more tools at its disposal for changing the flow rate than that of a simple change in pure resistance. An increase in the caliber of the so-called resistance vessels will indeed reduce resistance to the steady part of the flow, but as we have seen in previous sections it will also change the admittance to the pulsatile part of the flow, change the dynamics of wave reflections, reduce the elasticity of the vessels involved and hence increase the wave speed, all of which pointing to the number of variables that may be involved in the facility and function of coronary flow reserve. The concept of magic norms discussed in the previous section and the examples of vasoconstriction and vasodilatation discussed in that section make it clear that a change in one variable may lead to more than the e ect of that particular variable in isolation. What is ultimately important is whether a change in one variable will move the system away from its magic norm, and this, as we have seen, cannot be determined by considering that variable alone. This is clearly relevant when the change is introduced by clinical intervention.
While models of the coronary circulation have yet to grapple with the full intricacies of coronary flow reserve, enough is known to indicate clearly that this aspect of the coronary circulation has evolved to respond to increased demand for coronary blood flow resulting from increased physical activity, rather than to compensate for reduced coronary blood flow in coronary heart disease. As mentioned earlier, the di erence between the two situations is one of time scale. Coronary heart disease may reduce blood flow to the heart gradually over a period of months or years, while the increased demand for coronary blood flow following a sudden increase in physical activity may occur within seconds. In both cases the prevailing condition is a deficit in coronary blood flow, but in one case the deficit is small and chronic while in the other it is large and acute. Coronary flow reserve has evolved as a mechanism for dealing with acute deficits in coronary blood flow.
The only mechanism which seems to have evolved for dealing with chronic deficits in coronary blood flow is that of slow “restructuring” of the vasculature to deal with new conditions. Under this general heading may be included some angiogenic responses that are not specific to the heart, such as enlargement of existing vessels to carry higher flow rates, or the development of new
372 10 Dynamic Pathologies
vasculature. A response which is more specific to the heart is that of “collateral vasculature” discussed in Section 1.7. It has been adequately demonstrated that in the presence of coronary artery disease the coronary circulation responds by developing new routes for coronary blood flow [15, 14]. It is not clear, however, whether these new routes are based on pre-existing collateral vasculature or are the result of angiogenesis. It is also not clear to what extent this mechanism is e ective in dealing with chronic deficits in coronary blood flow since it has evidently not succeeded in preventing heart failures resulting from coronary heart disease [83, 206, 14, 128]. This and many other issues asociated with the e cacy and clinical significance of this mechanism are shrouded with a great deal of controversy. It is widely accepted, however, that the time scale of this mechanism is months or years, not seconds.
We thus have two mechanisms for dealing with coronary blood flow deficits which we shall refer to simply as “fast” and “slow”. In addition to the difference in their time scales, another important di erence between the two mechanisms is their triggers. It is widely accepted that the trigger for the fast mechanism is an increase in myocardial oxygen consumption. The trigger for the slow mechanism, on the other hand, is repeated episodes of hypoxia and ischemia [83, 128]. The interplay between these two mechanisms in coronary heart disease and in heart failure under di erent circumstances is discussed in what follows.
We note first that when heart failure results from coronary artery disease, the ultimate cause of the failure is that the heart is not receiving su cient blood supply for its own metabolic needs. It is thus a failure of the coronary circulation rather than a failure of the heart itself. In the analogy of a car engine, it is a failure of an engine that has run out of fuel rather than an engine that has broken down. While these statements seem to state the obvious, they bear repeating because the terminology used in this subject is somewhat misleading. Thus, what is widely referred to as “coronary heart disease” is a disease not of the heart but of the coronary arteries, and a more accurate term for it is “coronary artery disease”. And what is widely referred to as “heart failure” is a failure not of the heart but of su cient blood supply to reach the heart, and a more accurate term for it would be “heart starvation”.
From the point of view of energetics, normal operation of the heart as a pump is based on a very simple equation, whereby under steady state conditions
|
rate of oxygen consumption |
|
of oxygen delivery |
(10.3.1) |
by heart muscle |
= rateto heart muscle |
Coronary blood flow is associated with the right hand side of this equation. More precisely, oxygen delivery to the myocardium depends directly on the rate of coronary blood flow and on “oxygen extraction”, which is the percentage of oxygen being extracted from the blood by the heart muscle. While oxygen extraction may vary, under normal modes of operation the dominant factor in the delivery of oxygen to the heart muscle is the rate of coronary
10.3 Coronary Heart Disease, Physical Exercise, and Coronary Flow Reserve |
373 |
blood flow. To simplify matters, therefore, in what follows we shall consider coronary blood flow to be a direct measure of the rate of oxygen delivery to heart muscle.
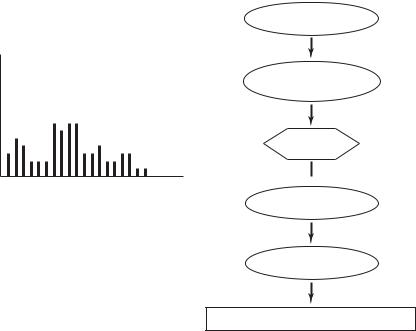
In what we shall call the “normal” course of events, if the energetics of the heart muscle are in a non-steady state, as, for example, when the level of physical activity of the body increases from rest to a higher level, work of the heart increases appropriately and the rate of oxygen consumption by the heart muscle increases with it. In response to the latter, coronary flow reserve is triggered within seconds to increase coronary blood flow and the rate of oxygen delivery to the heart muscle is thereby increased to a level that would satisfy Eq. 10.3.1. This sequence of events is shown schematically in the form of a flow chart in Fig. 10.3.1. This scenario may be repeated many times, at di erent levels of activity. If these levels are such that coronary flow reserve is always able to respond and satisfy the oxygen demands of the heart muscle then it is in this sense that we refer to this case as “normal”. This term is not intended to imply that the coronary arteries are necessarily free from disease or that the capacity of coronary flow reserve is intact. It only implies that coronary flow reserve is robust to the level of physical activity it is being subjected to.
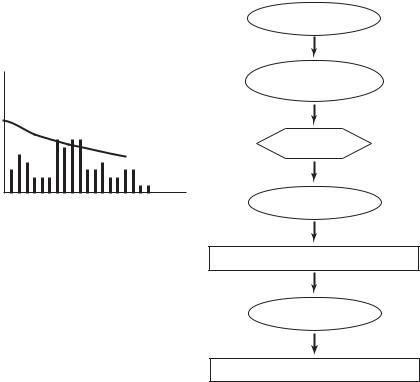
In what is generally referred to as “coronary heart disease”, because of coronary artery disease, the base rate of coronary blood flow has been reduced and the capacity of coronary flow reserve has been reduced. A situation may be reached whereby a certain level of physical activity can no longer be supported, and the only way to satisfy Eq. 10.3.1 is to reduce the level of physical activity to a level that can be supported by the impaired coronary flow reserve. This course of events is illustrated schematically in Fig. 10.3.2.
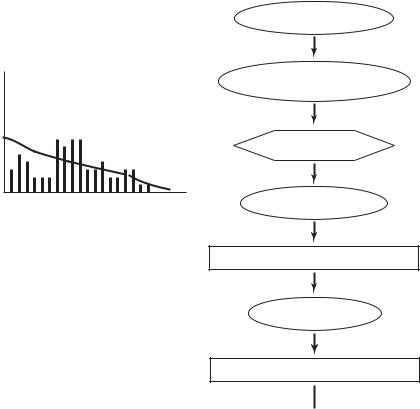
If the conditions of coronary heart disease continue unabated, the capacity of coronary flow reserve will deteriorate to the point where it can no longer augment coronary blood flow in any significant way. And since the base rate of coronary blood flow has also been considerably reduced by the disease, a point is reached where the oxygen demands of the heart muscle can no longer be met even when physical activity has been reduced to a minimum. The heart fails to function as a pump, as illustrated schematically in Fig. 10.3.3.
A course of events that is counter to that of coronary heart disease and heart failure is that of physical “exercise”. Here physical activity is taken deliberately to maximal levels so as to create hypoxia and momentary ischemia, and the scenario is repeated so as to presumably trigger the “slow” mechanism of dealing with coronary blood flow deficits, namely the mechanism of vascular restructuring [83, 128]. As mentioned earlier, this may include new angiogenic activity as well as the restructuring (enlarging) of existing normal and any collateral vessels. In the absence of coronary artery disease, this would act to maintain the capacity of coronary vasculature and of coronary flow reserve at su ciently high levels that they can deal with maximal demands for coronary blood flow, a state of so called cardiovascular “fitness”. In the presence of coronary artery disease, or ageing, the restructuring activity triggered by
374 10 Dynamic Pathologies
increased
physical activity
level of physical activity
increased myocardial oxygen consumption
coronary flow reserve
time  increased coronary
blood flow
increased oxygen delivery
"NORMAL"
oxygen delivery = oxygen consumption
Fig. 10.3.1. Flow chart illustrating schematically the sequence of events following an increase in physical activity, and the role of coronary flow reserve in that sequence under “normal” circumstances, by which is meant that coronary flow reserve is able to provide the necessary rate of coronary blood flow so that the balance of myocardial oxygen consumption and oxygen delivery is satified. The bar chart on the left illustrates, schematically again, the variable level of physical activity as time goes on. Under the “normal” scenario, coronary flow reserve is able to deal with these levels but it is not known if it can handle higher levels or if it is actually compensating for any decline in normal coronary blood flow due to coronary artery disease.
physical exercise may counter and possibly reverse the deteriorating capacity of coronary arteries and of coronary flow reserve, as illustrated schematically in Fig. 10.3.4.
The “bank analogy” mentioned briefly in Section 1.9 can be used to illustrate these scenarios in the context of a worker who earns $1,000 per month and, under normal circumstances, spends as much. Earnings are deposited directly into a “special” bank account and expenses are charged directly to the same account [217]. What is special about the account is that (a) it started out with a reserve of $6,000 and (b) no statements are issued about the balance in the account each month, unless the account is in deficit. Under normal circumstances the worker has no idea whether earnings and expenditures are in balance each month, because any small discrepancies are masked by the large reserve. If such discrepancies continue for a long time, however, a day will
10.3 Coronary Heart Disease, Physical Exercise, and Coronary Flow Reserve |
375 |
increased
physical activity
level of physical activity,
coronary flow reserve
increased myocardial oxygen consumption
reduced coronary flow reserve
"time" |
impaired coronary |
|
blood flow |
||
|
oxygen delivery < oxygen consumption
reduced
physical activity
"CORONARY HEART DISEASE"
oxygen delivery = oxygen consumption
Fig. 10.3.2. Flow chart illustrating schematically the sequence of events following an increase in physical activity, and the role of coronary flow reserve in that sequence under conditions of “coronary heart disease”. Normal coronary blood flow and the capacity of coronary flow reserve are both a ected negatively by the disease to the extent that a balance between myocardial oxygen consumption and oxygen delivery can only be reached by reducing physical activity. The bar chart on the left illustrates the variable level of physical activity as time goes on, while the dashed line represents the declining capacity of coronary flow reserve. The combination of the two on the time scale is clearly inaccurate because the time scale of variation in physical activity is widely di erent from the time scale of decline in coronary flow reserve. Nevertheless, it is useful to see the two together, though with the understanding that “time” is di erent in each case.
be reached when the worker will receive a statement from the bank declaring that his account is in deficit. The worker’s options at this time are limited because his reserve is now clearly exhausted. While in the presence of a healthy reserve any monthly discrepancies can be corrected by appropriate changes in spending habits, in the absence of such reserve such measures would be too slow and ine ective. Thus, while the reserve plays a very important role in the worker’s financial system, it also inadvertently masks monthly discrepancies which would serve as important warning signs to the worker before the

378 10 Dynamic Pathologies
10.4 Wave Propagation Through a Coronary Bypass
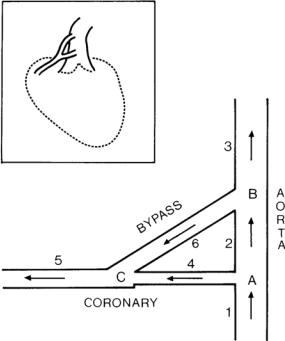
The placement of a vascular graft to bypass an obstruction in a coronary blood vessel is one of the most common surgical cardiovascular procedures in current practice [155, 142, 210, 166]. In its most common form it consists of creating an alternate route for blood flow from the aorta to a point downstream of an obstruction in a main coronary artery as illustrated schematically in Fig. 10.4.1
Fig. 10.4.1. Schematic representation of a coronary bypass graft arrangement (inset) and of model used for analysis. The model consists of six vessel segments identified by numbers 1 − 6 and three junctions identified by letters A-C. Segment 4 represents the diseased coronary artery and segment 6 represents the bypass graft, both having variable diameters, to simulate the severity of the disease in one case and the relative size of the graft in the other. From [1].
The clinical basis of coronary bypass procedures is fairly straightforward, namely that of providing coronary blood flow with a new supply route from the aorta. While this has a fairly sound fluid dynamic basis, its tenets lie strictly in the dynamics of steady flow in rigid tubes, thus ignoring the pulsatile nature of coronary blood flow and the elasticity of coronary arteries as well as that of the bypass graft. The dynamics of coronary blood flow, as we have seen, are those of wave propagation and wave reflections in elastic tubes, and the

10.4 Wave Propagation Through a Coronary Bypass |
379 |
Fig. 10.4.2. Pressure distribution in a coronary bypass graft, created by wave reflections when the Young’s modulus of elasticity of the graft is the same as that of the native coronary artery (curve labeled E6 = 1), when it is twice as large
(E6 = 2), and when it is 10 times as large (E6 = 10). A sti er graft produces a pressure di erence between the two ends of the graft that is more favorable to flow from the aorta to the coronary artery. From [1].
placement of a coronary bypass graft must correctly be viewed in this broader context.
More specifically, the placement of a graft should be viewed as not only creating a new path for coronary blood flow but also as introducing a new vascular impedance and two new vascular junctions which, as we have seen, can act as wave reflection sites [53, 54]. Thus, the length of the graft, its diameter, and its elasticity are all be important in this context. Analysis of wave propagation and wave reflections in the bypass graft configuration shown in Fig. 10.4.1, taking into account properties of the bypass graft and of the obstructed coronary artery, have been reported elsewhere [1]. We omit the analytical details here and present only a sample of the main findings.