

Micro-Nano Technology for Genomics and Proteomics BioMEMs - Ozkan
.pdf486 |
YAN MEI WANG, SHIRLEY S. CHAN AND ROBERT H. AUSTIN |
of the helix. A review of the basic idea of the bifurcated hydrogen bond can be found in [15]. As we will discuss later, this birfurcated hydrogen bond can be broken (“melt”) long before the double helix loses its integrity, as has been shown by a combination of circular dichroism, scanning calorimetry and Raman spectroscopy [9, 10].
The structural implications of these off diagonal interactions, so reminiscent of the Ising model in condensed matter physics, can be quite significant. In our case, we are concerned with the phenomena of bent DNA, which occurs when “A-tracts” consisting of 4 or more consecutive runs of A bases are phased with the 10 bp repeating pattern of the B-type double helix. A phased A-tract bends the helix of dsDNA into a circle of 50 Å radius at temperatures below 30 C. The bend occurs because there is a cross-linking hydrogen bond (the bifurcated hydrogen bond) that forms between neighboring An and Tn+1 bases, giving rise to a propellor twist to the plane of the basepairs. This twist gives rise to a coherent bend of the helix if the A tract is phased to the helix repeat [14].
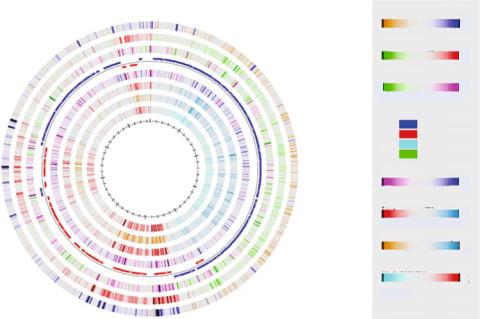
There are two main groups which have greatly extended the theoretical work we have described here. The Olson group at Rutgers University has for one of its goals understanding the influence of chemical architecture on the conformation, properties, and interactions of nucleic acids. They have made great progress in clarify the role of local structure induced by the primary base sequence and the binding of proteins on the overall folding of DNA and RNA [41, 42]. The work in this group in primarily theoretical and has combined a variety of computational approaches (Monte Carlo and molecular dynamics simulations, potential energy calculations, developments and applications of polymer chain statistics, finite element analysis, systematic molecular modeling) with new developments in polymer theory. Following up on this work, there is a group in Denmark, the Center for Biological Sequence Analysis at the Technical University of Denmark, which has turned the analysis of basepair sequence dependence of DNA structure and elasticity to a very formal level [29, 44]. They have used the rules that we have outlined in this review paper to analyze DNA sequences based upon the structural, positioning and dynamic information we have outlined in this paper. Genomic length sequences of DNA are presented in terms of the intrinsic curvature of DNA (phased A-tracts), stacking energies (as determined thermodynamically), and a set of parameters related to the variation in the elastic constants of the basepairs as discussed above. Figure 16.3 shows in graphic form how these parameters vary with sequence in the E. coli chromosome.
16.5. SOME EXPERIMENTAL CONSEQUENCES OF SEQUENCE DEPENDENT ELASTICITY
16.5.1. Phage 434 Binding Specificity and DNase I Cutting Rates
The realization that there is in fact a basepair dependence to many physical properties of DNA outlined above naturally leads to the question if biology is aware of and uses this phenomena? Probably the most direct indication of sequence dependence to the elasticity of DNA comes from relatively simple studies of basepair dependence of the binding constants of dimeric transcription factors which have a “non-contacted” region between the dimers. This non-contacted region is over distorted by either shearing (twisting) or bending strain. The binding of phage 434 repressor protein had been a subject of interest since the binding
488 |
YAN MEI WANG, SHIRLEY S. CHAN AND ROBERT H. AUSTIN |
spring constant is set by values for the basepair dependent modulii E and G. In practice that is an impossibly difficult task at present given our uncertainly with how the modulii do vary with basepair composition. A simple way to start is to assume that the basepair springs add serially that there are no long range interactions amongst the basepairs, which is assuredly wrong. In the case of no long range interactions, the rigidity of the total spring simply becomes the weighted average of the basepair composition, fx y , where faa corresponds to the fraction of basepairs where 2 A’s are next to each other, etc. The bending rigidity B and the torsional rigidity C of a length of duplex DNA of length L becomes:
C |
= IP |
Gaa |
+ Gag |
+ Ggg |
||||
1 |
|
L |
|
faa |
|
fag |
|
fgg |
1 |
= |
L |
|
faa |
+ |
fag |
+ |
fgg |
(16.18) |
B |
IA |
|
Eaa |
Eag |
Egg |
where IA is the surface moment of inertia of the object, IP the polar moment of inertia and Ex y and Gx y are the sequence specific Young’s and shear elastic constants discussed above.
We live on a rather cold planet, and it is surprising how little strain one needs to impose on a section of DNA before the elastic energy terms become similar in magnitude to kB T = 1/40 eV for T = 300 K. We can assume that if the 434 repressor has a fixed conformation which demands that a certain amount of strain energy U be invested in the bound complex. If the sequence denoted by n changes that binding energy by an amountU then the binding coefficient Kn will be decreased by the Boltzmann factor relative to the no strain case K0:
Kn = K0ex p[− U/ kB T ] |
(16.19) |
In the case of Ptashne’s work, the relative binding coefficients of different basepair sequences was measured by varying the non-contacted region sequences, so we instead calculate the ratio of binding coefficients for different sequences 1 and 2:
Kn |
= |
|
kB T |
|
||
log |
K0 |
|
|
|
U0 − Un |
(16.20) |
|
|
|
||||
Since, as we remarked above, we live on a cold planet it doesn’t take much strain for these factors to become significant and it is easiest to simply find the twist angle φ and bending radius R which can fit the observed binding coefficients and ask if they are reasonable. The following table is the analysis of the 434 repressor non-contacted sequences studied by Ptashne and his colleagues [45] in this elastic stain picture.
We have listed the sequences as enumerated by Ptashne et al., not in a logical sequence of effective binding constants. At the simplest level one can check to see if the strain model explains the data by simply looking for a linear correlation between the changes in the bending or the twisting elastic coefficients Bn − B0 or Cn − C0 with the log of the ratio of the measured binding constants log(Kn /K1). We plot in Figure 16.4 the results plottingC vs log(K0/Kn ).

490 |
|
YAN MEI WANG, SHIRLEY S. CHAN AND ROBERT H. AUSTIN |
||||
|
|
|
|
|
|
|
|
A |
|
|
|
|
|
|
|
|
|
|
|
|
|
|
|
|
|
|
|
|
|
|
Energy |
|
|
|
|
G-C |
|
||||
|
|
|
Strain |
|
|
|
|
|
|
|
|
|
|
|
|
|
|
|
|
|
A-T
|
-40 -30 -20 |
-10 |
-5° |
0 |
|
+10 +20 +30 |
+40 |
|||
|
|
|
|
|
0° |
|
|
|
|
|
|
|
|
|
|
|
|
|
|
||
|
|
|
|
|
|
|
||||
|
|
|
Bend Angle |
|
|
|
||||
B |
|
|
|
|
|
|
|
Cleavage |
||
|
|
Offset |
|
|||||||
|
|
|
|
|
||||||
Site
5'
3'
3'
5'
30 Å Radius
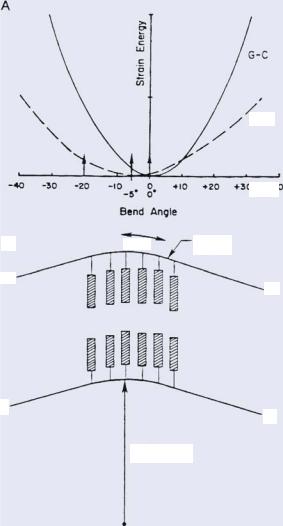
FIGURE 16.5. (A). Potential energy diagram for a bend sequence of DNA as a function of bend angle for a sequence which is completely random GC in composition or random AT. (B). The expected bend angle of 30◦ put into the double helix and the projected cutting site of DNase I. Taken from [27].
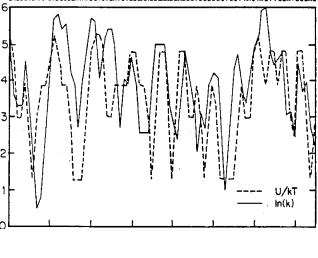
lab when they analyzed the cutting rates of the protein DNase I as a function of basepair sequence [27]. DNase I has cutting rates which vary over a range of 500 depending on the basepair sequence, and is known to bend DNA through an angle of about 30◦. The natural inclination is to again assume that variations in the elastic energy of deformation gives rise to changes in the binding constant and hence changes in the cutting rates due to simple aspects of residence times. Fig. 16.5 taken from [27] shows how this combination of bending of the DNA by the DNase I and the strain energy caused by this bending of the helix can with good accuracy fit the known DNase I cutting rates in Fig. 16.6.
SEQUENCE MATTERS: THE INFLUENCE OF BASEPAIR SEQUENCE |
491 |
|||||||||||||||
|
|
|
|
|
|
|
Sequence |
|
|
|
|
|
|
|
|
|
|
|
|
|
|
|
|
|
|
||||||||
|
|
|
|
CACCGTGAAAGTGCCCGATATGGTCTGATCTCGGAAGGGAAGCAGGGTCGGGCCTGGTTAGTACTTGGATGGGAG |
|
|
||||||||||
|
6 |
|
|
|||||||||||||
|
|
|
|
|
|
|
|
|
|
|
|
|
|
–1 |
|
|
|
|
|
|
|
|
|
|
|
|
|
|
|
|
|||
|
5 |
|
|
|
|
|
|
|
|
|
|
|
|
–2 |
|
|
|
4 |
|
|
|
|
|
|
|
|
|
|
|
|
–3 |
|
|
In(k) |
3 |
|
|
|
|
|
|
|
|
|
|
|
–4 |
U/kT |
||
|
2 |
|
|
|
|
|
|
|
|
|
|
|
|
–5 |
|
|
|
1 |
|
|
|
|
|
|
|
|
|
|
|
|
–6 |
|
|
|
|
|
|
|
|
|
|
|
|
U/kT |
|
|
|
|||
|
|
|
|
|
|
|
|
|
|
|
|
|
|
|||
|
|
|
|
|
|
|
|
|
|
|
|
|
|
|
|
|
|
|
|
|
|
|
|
|
|
|
ln(k) |
|
|
|
|
|
|
|
0 |
|
|
|
|
|
|
|
|
|
|
|
|
–7 |
|
|
|
|
|
|
|
|
|
|
|
|
|
|
|
|
|
|
|
|
|
15 |
25 |
35 |
45 |
55 |
65 |
75 |
85 |
|
|
|
|
|
||
|
|
|
|
|
|
|||||||||||
|
|
|
|
|
|
|
|
|
|
|
|
|
|
|
|
|
Position
FIGURE 16.6. The observed (solid line) and predicted (dashed line) of DNase I cutting rates for the sequence shown at the top of the Figure. Taken from [27].
16.5.2. Nucleosome Formation: Sequence and Temperature Dependence
The basic flexibility rules we have discussed above break down for A tracts because of the cross-coupling of the bifurcated hydrogen bond unique to A-tracts. These crossbonds can enhance the rigidity of the helix, at least at temperatures cold enough for the bonds to form. In fact, it has long been believed that poly(dA)poly(dT) duplex will not form nucleosome core particles [51] [48] [30]. However, it is now clear that poly(dA)·poly(dT) at temperatures below approximately 30◦C exists in a conformational isomer that is different from normal B-type helix [24] [8] [9]. Most nucleosome reconstitution experiments are done at temperatures well below 30◦C. It is logical to infer that if nucleosome reconstitution experiments are carried out at temperatures above the structural phase transition temperature of poly(dA)·poly(dT) that the homopolymer could in fact successfully reconstitute into nucleosomes.
There is evidence in the literature from three different groups of investigators using sequences containing large An tracts that it is possible to reconstitute nucleosomes at 37◦C using an exchange method from native donor nucleosome core particles [33] [47] [20]. It has also been found that poly(dA)·poly(dT) and kinetoplast DNA fragments with phased oligo-dA tracks have a unique temperature-dependent structure below the global melting point of the duplex [8]. The broad temperature range over which the structure changes can be monitored by circular dichroism spectroscopy [24] [8], gel mobility change [8], and transient optical techniques [8]. Chan et al. [9] measured the thermodynamic heat capacity change associated with this pre-global melting transition using a synthetic 45 base pair DNA with 4 phased tracts of (dA)5 showing that a true structural phase change occurs.
492 |
YAN MEI WANG, SHIRLEY S. CHAN AND ROBERT H. AUSTIN |
It seems plausible from the results discussed above that the unusual low temperature structure formed in An tracts could be responsible for the inability of the homopolymer to form nucleosomes, and that the temperature dependent structure of An tracts will be reflected in a similar temperature dependent nucleosome reconstitution profile.
16.5.2.1. Experimental Results of Nucleosome Reconstitution The fractionated homopolymer d(A)·d(T) and and alternating copolymer d(AT)·d(TA) fractions were prepared by a sonication process in order to make sufficiently short fragments (200 bp) to ensure mononucleosome formation. The sonication approach gives inherently a distribution of length fragments rather than a sharp monodispersed band like restriction DNA fragments. We have chosen three length fragments for the reconstitution experiments: 180±20 bp, 200±20 bp, and 250±30 bp. The reconstitution protocol is a modifcation of the procedure described in Ref. [37]. Poly(dA)·poly(dT) was purchased from Boehringer Mannheim, suspended in 10 X TE buffer (TE buffer is 10 mM Tris/HCl, 1 mM EDTA, pH 7.6), and incubated at 20◦C below the melting temperature of 70◦C to optimize duplex hybridization. The DNA was then sonicated for 15 min at 4◦C in order to break the polymers into shorter fragments. The resulting material was deproteinized with phenol, ethanol precipitated, resuspended in TE buffer, then length fractionated by a 1-meter Phamacia Sephacryl S500 column eluting with 50 mM Tris/HCl, 1 mM EDTA, pH 7.6. Aliqouts were taken to provide fractions, the mean length and width of each fraction was determined by electrophoresis on a 1.8% agarose gel. The fractionated samples were stored in 10 mM Tris, pH 7.5, 10 µM EDTA, at concentrations in the range of 0.25–0.45 mg/ml. 146 bp DNA was isolated from chicken erythrocyte core particles which had been digested by micrococcal nuclease to give DNA fragments with natural random sequences [35]. The 146 bp samples contained over 90% 146 bp fragments and the balance shorter fragments. The 146 bp sample was dissolved in 50 mM Tris, pH 8, 1 mM EDTA, at a concentration of 0.35 mg/ml. Histone octamers were isolated from H1-depleted chicken erythrocyte chromatin by hydroxyapatite dissociation method [2] and kept in 50 mM Tris, pH 8 and 2M NaCl at a concentration of 0.62 mg/ml.
The mono-nucleosomes were reconstituted by first mixing the octamer with DNA (calculated with 146 bp molar equivalent in concentration) at about 1.0:1.1 ratio and 1 M NaCl at 40, 24 and 4◦C. An aliquot of the same volume of buffer (50 mM Tris, pH 8, 1 mM EDTA) was added to the sample in 4 steps every 1–2 Hr, to dilute the NaCl concentration down to 0.6 M. Then, 10–15 µl of sterilized mineral oil was added only to the top layer of the 40◦C sample to prevent vaporization within the tube. Each sample was kept at 0.6 M NaCl and its corresponding temperature over night. The last volume of buffer which diluted NaCl to 0.1 M was pre-equilibrated at each temperature before adding to the sample. The final volume of each sample was about 50 to 70 µl. After at least one hour of incubation time, the samples and controls were analyzed by 5% polyacrylamide gels (1.5 mm thick, 14 cm long, 2–3 Hr of run time at 120–140 Volt DC) in TBE buffer, pre-equilibrated at 40, 24 and/or 4◦C. The temperature of the gels during the runs could heat up by about 2 or 3◦C. The gels were soaked in 0.2 µg/ml ethidium bromide solutions for 30 min after electrophoresis and the UV excited fluorescence was recorded on Polaroid instant films and negatives.
The results of these reconstitution experiments support the idea that at physiological temperatures poly(dA)·poly(dT) does indeed change its flexibility. The results are shown in Fig. 16.7. We summarize the results here. Experiments were done at three different

SEQUENCE MATTERS: THE INFLUENCE OF BASEPAIR SEQUENCE |
493 |
FIGURE 16.7. Gel analysis of nucleosome reconsitution experiments. Lane A for each temperature is the 200 bp poly(dA)·poly(dT) sample in the absence of histones, and lane B is the 200 bp poly(dA)·poly(dT), under the incubation conditions outlined in the text.
temperatures: 4◦C, 24◦C and 40◦C. Although the disproportionation of duplex into triplex is a possibility at the high salt concentrations used in the reconstitution procedure, the maximum temperature of the reconstitution procedure (40◦C) is well below the melting point of either duplex (dA)·(dT) or triplex (dT)·(dA)·(dT) [43] and so the duplex will be stable during the reconstitution procedure.
The gel results shown clearly show that poly(dA)·poly(dT) does not reconstitute to form nucleosomes at 4◦C, but an increasing fraction of reconstituted nucleosomes is seen at 24◦C and 40◦C. Control experiments with chicken erythrocyte fragments show approximately constant reconstitution at all three temperatures (data not shown). Interestingly, we also found that the observed reconstitution efficiency depended strongly on the temperature of gel used to assay for reconstitution: the 40◦C incubated poly(dA)·poly(dT) reconstitution experiment analyzed by a 4◦ C gel run showed substantially less reconstitution than the 40◦C run gel, indicating that the low temperature DNA phase can reform even in the nucleosome and result in unfolding of previously reconstituted nucleosomes.
There are several ramifications to this work over and above the fact that poly(dA)·poly(dT) can in fact reconstitute into nucleosomes if reconstitution is done at temperatures above the structural phase transition temperature of the homopolymer. Most importantly, we note that the structural transition temperature of poly(dA)·poly(dT) is approximately 35◦C, and this implies that An tract structural changes can have an important, variable impact on chromatin structural integrity at physiological conditions. The fact that reconstituted (dA)·(dT) nucleosomes unfold when cooled emphasizes this point.
494 |
YAN MEI WANG, SHIRLEY S. CHAN AND ROBERT H. AUSTIN |
CONCLUSIONS
The field of sequence-depend properties of DNA elasticity has been slow to develop. In spite of some fairly convincing early experiments indicating that sequence matters not only in the Watson-Crick basepair sense but also in terms of modulating the structure and flexibility of the double helix, doubts cast on the subject seemed to stop work in this area. However, as more and more structures of protein-DNA complexes are solved, it has become clear that very the double helix is physically distorted by binding of proteins, giving rise to a significant elastic energy term to the free energy of DNA-protein interactions. As a consequence of this, there has arisen a significant theoretical effort to compute in very general terms how these base-pair sequence effects, at many different levels of neighboring interactions and phased nature of position in the helix, can influence the interaction between proteins that distort the double helix and their binding constants. Further, it became clear that sequence matters not only in elastic properties but also in static conformations as long as the basepair sequences were phased to the helix repeat.
Many questions still remain unanswered; for example, it would be fascinating to observe DNA bending (protein induced or intrinsic) directly using single molecule fluorescent techniques, such as fluorescence resonance energy transfer technique [52]. Now with the availability of optical 1.5-nm localization ability [50], it should be interesting to examine bent protein-DNA complex using fluorescent-fusion-protein and DNA dye. As the ability to confine the DNA in nanostructures, we will be able to add an additional strain to the DNA molecule which will compete with the induced strain by binding of proteins, and we will be able to understand at a deeper level how the basepair sequence dependent rigidity of the double helix influences the way that proteins interact with the helix.
This work was supported by grants from DARPA (MDA972-00-1-0031), NIH (HG01506), NSF Nanobiology Technology Center (BSCECS9876771, the State of New Jersey (NJCST 99-100-082-2042-007) and US Genomics.
REFERENCES
[1]J.E. Anderson, M. Ptashne, and S.C. Harrison. Structure of the repressor-operator complex of bacteriophage 434. Nature, 326:846, 1987.
[2]K.S. Bloom and J.N. Anderson. Fractionation and characterization of chromosomal proteins by the hydroxyapatite dissociation method. J. Biol. Chem., 253:4446, 1978.
[3]V.A. Bloomfield, D.M. Crothers, and I. Tinoco. Nucleic Acids: Structure, Properties, and Functions: J. Stiefel (ed.), University Science Books, Sausalito, CA, 2000.
[4]K.J. Breslauer, R. Frank, H. Blocker, and L.A. Marky. Predicting DNA Duplex Stability from the Base Sequence. Proceedings of the National Academy of Sciences of the United States of America. Vol. 83, p. 3746, 1986.
[5]C.R. Calladine and H.R. Drew. Principles of Sequence-Dependent Flexure of DNA. J. Mol. Biol., 192:907, 1986.
[6]Cao Han, Yua Zhaoning, Wang Jian, Chen Erli, Wua Wei, O. Jonas Tegenfeldt, H. Robert Austin, and Y. Stephen Chou. Fabrication of 10 nm enclosed nanofluidic channels. Appl. Phys. Lett., 81:174, 2002.
[7]Cao Han, O. Jonas Tegenfeldt, H. Robert Austin, and Y. Stephen Chou. Gradient nanostructures for interfacing microfluidics and nanofluidics. Appl. Phys. Lett., 81:3058, 2002.
[8]S.S. Chan, K.J. Breslauer, M.E. Hogan, D.J. Kessler, R.H. Austin, J. Ojemann, J.M. Passner, and N.C. Wiles. Physical studies of DNA premelting equilibria in duplexes with and without homo dA·dT Tracts: correlations with DNA binding. Biochemistry, 29:6161, 1990.
SEQUENCE MATTERS: THE INFLUENCE OF BASEPAIR SEQUENCE |
495 |
[9]S.S. Chan, K.J. Breslauer, R.H. Austin, and M.E. Hogan. Thermodynamics and premelting conformational changes of phased (dA)5 tracts. Biochemistry, 32:11776, 1993.
[10]S.S. Chan, R.H. Austin, I. Mukerji, and T.G. Spiro. Temperature-dependent ultraviolet resonance Raman spectroscopy of the premelting state of dA center dot dT DNA. Biophys. J., 72:1512, 1997.
[11]S.Y. Chou and P.R. Krauss. Imprint lithography with sub-10 nm feature size and high throughput. Microelect. Eng., 35:237, 1997.
[12]CRC Handbook of Chemistry and Physics, 84th Edn., CRC Press, Boca Raton, FL, USA.
[13]N.R. Cozarelli, T. Boles, and J. White. Topology and its Biological Effects. Cold Spring Harbor, 1990.
[14]D.M. Crothers, T.E. Haran, and J.G. Nadeau. Intrinsically Bent DNA. J. Biol. Chem., 265:7093, 1990.
[15]R.E. Dickerson and T.K. Chiu. Helix bending as a factor in protein/DNA recognition. Biopolymers, 44:361, 1997.
[16]R.E. Dickerson. Definitions and nomenclature of nucleic acid structure parameters. Euro. Mol. Biol. J., 8:1, 1989.
[17]R.E. Dickerson. DNA bending: the prevalence of kinkiness and the virtues of normality. Nuc. Acids Res., 265:1906, 1998.
[18]S. Diekmann. Definitions and nomenclature of nucleic acid structure parameters. J. Mol. Biol., 205:787, 1989.
[19]M. Doi and S.F. Edwards. Theory of Polymer Dynamics, Academic Press, NY, 1977.
[20]K.R. Fox. Wrapping of genomic polydA·polydT tracts around nucleosome core particles. Nuc. Acids Res., 20:1235, 1992.
[21]B.S. Fujimoto and J.M. Schurr. Dependence of the torsional rigidity of DNA on base composition. Nature, 344:175, 1990.
[22]R.E. Goldstein, T.R. Powers, and C.H. Wiggins. Viscous nonlinear dynamics of twist and writhe. Phys. Rev. Lett., 80:5232, 1998.
[23]P.J. Hagerman. Flexibility of DNA. Ann. Rev. Biophys. Biophys. Chem., 17:265, 1988.
[24]J.E. Herrera and J.B. Chaires. A premelting conformational transition in Poly(dA)-Poly(dT) coupled to daunomycin binding. Biochemistry, 26:1993, 1989.
[25]H. Hogan, J. LeGrange, and B. Austin. Dependence of DNA helix flexibility on base composition. Nature, 304:752, 1983.
[26]M.E. Hogan and R.H. Austin. Importance of DNA stiffness in protein-DNA binding specificity. Nature, 329:263, 1987.
[27]M.E. Hogan, M.W. Roberson and R.H. Austin. DNA flexibility variation may dominate DNase I cleavage.
Proc. Natl. Acad. Sci. U.S.A., 86:9273, 1989.
[28]F. Jacob and J. Monod. Genetic regulatory mechanisms in synthesis of proteins. J. Mol. Biol., 3:318, 1961.
[29]L.J. Jensen, C. Friis, and D.W. Ussery. Three views of microbial genomes. Res. Microbiol., 150:773, 1999.
[30]G.R. Kunkel and H.G. Martinson. Nucleosomes will not form on double-stranded RNA or over Poly(dA)·poly(dT) tracts in recombinant DNA. Nucleic Acids Res., 6:6869, 1981.
[31]M. Lewis et al. Crystal structure of the lactose operon repressor and its complexes with DNA and inducer. Science, 271:1247, 1996.
[32]E.M. Lifshitz, L.D.L. Theory of Elasticity, Pergamon Press, New York NY, 1981.
[33]R. Losa, S. Omari, and F. Thoma. Poly(dA)·poly(dT) rich sequences are not sufficient to exclude nucleosome formation in a constitutive yeast promoter. Nucleic Acids Res., 18:3495, 1990.
[34]N. Luscombe, S.E. Austin, H.M. Berman, and J.M. Thornton. An overview of the structures of protein-DNA complexes. Gen. Biol. 1, 1 (2000).
[35]L.C. Lutter. Kinetic analysis of deoxyribonuclease I cleavages in the nucleosome core: evidence for a DNA superhelix. J. Mol. Biol., 124: 391, 1978.
[36]N.L. Marky and G.S. Manning. Biopolymers, 31:1557, 1991.
[37]K.W. Marvin, P. Yau, and E.M. Bradbury. Isolation and characterization of acetylated histones H3 and H4 and their assembly into nucleosomes. J. Biol. Chem., 265:19839, 1990.
[38]K. McAteer and M.A. Kennedy. NMR evidence for base dynamics at all TpA steps in DNA. J. Biomol. Struct. Dyn., 17:1001, 2000.
[39]K. Nadassy, I. Tomás-Oliveira, I. Alberts, J. Janin, and S.J. Wodak. Standard atomic volumes in doublestranded DNA and packing in protein–DNA interfaces. Nucleic Acids Res., 29:3362–3376, 2001.
[40]T.M. Okonogi et al. Sequence-dependent dynamics of duplex DNA: the applicability of a dinucleotide model. Biophys. J., 83:3446, 2002.