

Micro-Nano Technology for Genomics and Proteomics BioMEMs - Ozkan
.pdf364 |
JIM V. ZOVAL AND M.J. MADOU |
[37]L. Bocquet, W. Losert, D, Schalk, T.C. Lubensky, and J.P. Gollub. Granular shear flow dynamics and forces: experiment and continuum theory, Physical Review E (65), 011307–1.
[38]K.J. Ruschak and L.E. Scriven, Rimming flow of liquid in a rotating horizontal cylinder, Fluid Mech., 76:113–127, 1976.
[39]S.T. Thoroddsen and L. Mahadevan. Experimental Study of coating flows in a partially-filled horizontally rotating cylinder, Exper. Fluids, 23:1–13, 1997.
[40]R.A. Bagnold. Experiments on a gravity-free dispersion of large solid spheres in a Newtonian fluid under shear,” Proceedings of the Royal Society of London. Series A, Mathematical and Physical Sciences, 225(1160):49–63, 1954.
[41]Cliff K. K. Lun, Granular dynamics of inelastic spheres in Couette flow, Phys. Fluids, 8(11), 1996.
[42]S.F. Foerster, M.Y. Louge, H. Chang, and K. Allia. Measurements of the collision properties of small spheres,
Phy. Fluids 6(3), 1994.
[43]G.K. Batchelor. A new theory of the instability of a uniform fluidized bed, J. Fluid Mech., 193:75–110, 1988.
[44]R. Zenit, M.L. Hunt, and C.E. Brennen. “Collisional particle pressure measurements in solid-liquid flows, Fluid Mech. 353:261–283, 1997.
[45]S.A. Morsi and A.J. Alexander. An investigation of particle trajectories in two-phase flow systems, Fluid Mech., 55(2):193–208, 1972.
[46]J. Kirchner J, S.B. Sandmeyer, and D.B. Forrest. Transposition of a Ty3 GAG3-POL3 fusion mutant is limited by availability of capsid protein, Virol., 66(10):6081–92, 1992.
[47]R. Barathur, J. Bookout, S. Sreevatsan, J. Gordon, M. Werner, G. Thor, and M. Worthington. New disc-based technologies for diagnostic and research applications, Psychiat. Geneti., (12)4:193–206, 2002.
[48]I. Alexandre, Y.Houbion, J. Collet, S. Hamels, J. Demarteau, J.-L. Gala, and J. Remacle. Compact disc with both numeric and genomic information as DNA microarray platform, BioTechniques, (33)2:435, 2002.
366 |
LEE ROWEN |
and the integration of cost-effective procedures into a high-throughput and streamlined system has already been achieved. When the project began in 1990, however, the most costeffective paths to a finished sequence of the human genome were unclear and remained to be determined.
The following historical perspective on how the human genome got sequenced is “internal,” meaning that it is written from a participant’s point of view. As the coordinator of a mid-sized genome center, the author personally experienced many of the developments that occurred during the course of the human genome project from 1990 to 2003. Like any good story now passing into legend, there are different ways to tell the tale, and there may not be universal agreement on what really happened in terms of facts and rationales for decisions. As for heroes and villains, it is this author’s charitable belief that the many characters engaged in the sequencing of the human genome were doing the best they could as they navigated the technological and political twists and turns of the undertaking. The story’s ultimate moral is that the genome project embodies a triumph of the human spirit along with a testimony to technological ingenuity and persistence.
In order to provide background for a subsequent discussion of the issues faced by the International Consortium, this review begins with a generic description of the approach used to sequence the human genome. A discussion of specific challenges for systems integration follows, using examples from various phases of the effort. Finally, a brief retrospective consideration of lessons learned that might be applicable to other large-scale technology development endeavors is offered.
11.2. APPROACHES USED TO SEQUENCE THE HUMAN GENOME
11.2.1. Overview
Looking at the big picture, the overarching design for sequencing the human genome entailed dividing individual donors’ genomic DNA (genomes) into manageable pieces (cloned genomic inserts; source clones), determining the sequences of the pieces (sequence reads; contigs; source clone sequences), and then reconstructing the sequence of an entire representative human genome from the sequences of overlapping pieces (overlapping source clone sequences), creating at the end one master sequence for each of the 24 chromosomes (Figure 11.1). The International Consortium used a hierarchical sequencing strategy whereby the genome was fragmented into source clones around 150 kilobases (kb) in size which were sequenced using a set of procedures to be described below [23]. The privately funded genome project led by Celera Genomics fragmented the genome into smaller 2 kb, 10 kb, and 50 kb cloned inserts and the overall sequence was assembled from sequence reads derived from the two ends of the cloned inserts using a “whole genome shotgun” approach [48]. For reasons of space, this review primarily covers the strategies used by the publicly funded human genome project.
In the hierarchical approach, the acquisition of sequence data encompassed four major processes:
mapping–determining the chromosomal location of source clones;
sequencing–obtaining raw sequence data for source clones;
368 |
LEE ROWEN |
While the substrate for mapping and sequencing was a source clone (to be described further below), assembly and finishing pertained both to source clones, that is, to small 150 kb pieces of the genome, and to chromosomes, whose sequences were constructed by the merging of overlapping source clone sequences (Figure 11.1).
Systems integration pertains to the overall coordination of the mapping, sequencing, assembling and finishing of the genome, to the organization of the component steps for each of these processes, and to the various quality controls, validation procedures, and feedback mechanisms that ensured accuracy in the final product. In the initial stages of the project (1990–1996), systems integration focussed primarily on procedures for sequencing source clones, with an effort to maximize efficiency and throughput. Here, the “pipeline” analogy prevailed. The idea is that fluid flows smoothly from point A to point B when things are working properly and leaks, blockages, backflows or diversions disrupt the flow and, therefore, must be anticipated, attended to or prevented. In the later stages (2000–2003), the focus shifted to finishing a representative sequence for each human chromosome. The systems integration analogy at work in building chromosome sequences out of source clone sequences was more like conducting a symphony orchestra. Immense coordination and cooperation among the sequence centers was required to turn cacophony into glorious music.
11.2.2. Strategy Used for Sequencing Source Clones
Figure 11.2 summarizes the four major processes through which samples pertaining to source clones “flowed” in the genome sequencing “pipeline.” The samples are of three types: biological/chemical materials (clones, DNA templates, sequencing reactions), images (fingerprint patterns, dye peaks) and words (strings of A,G,C,T representing DNA sequences). These three data types challenged prevailing procedures for acquiring, storing, accessing, analyzing and sharing data throughout the course of the human genome project. Because of the scale involved, integrating the various processes of data acquisition put significant pressure on the laboratory information management systems in place at each genome center.
11.2.2.1. Mapping (Source Clone Acquisition) In terms of source material for sequencing, the starting point for the publicly funded genome centers was not the genome-as- a-whole, as with the Celera effort, but rather pieces of representative genomes embedded in large-insert cloning vectors that enable propagation of the cloned insert in the bacterium Escherichia coli. Use of cloning vectors was required for the physical isolation of pieces of chromosomal DNA in a quantity sufficient for sequencing. Prior to 1995, cosmid vectors, which hold an average insert size of about 40 kilobases (kb), were typically used. After 1995, cosmids were replaced by PACs (P1 artificial chromosomes), which hold inserts around 80 kb [24], and then BACs (bacterial artificial chromosomes), which hold inserts up to about 250 kb [36, 43]. Given a human genome size of 3 gigabases, it would require 20,000 BAC clones with an average insert size of 150 kb to cover the entire genome once if they were laid end-to-end. Since genomic inserts are generated by semi-random processes, ensuring adequate clone coverage of the entire genome required the construction of clone libraries containing several “genome equivalents” of DNA inserts [8]. These clone libraries consisted of several hundred 384-well plates of frozen bacterial cultures from which any
SEQUENCING THE HUMAN GENOME |
369 |
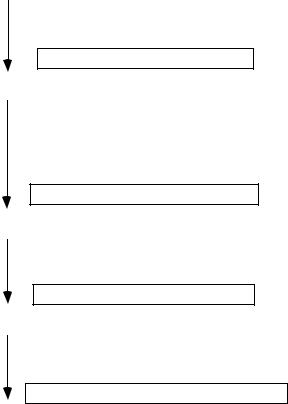
Genome Sequencing Pipeline
Mapping
Genetic marker identification
Source clone library screening
Fingerprinting and/or End sequencing
Fluorescence in situ hybridization (used for validation)
Sequence-ready large-insert source clone
Sequencing
DNA extraction from source clone
Shotgun library construction
DNA template preparation
Sequencing reactions
Machine loading and detection
Base-calling
Sequence reads derived from clone fragments
Assembly
Pairwise alignments
Determining best overlaps
Building contigs
Contiguous stretches of sequence ("contigs")
Finishing
Gap-filling
Resolution of low-quality regions
Validation
Complete and accurate sequence of the source clone
FIGURE 11.2. Processing of samples through the genome sequencing pipeline. Each box represents the output of an overall process (arrow) that entailed several steps (see text).
individual large-insert clone could be propagated, once its clone ID and plate address were determined.
Retrieving sequence-ready clones from a clone library was easy: one could buy a copy of the library for several thousand dollars or order individual clones from a distributor. Figuring out which clones to retrieve, however, was non-trivial. During the mid-90s, genome centers claimed entire chromosomes or portions of chromosomes for their sequencing targets. Regional sequencing required centers to identify large-insert clones containing genomic DNA from their chosen territory and not some other center’s real estate: thus a need for physical mapping. In physical mapping, information is obtained from the DNA insert of a source clone that allows inferences to be made about chromosomal location.
The major strategies employed for mapping source clones prior to sequencing include:
Library screening: Genetic markers, which are short stretches of sequence known to map to a specific chromosomal position, are used to make probes for finding matching
370 |
LEE ROWEN |
sequences among the human genomic inserts in the clone library. This is done by hybridizing the probe to filters onto which a tiny amount of DNA from each of the clones in the library has been spotted in a known location. Matches between the probe and the filter are detected as small black circles on a film. From the position of the “positive” clones, the library addresses are “read” from the film using a location schema provided by the library manufacturer. Clone candidates are then retrieved from the library and retested with the probe to ensure that the genetic marker of interest is present. The overall screening process starting from probe design and ending with clone validation generally required at least a couple of weeks. Screens could be multiplexed (i.e., several probes combined into one hybridization) and the positive clones sorted into clusters at the validation stage.
Restriction digest fingerprinting: Restriction enzymes (enzymes that cut DNA whenever they encounter a specific short recognition sequence such as AAGCTT) are used to generate “fingerprints.” Fingerprints are distinctive patterns of DNA fragment sizes that reflect the frequency of the enzyme’s recognition sequence in the region of interest. After restriction enzyme digestion of the DNA of a source clone, the fragments are separated according to size using agarose gel electrophoresis. Overlap between clones is inferred from a subset of shared fragment sizes. While this approach in and of itself does not point to chromosome location, it is used to determine the order of clones in a cluster—if any one clone in an ordered cluster is positioned on a chromosome, then the chromosomal position of the whole cluster is known.
Clone insert end sequencing: Obtaining short sequence reads ( 500 bases) from each of the two vector-insert joints of a clone, and looking for sequence matches with already-sequenced clones or known markers. End sequence matches allow more precise positioning of overlapping clones, so long as one of the clones has already been sequenced.
Fluorescence in situ hybridization (FISH): Labeling a large-insert clone with dye and hybridizing it to a metaphase chromosome spread and seeing which chromosomal band lights up under a microscope. This method was used primarily for validating a chromosomal location inferred from other mapping procedures [2]. The procedure is slow and requires a skilled technician to interpret the results.
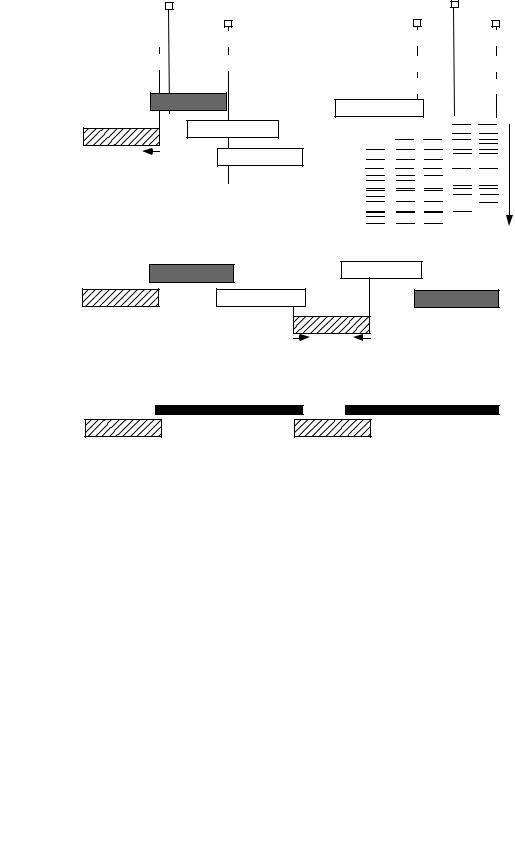
Most genome centers or their mapping collaborators initially employed some variation of the following mapping strategy (Figure 11.3). After performing a round of library screening and identifying a cluster of clones containing a genetic marker of interest, one of the clones, called a “seed,” would be sequenced. From unique sequence at the ends of the seed clone insert, new probes for screening were designed for the purpose of procuring a new batch of clones that would overlap the seed clone. Because the average distance between mapped genetic markers was greater than the average length of the clone insert, multiple probes were necessary for obtaining contiguous clone coverage of a megabase-sized region. Long stretches of overlapping clones and clone sequences were thereby obtained through an iterative screen-sequence-screen-sequence approach. Local fingerprinting and end sequencing were used to make the ordering of the clones in a cluster or region precise. In order to generate a steady supply of mapped clones for sequencing, multiple library screenings had to be done in parallel.
372 |
LEE ROWEN |
be identified by searching the genome sequence sampling database in GenBank for unique matches to BAC ends. In an independent effort, Washington University at St. Louis built a mapping resource by fingerprinting thousands of BACs from the same two libraries [22, 27]. When large numbers of fingerprinted BACs became available in 1999–2000, clones could be clustered by fragment patterns, and their approximate order within the cluster inferred. Because the method is imprecise, a highly redundant supply of fingerprinted clones was required for distinguishing true from spurious overlaps.
Use of a combination of mapping procedures enabled genome centers to construct “tiling paths,” that is, ordered arrays of clones containing inserts from overlapping portions of the genome (Figure 11.3). From these tiling paths, long stretches of chromosomal sequence were reconstructed by merging the sequences of overlapping clones in the tiling path.
Even though mapping procedures were slow, labor-intensive, and tedious, they usually worked. Some problems did on occasion occur:
The genetic marker used for a library screen turned out to map to the wrong chromosome or to more than one chromosome. This problem could be detected by genome centers fortunate enough to have in-house FISH capacity.
Library screens, or searches of the centralized mapping resources, yielded no positive clones, thereby leaving gaps in the chromosomal tiling path.
Mapping data based on fingerprints and end sequences gave conflicting results, meaning that the region of interest in the genome was duplicated, or was significantly different among individuals due to polymorphic variations.
Resolution, or attempts at resolution, of these problems generally occurred late in the game for the genome project, i.e., after year 2000.
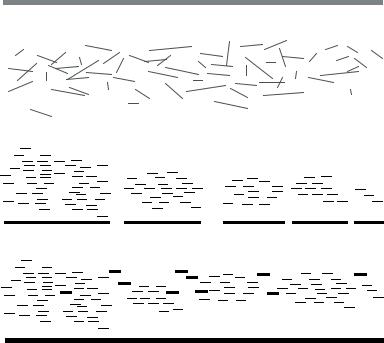
11.2.2.2. Sequencing (Accumulation of Sequence Reads) As will be discussed later in this review, there were heated debates in the early ‘90s over sequencing strategies, yet by about 1995, the approach called “shotgun sequencing” [10] had become widely accepted. As the size of clonable genomic inserts increased (e.g., from 35 kb cosmids to 150 kb BACs), the ratio between obtainable sequence read length (only about 400 to 1000 bases) and clone insert length decreased, meaning that large numbers of overlapping sequence reads were required to reconstruct a contiguous and accurate sequence of a source clone. In shotgun sequencing, a source clone is fragmented such that positional information of the fragments is lost, and only regained after assembly of the sequence reads generated from the subcloned fragments (Figure 11.4). The “shotgun” analogy is that prior to assembly, sequence reads splatter across a virtual consensus sequence of the source clone. Randomly generated fragments sufficient to cover the source clone many times over must be sequenced in order to ensure adequate coverage from the overlapping reads (redundancy).
Most genome centers used variations of the following generic procedures for generating the shotgun sequence reads from a source clone [39].
Source clone DNA preparation: Preparing DNA from mapped cosmid, PAC, or BAC clones with a minimal amount of contaminating E. coli chromosomal DNA.
Fragmentation: Randomly shearing the source clone DNA into short fragments using sonication, nebulization, or mechanical shearing by passage through a needle at high pressure.
SEQUENCING THE HUMAN GENOME |
373 |
source clone insert (~150 kb)
short randomly generated subcloned fragments (~1.5-4 kb)
assembled sequence reads (contigs and gaps)
reads
contigs
assembled finishing reads
high quality consensus sequence (148,753 bases)
FIGURE 11.4. Strategy for shotgun sequencing. A source clone is fragmented, and the fragments of an optimal size range are subcloned into a phage or plasmid vector. After preparation of DNA from the subclones, 500 base sequence reads are generated from one or both ends of the insert, and assembled using pairwise alignments to generate contigs. Gaps between contigs and low quality regions are resolved by obtaining additional sequence (finishing reads), after which a high quality consensus sequence for the source clone is determined from the best set of reads.
Size selection: Purifying fragments of an optimal size range (usually 1.5–4 kb) suitable for subcloning and sequencing.
Subcloning: Ligating fragments into viral (phage M13) vector or a plasmid (typically pUC18) vector, and transforming the ligation mixture into E coli to generate single recombinant plaques or colonies, each harboring a subclone containing a fragment of the source clone.
Template DNA preparation: Isolating the recombinant plasmid or viral DNA from a single plaque or colony culture of E. coli.
Sequencing: Performing sequencing reactions on the purified template DNA using premixes of primer (required for DNA replication), deoxynucleoside triphosphate (dNTP) substrates (DNA building blocks), dideoxynucleoside triphosphate substrates (ddNTPs) to terminate DNA replication at random locations, buffers, and a suitable DNA polymerase [42]. Primers are designed to be complementary to a portion of the cloning vector sequence several bases short of the vector-insert joint, so that the same