

Micro-Nano Technology for Genomics and Proteomics BioMEMs - Ozkan
.pdf314 |
Z. HUGH FAN AND ANTONIO J. RICCO |
migration toward the cathode and are detected at one end of the channel or capillary. A generic electropherogram is shown in Figure 9.1c, in which cations migrate first to the detector, and then neutral molecules, with anions last. This pattern results from the fact that cations experience both electrophoretic and electroosmotic movement in the same direction, while anions experience them in opposite directions, and neutral molecules experience only electroosmosis.
9.3. PLASTIC DEVICES
Although much of the work on microfluidic devices in the 1990’s utilized glass or silicon substrates, plastics have been increasingly studied in the past few years. The plastic materials investigated for microfabrication and microfluidics include polystyrene [51], polymethylmethacrylate (PMMA) [42, 49, 69], polycarbonate [32, 77], polydimethylsiloxane (PDMS) [11, 43], polyolefins [7, 26], polyester [16], fluorinated ethylene propylene [55], and poly(ethylene terephthalate) [51]. The scientists of ACLARA BioSciences, Inc. used several of these plastics for a wide range of applications including DNA sequencing, pharmaceutical candidate screening, miniaturized PCR, and protein separations [27, 42, 56, 64, 78]. Part of their work was recently reviewed [5, 7]. PDMS has been used by several research groups to make microfluidic devices; some of this work was reviewed recently by Whitesides and colleagues [43]. Very complicated devices with large-scale integration have also been fabricated using PDMS for applications such as cell sorting and combinatorial synthesis [67]. Fabrication methods for making plastic microfluidic devices have been reviewed by Soper et al. [61].
Plastic microfluidic devices range in size from that of a thumbnail to that of a microtiter plate (in excess of 100 cm2). The microchannels are typically tens to hundreds of micrometers in depth and width while circuit-like channels can be centimeters in length. Reagents are fed to these channels via reservoirs, which are typically 0.5–3 mm in diameter and penetrate the depth of the device ( 0.5–2 mm), resulting in total reagent volumes of 0.1–15 µL per reservoir. Hundreds of reservoirs and meters of channels can be densely packed into multiplexed designs that form an array of patterns on a single disposable device.
Key differences between silicon, glass, and plastics are compiled in Table 9.1. Advantages of plastics include vast experience in manufacturing low-cost, high-volume labware items such as microcentrifuge tubes and microtiter plates, as well as many plastics’ compatibility with biological and chemical reagents. While microfabrication of silicon or glass can be accomplished quite cheaply when chip sizes are small ( 1 cm2), larger fluidic devices ( 100 cm2) are often required for applications such as DNA sequencing [2] or the parallel screening of large numbers of pharmaceutical candidates [7]. In addition, the drilling of reservoirs and sealing of a large glass cover layer using high-temperature fusion bonding are relatively cumbersome processes [2]. In contrast, plastic parts made by techniques such as injection molding, casting, or embossing, followed by sealing using thermal or adhesive bonding, can be quite inexpensive: the manufacturing cost of an injection-molded compact disc, a two-layer structure made from acrylic or polycarbonate and containing micron-scale features, is presently less than 20 c.

PLASTIC MICROFLUIDIC DEVICES FOR DNA AND PROTEIN ANALYSES |
315 |
TABLE 9.1. Materials of construction for electrokinetic microfluidic devicesa
|
Silicon |
Glass/fused silica |
Plasticsb |
thermal conductivity |
0.35 |
2 × 10⁻³ |
4.5 × 10⁻⁴ c |
(cal/cm-s-◦C ) |
|
|
|
bioassay compatibility |
fair (oxide/nitride |
fair |
very good |
|
surface layer) |
|
|
optical detection |
visible/UV: strong |
glass: very good |
poor–v. good (varies |
|
absorbance |
fused silica: excellent |
according to polymer |
|
IR: transparent |
|
choice and |
|
|
|
wavelength) |
microfabrication |
many well-developed |
isotropic wet etching |
Si or glass mastering |
|
approaches |
only |
plus replication |
|
|
|
techniques; direct |
|
|
|
methods (ablation, dry |
|
|
|
etching) |
feature aspect ratio |
<0.1–40 |
<0.5 |
dependent on master for |
(depth:width of |
|
|
replication methods |
microchannels) |
|
|
|
manufacturing methods |
well developed |
need development |
well developed |
cost |
inexpensive (small |
moderately expensive |
inexpensive |
|
single devices) to |
|
|
|
expensive (large-area |
|
|
|
device arrays) |
|
|
a Harrison, D. J.; Glavina, P. G.; Manz, A. Sensors and Actuators, 1993, B10, 107–116; Weast, R. C. CRC Handbook of Chemistry and Physics, 59th edition, CRC Press, Florida, 1979.
b acrylics, polycarbonates, polyolefins, and polydimethylsiloxane have been most utilized and studied. c value for polymethylmethacrylate.
Thus, plastic microfluidic devices might be made so cheaply as to be disposable after a single use. This could have tremendous impact in applications where cross-contamination of sequential samples is of concern. Point-of-care clinical diagnostics, high-throughput screening of candidate pharmaceutical libraries, and genotyping for forensic identification are three instances where contamination of one sample by another is most undesirable.
9.3.1. Pumping and Detection
With regard to electrokinetic pumping, most plastics, including PMMA, polycarbonate, PDMS, and even Teflon R exhibit a degree of EOF—typically a factor of five or so smaller than silica /glass—which results from either a low level of fixed, negatively charged surface functional groups, or ions adsorbed from the aqueous buffer in the channels [6, 35]. The surface properties of plastics usually have no direct effect on electrophoretic separations (so long as there is no unwanted nonspecific adsorption), which depend on the properties of analytes and separation medium.
From a detection standpoint, the most obvious concern in working with plastic microfluidic devices is background fluorescence, especially using short-wavelength excitation. The fluorescence of a plastic device depends not only on the bulk properties of the plastic but can be influenced by the chip manufacturing process and/or adhesives used for bonding a cover onto the device. An approach to increasing signal-to-noise ratio by rejecting background
316 |
Z. HUGH FAN AND ANTONIO J. RICCO |
is confocal epifluorescence detection. The use of high numerical aperture objectives allows efficient collection of light while a pinhole positioned in the image plane successfully minimizes background fluorescence from the chip. An alternative strategy is to use redor near-infrared-absorbing fluorophores, since background fluorescence is typically much reduced in this wavelength region. Experimental results indicate that, under conditions of photobleaching, the background fluorescence from several plastic (e.g., PMMA) chips, when excited by 488 nm laser light, is just a few times that of a glass microfluidic device of similar thickness [7].
9.3.2. Device Fabrication
The numerous methods for manufacturing plastic devices can be divided into two classes, direct fabrication and replication. Direct techniques such as mechanical machining or laser ablation are usually not the most economical, since the fabrication operation must be conducted on each and every part; in some cases, these methods produce surfaces too rough for high-resolution electrophoresis [51]. Replication methods shift the burden of creating a high-quality surface to the creation of the template, master, or mold tool from which the polymer part is to be formed. Replication methods include injection molding, compression molding, embossing, and casting; their definitions are given in Table 9.2. These techniques are demonstrably economical when large volumes of identical plastic parts or devices are formed using existing manufacturing methods and machinery.
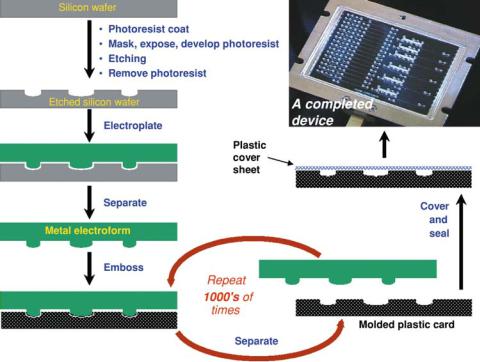
One approach to mass production of plastic microfluidic devices, similar to that used in the commercial manufacture of compact discs, involves two primary steps: (1) formation of “open” microstructures such as channels and reservoirs on one surface of a base layer of polymer, and (2) sealing of the features in the base layer by a plastic cover layer [7, 42]. The overall process is diagrammed in Figure 9.2. To form the base layer, fluidic features are first microfabricated on a glass plate, fused silica plate, or silicon wafer using standard photolithographic patterning and etching techniques; requirements for surface smoothness (sub-micron) as well as lateral structure resolution (tens of microns) are readily attained with such methods. Next, a metal mold or “master” is created by electroplating from aqueous solution to deposit anywhere from a few hundred microns to a few millimeters of metal onto the surface of the master, creating a precise replicate “electroform” with inverse topology:
|
TABLE 9.2. Glossary of plastics processinga |
Injection Molding |
A molding procedure whereby a heat-softened plastic material is forced from a cylinder |
|
into a cavity that gives the article the desired shape |
Compression |
A molding technique whereby molding compound is introduced into an open mold and |
Molding |
formed under heat and pressure |
Extrusion |
Process of compacting and melting a plastic material and forcing it through an orifice in |
|
a continuous fashion |
Embossing |
Techniques used to create depressions of a specific pattern in plastic films or sheets |
Electroforming |
Moldmaking method whereby a thin layer of metal is deposited onto a patterned substrate, |
|
then removed for use as a tool |
|
|
a Berins, M.L. Plastics Engineering Handbook, 5th edition, Van Nostrand Reinhold, NY, 1991.
PLASTIC MICROFLUIDIC DEVICES FOR DNA AND PROTEIN ANALYSES |
317 |
FIGURE 9.2. Process overview for mass manufacturing of plastic microfluidic systems. A microfluidic design is patterned and etched on a glass or silicon substrate using standard micromachining techniques to form a positive “master.” A metal mold or “electroform” is formed via electroplating onto the surface of the master, creating a precise negative replica of the pattern. Thousands to millions of plastic parts with channeled structures are thermally formed against the metal mold tool. Each molded device is then sealed with a plastic layer that encloses the microchannels [7].
a channel in the silicon or glass becomes a ridge in the electroform. Such a metal tool can be mounted as the molding tool on an embossing machine or an injectionor compressionmolding system. Polymer base layers are then formed in volume from melted or softened polymer resin or sheet to create smooth and precise channels in the finished fluidic device (Figure 9.2). A master or metal tool can also be used as the template for the casting of in-situ-polymerized substrates.
The open microchannels and reservoirs of a molded or embossed fluidic base layer are sealed to form closed channels by bonding to a smooth plaque of rigid polymer material or a thin polymer film. In either case, the covering material can be sealed to the fluidic base layer using an adhesive interlayer (e.g., films coated with pressure-sensitive adhesive) or by thermal techniques that fuse the two layers to one another. The chemical, optical, electrical, and mechanical properties of both the base material and the sealing layer must be compatible with the chemical reagents and procedures, the chosen method of motivation of solvent and solute through the microchannels, and the technology selected to detect the analytical targets.
318 |
Z. HUGH FAN AND ANTONIO J. RICCO |
9.4. DNA ANALYSES
The full utility of a microfabricated analysis system can be exploited by integrating sample preparation steps as part of a complete assay. This has the potential to minimize user intervention, automate all steps in a process, and reduce sample-to-answer times. However, integration of operations such as sample extraction and sample amplification with electrophoretic analysis poses significant challenges. For instance, samples need to remain confined within specific zones on an integrated device to allow the necessary reactions and chemistries to occur, but individual zones also need to be fluidically linked to allow transfer of a sample from one processing step to the next. In addition, different sample preparation steps may occur at different temperatures and therefore zones need to be thermally isolated from one another. Elevated temperatures required in applications such as PCR complicate the confinement of fluids to defined zones because of thermal-expansion-driven convection and flow. The accurate metering and positioning of fluids are also critical in an integrated device.
To date, there have been few published examples of the integration of sample processing and analysis on a single device. We choose here a couple of examples that illustrate the integration of microfluidic components and their application in DNA analyses.
9.4.1. Integrating PCR and DNA Fragment Separations
Anderson et al. showed nucleic acid extraction, PCR amplification or reverse transcription, and hybridization analysis integrated onto a single microfluidic device fabricated from polycarbonate or polypropylene [1]. This device had reactor volumes in the 5–20 µL range. Several groups have reported integrating PCR amplification and electrophoresis on silicon [8], glass [70], and silicon/glass hybrid microchips [74]. Soper et al. coupled nanoliter-scale amplification in fused-silica capillaries with electrophoretic DNA separation in PMMA microchips [62]. These examples represent impressive advances in integrating sample preparation with other analyses on a single device.
Koh et al. recently designed and fabricated an integrated plastic microfluidic device for bacterial detection and identification [27]. The device, made from poly (cyclic olefin) with integrated graphite ink electrodes and photopatterned gel domains, accomplished DNA amplification, microfluidic valving, sample injection, on-column labeling, and separation. The layout of the device is shown in Figure 9.3. Wells 5 and 6 are for introducing a sample into the PCR channel reactor between them. Well 7 is for the introduction of a DNA sizing ladder, which serves as a calibration standard to accurately identify the amplicons according to their sizes. Wells 8 and 4 are for loading a sample plug into the separation channel, while Wells 1 and 3 are for running the separation. Well 2 was not used.
PCR was conducted in the channel reactor containing a volume of 84 nL; thermal cycling utilized screen-printed graphite ink resistors. Integrated heaters provided rapid thermal cycling due to localized heating combined with low thermal mass. The ink heater was compared with a commercial thermal cycler, and the results showed that the temperature ramp-up speed using the ink heater was roughly 4 times faster than that of the commercial thermal cycler. The higher speed resulted in rapid analysis as well as fewer false positive results due to less time for mismatching that can occur between primers and targets [73].
PLASTIC MICROFLUIDIC DEVICES FOR DNA AND PROTEIN ANALYSES |
319 |
Gel valve |
|
PCR |
Total PCR |
|
|
|
|
||
5 |
|
6 |
volume: |
|
|
|
|
||
|
7 |
|
|
|
|
|
|||
|
|
|
|
~84 nL |
|
|
|
|
|
|
|
|
|
|
|
|
|
|
|
|
1 |
|
2 |
8 |
|
|
|
|
3 |
|
|
|
|
|
4 |
|
|
|
|
Units) |
2.0 |
|
|
|
|
232 |
|
|
|
|
|
|
|
|
559 |
|
|||
|
|
|
|
|
|
|
|||
|
(c) sample + |
|
|
|
|
||||
(Arbitrary |
|
|
429 |
|
|
||||
|
"molecular ruler" |
|
|
|
|||||
|
|
|
|
|
|||||
|
|
|
|
|
|
500 |
700 |
1000 |
|
|
|
|
|
|
|
|
|||
Fluorescence |
1.0 |
|
|
|
|
200 |
|
|
|
(b) "molecular ruler" |
100 |
|
|
|
|||||
|
|
|
|
||||||
|
|
|
|
primer/dimer |
232 |
429 |
559 |
|
|
|
|
|
|
|
|
|
|
||
|
|
|
|
|
|
|
|
|
|
|
0 |
(a) sample |
|
|
|
|
|||
|
|
|
|
|
|
|
|
|
|
|
1.0 |
|
|
|
1.5 |
2.0 |
|
2.5 |
3.0 |
Time (minutes)
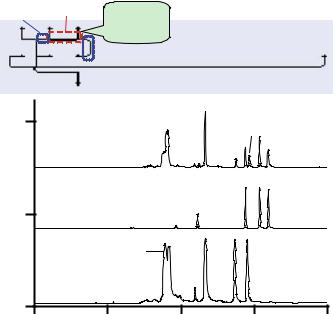
FIGURE 9.3. (Top) Layout of a plastic microfluidic device; the heated region for PCR thermal cycling is indicated by long dotted lines whereas the gel valve areas are designated by short dotted lines. (Bottom) Electropherograms of (a) amplicons, (b) DNA sizing ladder, and (c) the mixture formed by simultaneously injecting amplicons and the ladder. The separation medium consisted of 1.5% hydroxypropylcellulose, 0.4% hydroxyethylcellulose, 4 µM thiazole orange in 1X TBE buffer, pH 8.4. The field strength was 193 V/cm and the effective separation distance, from the injection point to the detection point was 3 cm. (Adapted from [27] published with permission.)
In-situ gel polymerization was employed to form local microfluidic valves that minimize convective flow of the PCR mixture into other regions. To make a gel valve at a precise location, acrylamide monomer solution containing a photosensitive initiator was first filled into all channels and wells. After the device had been covered by a pre-defined photomask, photopolymerization was conducted by exposure to UV irradiation. The solution in the exposed regions polymerized to form plugs of gel. The solution in the regions blocked by the photomask did not polymerize; non-polymerized solution was removed by flushing the channels at the end of the process and the channels were then filled with the appropriate reagents.
After PCR, amplicons (PCR products) were electrokinetically injected through the gel valve (the gel readily passes charged ions under electrophoretic drive), followed by on-chip electrophoretic separation. This is an excellent feature of the gel valve, which is able to confine the PCR mixture during thermal cycling while allowing amplicons to be transferred after PCR. To correctly size the amplicons, a DNA sizing ladder was mixed with the sample during injection as in traditional slab-gel measurements. From the migration times of the sizing ladder, the sizes of the amplicons were calculated by interpolation. To
320 |
Z. HUGH FAN AND ANTONIO J. RICCO |
facilitate detection, an intercalating dye was admixed in the separation medium to label the amplicons, which were then detected using LIF.
Two model bacteria, Escherichia coli O157 and Salmonella typhimurium, were chosen to demonstrate bacterial detection and identification using this device. One primer set was designed for E. coli according to the literature [50], resulting in one amplicon at 232 bp, whereas two primer sets were designed for salmonella, producing two amplicons at 559 bp and 429 bp. Figure 9.3 shows the electropherograms obtained for amplicons from these bacteria; all expected amplicons were produced with a gain ranging from 8.5 × 10⁵ to 8.0 × 10⁶. The limit of detection was measured to be about 6 copies of target DNA.
9.4.2. DNA Sequencing
The sequencing of the human genome was accomplished at a remarkable pace, due in large part to the utilization of 96-capillary-array electrophoresis instruments, which provide increased efficiency and reduced costs compared to slab-gel electrophoresis systems. Capillary bundles filled with high-molecular-weight sieving polymers, such as linear polyacrylamide, allow rapid, high-resolution separations and automated capillary filling. Replacing capillary arrays with an array of microchannels fabricated in planar substrates may, in the future, lead to highly multiplexed microfabricated DNA sequencers [2, 33]. The potential to integrate additional functionalities into such systems—such as on-chip means to purify the sample prior to CE sequencing—offers the hope that many of the manual operations that currently account for over half of the cost of obtaining a DNA sequence can be automated.
Fundamentally, sequencing separations in microchannels are quite similar to those in CE. The speed and resolution of a separation is strongly influenced by the choice and formulation of the separation matrix, separation temperature, electric field strength, and separation length. However, there are also significant differences between the two techniques. First, the method of sample introduction differs: in CE with gel-filled capillaries, samples are electrokinetically injected directly into one end of the separation capillary. The quantity of sample injected depends on the field strength and time of injection, as well as the electrophoretic mobility of the DNA fragments, which varies according to their size, resulting in so-called “injection bias”: shorter fragments are injected in higher concentrations than longer ones. By contrast, the microchannel format employs a intersecting-channels injection format that allows a controlled, reproducible injection-plug size that is independent of injection time [13, 25] and minimizes electrophoretic injection bias. Secondly, as the number of capillaries in an array increases, the array becomes increasingly difficult to manufacture and optical alignment for detection is more challenging. In contrast, planar microfluidic channel arrays should be simpler to manufacture in large volumes, and channel-to-channel alignment is fixed, making multiplexed detection strategies more robust.
There are several examples of DNA sequencing in microchannels etched in glass [2, 33, 58, 75], including so-called four-color sequencing, in which all four base types (A, C, G, and T) are analyzed simultaneously using a corresponding set of four spectrally distinguishable dyes to label each DNA fragment according to its terminal base; 500 bases can be sequenced in 20 minutes at 99.4% accuracy [34]. Because glass surfaces are charged at sequencing buffer pH values, they must be derivatized prior to separation to suppress EO, which otherwise would degrade the resolution of the electrophoretic separation process.
PLASTIC MICROFLUIDIC DEVICES FOR DNA AND PROTEIN ANALYSES |
321 |
10 |
20 |
30 |
40 |
50 |
60 |
70 |
80 |
90 |
100 |
110 |
120 |
130 |
140 |
150 |
160 |
|
170 |
|
|
180 |
|
|
|
190 |
|
|
|
|
|
200 |
|
|
|
|
210 |
|
220 |
|
|
230 |
|
|
|
240 |
|
|
|
|
|
|
250 |
|
|
|
|
260 |
|
|
|
|
270 |
|
|
|
|
|
280 |
|
|
|
|||||||||||||||||||||||||||||||||||||||||||||||||||||||
|
|
|
|
|
|
|
|
|
|
|
|
|
|
|
|
|
|
|
|
|
|
|
|
|
|
|
|
|
|
|
|
|
|
|
|
|
|
|
|
|||||||||||||||||||||||||||||||||||||||||||||||||||||||||||||||||||||||
|
|
|
|
|
|
|
|
|
|
|
|
|
|
|
|
|
|
|
|
|
|
|
|
|
|
|
|
|
|
|
|
|
|
|
|
|
|
|
|
|
|
|
|
|
|
|
|
|
|
|
|
|
|
|
|
|
|
|
|
|
|
|
|
|
|
|
|
|
|
|
|
|
|
|
|
|
|
|
||||||||||||||||||||||||||||||||
|
290 |
|
|
|
|
|
|
|
|
|
|
|
|
|
|
|
|
|
|
|
|
|
|
|
|
|
|
|
|
|
|
|
|
|
|
|
|
|
|
|
|
|
|
|
|
|
|
|
|
|
|
|
|
|
|
|
|
|
|
|
|
|
|
|
|
|
|
|
|
|
|
|
|
400 |
|
|
|
|||||||||||||||||||||||||||||||||
|
|
|
300 |
|
|
310 |
|
320 |
330 |
|
|
|
|
|
340 |
|
|
|
|
|
|
350 |
|
|
|
|
360 |
|
|
|
|
|
|
370 |
|
|
|
|
|
|
380 |
|
|
|
|
390 |
|
|
|
|
|
|
|
|
||||||||||||||||||||||||||||||||||||||||||||||||||||||||
|
|
|
|
|
|
|
|
|
|
|
|
|
|
|
|
|
|
|
|
|
|
|
|
|
|
|
|
|
|
|
|
|
|
|
|
|
|
|
|
|
|
|
|
|
|
|
|
|
|
|
|
|
|
|
|
|
|
|
|
|
|
|
|
|
|
|
|
|
|
|
|
|
|
|
|
|
|
|
|
|
|
|
|
|
|
|
|
|
|
|
|
|
|
|
|
|
|
|
|
|
|
|
|
|
|
|
|
|
|
|
|
|
|
|
|
|
|
|
|
|
|
|
|
|
|
|
|
|
|
|
|
|
|
|
|
|
|
|
|
|
|
|
|
|
|
|
|
|
|
|
|
|
|
|
|
|
|
|
|
|
|
|
|
|
|
|
|
|
|
|
|
|
|
|
|
|
|
|
|
|
|
|
|
|
|
|
|
|
|
|
|
|
|
|
|
|
|
|
|
|
|
|
|
|
|||||||||||||||||
|
410 |
|
|
|
420 |
|
|
|
|
|
|
430 |
|
|
|
440 |
|
|
|
450 |
|
|
|
|
|
|
|
|
460 |
|
|
|
|
|
|
|
470 |
|
|
|
|
|
|
|
480 |
|
|
|
|
|
|
|
490 |
|
|
|
|
|
|
|
|
500 |
|
|
|
|
|
|
|
|
510 |
|
|
|
|
|
|
|
|
|
|
|
|
|
|
|||||||||||||||||||||||||
|
|
|
|
|
|
|
|
|
|
|
|
|
|
|
|
|
520 |
|
|
|
|
|||||||||||||||||||||||||||||||||||||||||||||||||||||||||||||||||||||||||||||||||||||||||
|
|
|
|
|
|
|
|
|
|
|
|
|
|
|
|
|
|
|
|
|
|
|
|
|
|
|
|
|
|
|
|
|
|
|
|
|
|
|
|
|
|
|
|
|
|
|
|
|
|
|
|
|
|
|
|
|
|
|
|
|
|
|
|
|
|
|
|
|
|
|
|
|
|
|
|
|
|
|
|
|
|
|
|
|
|
|
|
|
|
|
|
|
|
|
|
|
|
|
|
|
|
|
|
|
|
|
|
|
|
|
|
|
|
|
|
|
|
|
|
|
|
|
|
|
|
|
|
|
|
|
|
|
|
|
|
|
|
|
|
|
|
|
|
|
|
|
|
|
|
|
|
|
|
|
|
|
|
|
|
|
|
|
|
|
|
|
|
|
|
|
|
|
|
|
|
|
|
|
|
|
|
|
|
|
|
|
|
|
|
|
|
|
|
|
|
|
|
|
|
|
|||||||||||||||||||||
530 |
|
|
|
540 |
|
|
|
|
|
550 |
|
|
|
|
|
560 |
|
|
|
|
570 |
|
|
|
|
|
|
580 |
|
|
|
|
590 |
|
|
|
|
|
|
600 |
|
|
|
|
|
610 |
|
|
|
|
|
|
620 |
|
|
|
|
|
|
630 |
|
|
|
|
|
|
|
|
|
640 |
650 |
|||||||||||||||||||||||||||||||||||||||
|
|
|
|
|
|
|
|
|
|
|
|
|
|
|
|
|
|
|
|
|
|
|
|
|
|
|
|
|
|
|
|
|
|
|
|
|
|
|
|
|
|
|
|
|
|
|
|
|
|
|
|
|
|
|
|
|
|
|
|
|
|
|
|
|
|
|
|
|
|
|
|
|
|
|
|
|
|
|
|
|
|
|
|
|
|
|
|
|
|
|
|
|
|
|
|
|
|
|
|
|
|
|
|
|
|
|
|
|
|
|
|
|
|
|
|
|
|
|
|
|
|
|
|
|
|
|
|
|
|
|
|
|
|
|
|
|
|
a |
|
|
|
|
|
|
|
|
|
|
|
|
|
|
|
|
|
|
|
|
|
|
|
|
|
|
|
|
|
|
|
|
|
|
|
|
|
|
|
|
|
|
|
|
|
|
|
|
|
|
|
|
|
|
|
|
|
|
|
|
|
|
|
|
|
|
|
|
|
|
|
|
|
|
|
|
|
|
|
||||
|
|
|
|
|
|
|
|
|
|
|
|
|
|
|
|
|
|
|
|
|
|
|
|
|
|
|
|
|
|
|
|
|
|
|
|
|
|
|
|
|
|
|
|
|
|
|
|
|
|
|
|
|
|
|
|
|
|
|
|
|
|
|
|
|
|
|
|
|
|
|
|
|
|
|
|
|
|
|
|
|
|
|
|
|
|
|
|
|
|
|
|
|
|
|
|
|
|
|
|
|
|
|
|
|
|
|||||
|
|
|
|
|
|
|
|
|
|
|
|
|
|
|
|
|
|
|
|
|
|
|
|
|
|
|
|
|
|
|
|
|
|
|
|
|
|
|
|
|
|
|
|
|
|
|
|
|
|
|
|
|
|
|
|
|
|
|
|
|
|
|
|
|
|
|
|
|
|
|
|
|
|
|
|
|
|
|
|
|
|
|
|
|
|
|
|
|
|
|
|
|
|
|
|
|
|
|
|
|
|
|
|
|
|
|
|
|
||
|
|
|
|
|
|
|
|
|
|
|
|
|
|
|
|
|
|
|
|
|
|
|
|
|
|
|
|
|
||||||||||||||||||||||||||||||||||||||||||||||||||||||||||||||||||||||||||||||||||
|
|
|
|
|
|
660 |
670 |
680 |
690 |
|
|
700 |
710 |
720 |
|
|
|
|
730 |
740 |
|
|
|
|
|
|
|
750 |
|
|
|
|
|
|
|
760 |
|
|||||||||||||||||||||||||||||||||||||||||||||||||||||||||||||||||||||||||
|
|
|
|
|
|
|
|
|
|
|
|
|
|
|
|
|
|
|
|
|
|
|
|
|
|
|
|
|
|
|
|
|
|
|
|
|
|
|
|
|
|
|
|
|
|
|
|
|
|
|
|
|
|
|
|
|
|
|
|
|
|
|
|
|
|
|
|
|
|
|
|
|
|
|
|
|
|
|
|
|
|
|
|
|
|
|
|
|
|
|
|
|
|
|
|
|
|
|
|
|
|
|
|
|
|
|
|
|
|
|
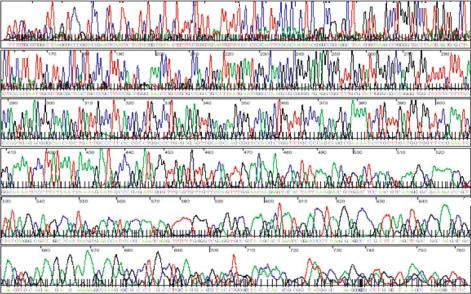
FIGURE 9.4. DNA separation data obtained using plastic microfluidic devices. Four-color electrophoretic separation of single-stranded DNA sequencing fragments generated from a M13mp18 template using BigDyeTM-labeled primers; the four colors black, red, green, and blue correspond to terminal bases G, T, A, and C, respectively. The separation channel is filled with a linear polyacrylamide matrix to enhance resolution. The total electrophoresis time is approximately 30 minutes for this particular run and base-calling accuracy is 98% up to a read length of 640 bases. (Adapted from [7].)
The stability and lifetime of covalently attached surface coatings has been an issue in CE [39] and is likely to pose similar concerns in microchannel separations.
DNA sequencing separations in plastic (acrylic and polyolefin) microchannels has been accomplished using devices produced via hot embossing from the sort of metal mold tool described above [15]. Altering the substrate material (and therefore the chemical nature of the channel surface) has implications in the choice and performance optimization of the separation matrix, as well as requirements for surface modification. Figure 9.4 shows a typical four-color DNA sequencing electropherogram of a sample run in an 18-cm-long acrylic microchannel. These data correspond to the correct identification of 640 bases with 98% accuracy; such analyses require about 30 min [15].
9.4.3. DNA Sample Purification
As discussed above, integration of sample purification prior to DNA sequencing could generate high-quality data while improving sequencing accuracy. There exists the potential to integrate DNA sequencing with sample purification to take full advantage of the power of microfluidics. Recently, Soper’s research group coupled a plastic device for sample purification with a capillary for DNA sequencing [77]. Although the effort failed to implement both procedures in a single planar device, it demonstrated the capability of solid-phase

322 |
Z. HUGH FAN AND ANTONIO J. RICCO |
|
500 m |
(a) |
(b) |
Sample Inlet
Reservoir
Wash Buffer
Reservoir
5.5 mm |
|
4.0 mm |
|
|
|
Sample Outlet
Reservoir
FIGURE 9.5. (a) Schematic diagram of the microfluidic device used for solid-phase reversible immobilization prior to gel electrophoretic sorting of DNA fragments. The channel was 500 µm in width, 50 µm in depth, and 4.0 mm in length. Reservoirs were formed from 500-µm i.d. holes drilled through the chip. (b) Optical micrograph of polycarbonate SPRI capture bed and its dimensions. Shown is the embossed piece in polycarbonate fabricated using a metal master. (Adapted from [77]; published with permission.)
reversible immobilization (SPRI) in a microfabricated plastic device for purification of dye-terminator-labeled DNA fragments prior to DNA sequencing.
In SPRI, DNA purification is achieved by an immobilization bed, which was produced in Soper’s work by exposing a “posted” (see below) microchannel to UV irradiation. The radiation induced a surface photooxidation of the polycarbonate (PC), resulting in the production of carboxylate groups. The immobilization bed contained microposts to increase the loading level of surface-captured DNA fragments to improve signal intensity without the need for preconcentration. Figure 9.5 shows a schematic diagram of the microfluidic device and a micrograph of the polycarbonate SPRI capture bed. When the sequencing mixtures were mixed with an immobilization buffer in the bed, the DNA fragments demonstrated a high affinity for the photo-activated carboxylated surface. The loading density of DNA fragments on this activated surface was determined to be 3.9 pmol/cm2.
To release the captured DNA, deionized water was subsequently introduced to the capture bed. After incubation, the released DNA fragments were pumped into a gel-filled capillary or a slab-gel for DNA sequencing. It was found that SPRI cleanup of dye-terminator DNA fragments using the photoactivated PC chip are comparable in terms of read length to the conventional SPRI format utilizing carboxylated magnetic beads and a magnetic field for capture. The read length for the SPRI chip format was found to be 620 bases with a calling accuracy of 98.9%.
9.5. PROTEIN ANALYSES
Completion of the mapping of the human genome has prompted strong interest in deciphering the human proteome. However, it is a daunting task to analyze the complete
PLASTIC MICROFLUIDIC DEVICES FOR DNA AND PROTEIN ANALYSES |
323 |
complement of proteins present in even a single type of cell or tissue and to study their variation in space and time. Therefore, it is likely that microfluidics can be exploited for niche applications to accelerate proteomic studies due to its unique features and advantages. The examples below illustrate possible connections between microfluidics and protein analyses.
9.5.1. Isoelectric Focusing for Studying Protein Interactions
Among many approaches being developed for protein analysis, two-dimensional gel electrophoresis (2-DE) and mass spectroscopy (MS) are becoming the primary tools for proteomics [31, 79]. Traditional 2-DE consists of isoelectric focusing (IEF) as the first dimension and slab-gel electrophoresis as the second dimension. However, efforts have been made to interface directly capillary IEF (CIEF) with MS, so that the mass information is obtained from MS without the second dimension of 2-D gel electrophoresis. Attempts by a few research groups [60, 65] suggest that this approach is sufficient to generate protein maps from microorganisms. CIEF maintains the high resolving power of traditional IEF, and utilizes CE’s advantages such as rapid separation under high electric fields [52, 60, 65].
CIEF has also been explored in microfluidic devices by several research groups. Santiago’s group investigated the possibility of having a portable CIEF system [22], while Hofmann et al. evaluated three mobilization methods in conjunction with IEF in a glass device [24]. Smith’s group developed a microfabricated IEF device as a direct interface to electrospray MS [71] and Yager et al. electrochemically generated pH gradients for IEF in a microchannel [38].
Tan et al. demonstrated miniaturized capillary isoelectric focusing (CIEF) in a plastic microfluidic device [64]. Conventional CIEF techniques were adapted to the microfluidic devices to separate proteins and to detect protein-protein interactions. Both acidic and basic proteins with isoelectric point (pI) ranging from 5.4 to 11.0 were rapidly focused and detected in a 1.2 cm-long channel with a total analysis time of 150 seconds. The work also experimentally confirmed that IEF resolution is essentially independent of focusing channel length when the applied voltage is kept the same and within a range that does not cause Joule heating.
Understanding protein-protein interactions is one of the major tasks of deciphering the human proteome, since most cellular processes involve the interaction of protein-to- protein, protein-to-small molecule, and/or protein-to-nucleic acid [47]. Protein arrays, yeast- two-hybrid systems, and other methods are poised to play a major role in this aspect of proteomics. IEF makes a unique contribution to this field because of its ability to resolve a wide range of proteins and protein complexes that have small differences in pI [52]. This property becomes very useful when one studies protein-protein interactions and there is a difference in pI between a protein-protein complex and its constituent proteins.
Tan et al. further demonstrated the use of miniaturized CIEF to study interactions between proteins [64]. One pair of proteins studied was immunoglobulin G (IgG) and protein G, which are known to interact with one another. Protein G binds to IgG’s Fc region, hence protein G separation columns are often used to purify immunoglobulins. MacBeath and Schreiber used this pair of proteins to demonstrate the concept of protein arrays [36]. The detection of the interaction between these two proteins using miniaturized CIEF was demonstrated, as shown in Figure 9.6. The experiment involved the comparison of CIEF electropherograms of protein G only, and of a mixture of protein G and IgG. Alexa-labeled protein G (APG) fluoresces upon excitation and thus was detected by LIF,