

Biotechnology for Biomedical Engineers - Martin L. Yarmush et al
.pdf14-6 Biotechnology for Biomedical Engineers
should be maximized at an intermediate density at which the cell contraction force is roughly in balance with the cell-substratum adhesiveness, consistent with observations for both two-dimensional [DiMilla et al.,1993] and three-dimensional [Parkhurst and Saltzman,1992] movement environments. Since adhesive force is related to the ligand-receptor binding affinity, use of ligands with different affinities provides a means for migration under conditions of different ligand densities. Recalling also that the degree of receptor organization into aggregates can dramatically increase cell-substratum adhesiveness, use of ligands yielding different degrees of receptor aggregation can similarly influence migration speed. Engineering attempts to develop useful substrata for cell migration, e.g., for woundhealing scaffolding or tissue-regeneration biomaterials also need to consider possible effects of microarchitecture, i.e., the physical geometry of three-dimensional matrices through which the cells may crawl and ligands or nutrients may diffuse [Cima and Langer, 1993].
Addition of soluble receptor-binding ligand competitors into the extracellular medium is another approach to affecting cell migration speed by means of altered cell-substratum adhesiveness. As the concentration of a competitor is increased, adhesiveness should decrease.However,since migration speed varies with adhesiveness in biphasic manner, the result of adding the competitor can be either a decrease or an increase in motility, depending on whether the adhesiveness in the absence of the competitor is below or above optimal [Wu et al., 1994]. For example, the rate of blood capillary formation, which is related to the speed of microvessel endothelial cell migration, can be either diminished or enhanced by addition of soluble integrin-binding competitors [Nicosia and Bonnano, 1991; Gamble et al.,1993].
Finally, migration speed may be altered genetically, e.g., by changing the expression level of an adhesion receptor [Schreiner et al., 1989].An increase in the number of receptors may lead to either an increase or a decrease in motility, depending on whether the change in adhesiveness is helpful or detrimental. At the same time, signaling for motile force generation, if it occurs through the same receptor, will provide an accompanying positive influence. Receptors may be altered in their ligandbinding or cytoskeletoncoupling capabilities as well, providing alternative approaches for affecting force transmission.
Attempts to manipulate the direction of cell migration fall into three categories:soluble chemotactic ligands, immobilized haptotactic ligands, and contact guidance. Haptotaxis is commonly referred to as directed migration on a density gradient of an immobilized ligand, regardless of whether it is due to differential adhesiveness or to spatially dependent membrane extension. If the latter effect is causative, the phenomenon should be more precisely termed chemotaxis but merely with an immobilized ligand; the classic definition of haptotaxis requires an adhesion effect. Examples in which efforts have been made to manipulate the direction of cell migration including homing of cytotoxic lymphocytes to tumor sites, neovascularization of healing wound tissue, and neuron outgrowth.
Contact guidance can be produced using either patterned substrata, in which pathways for cell migration are delineated by boundaries of adhesiveness [Kleinfeld et al., 1988], or by a alignment of matrix fibers for directional orientation of cell movement [Dickinson et al.,1994].A useful technology for generation of ligand concentration gradients is controlled release of chemotactic ligands from polymer matrices [Edelman et al., 1991]. Gradients required for effective cell guidance have been found to be approximately a few percent in concentration across a cell length, and they must persist for many multiples of the cell mean path length; this is the product of the persistence time (i.e., the mean time between significant direction changes) and the linear speed. Analysis has predicted that the affinity of a chemotactic ligand or, more precisely, the dissociation rate constant may be a key parameter in governing the sensitivity of a cell to a chemotactic ligand concentration gradient [Tranquillo et al., 1988]. Data on directional responses of neutrophil leukocytes to gradients of interleukin 8 show that these cells respond more sensitively to variants of IL-8 possessing lower binding affinities [Clark-Lewis et al., 1991]. Although this finding is consistent with theory, involvement of multiple forms of the IL-8 receptor with possibly varying signaling capabilities also must be considered as an alternative cause.Work with platelet-derived growth factor as a chemotactic attractant has elucidated features of the PDGF receptor involved in sensing ligand gradients, permitting approaches for pharmacologic or genetic manipulation of chemotactic receptors to modify directional migration responses [Kundra et al., 1994].
Cell Engineering |
14-7 |
References
Buckley A, Davidson JM, Kamerath CD, et al. 1985. Sustained release of epidermal growth factor accelerates wound repair. Proc Natl Acad Sci USA 82:7340.
Buschmann MD, GluzbandYA, Grodzinsky AJ, et al. 1992. Chondrocytes in agarose culture synthesize a mechanically functional extracellular matrix.J Orthop Res 10:745.
Cima LG.1994. Polymer substratas for controlled biological interactions.J Coll Biochem 56:155.
Cima LG,Vacanti JP,Vacanti C, et al. 1991.Tissue engineering by cell transplantation using degradable polymer substrates.ASMETrans J Biomec Eng 113:143.
Cima LG, Langer R. 1993.Engineering human tissue.Chem Eng Progr June:46.
Clark-Lewis I, Schumacher C, Baggiolini M, Moser B. 1991. Structure-activity relationships of IL-8 determined using chemically synthesized analogs.J Biol Chem 266:23128.
Darnell J, Lodish H, Baltimore D. 1986. Molecular Cell Biology. NewYork, Scientific American Books. Dickinson RB, Guido S,Tranquillo RT. 1994. Correlation of biased cell migration and cell orientation for fibroblasts exhibiting contact guidance in oriented collagen gels. Ann Biomed Eng 22:342. DiMilla PA, Barbee K, Lauffenburger DA. 1991. Mathematical model for the effects of adhesion and
mechanics on cell migration speed. Biophys J 60:15.
DiMilla PA, Stone JA, Quinn JA, et al. 1993.An optimal adhesiveness exists for human smooth muscle cell migration on type-IV collagen and fibronectin. J Cell Biol 122:729.
Edelman ER, Mathiowitz E, Langer R, Klagsbrun M. 1991. Controlled and modulated release of basic fibroblast growth factor.Biomaterials 12:619.
French AR,Sudlow GP,Wiley HS,Lauffenburger DA.1993.Postendocytic trafficking of EGF-receptor complexes is mediated through saturable and specific endosomal interactions.J Biol Chem 269:15749.
Gamble JR, Mathias LJ, Meyer G, et al. 1993. Regulation of in vitro capillary tube formation by antiintegrin antibodies.J Cell Biol 121:931.
Hammer DA,Apte SA. 1992.Simulation of cell rolling and adhesion on surfaces in shear flow: General results and analysis of selectin-mediated neutrophil adhesion. Biophys J 63:35.
Hammer DA, Lauffenburger DA. 1987. A dynamical model for receptor-mediated cell adhesion to surfaces. Biophys J 52:475.
Hubbell JA, Massia SP, Desai NP, Drumheller PD. 1991. Endothelial cell-selective materials for tissue engineering in the vascular graft via a new receptor. Biotechnology 9:568.
Ingber DE. 1993. The riddle of morphogenesis: a question of solution chemistry or molecular cell engineering? Cell 75:1249.
Ingber DE, Madri JA, Folkman J. 1987. Endothelial growth factors and extracellular matrix regulate DNA synthesis through modulation of cell and nuclear expansion. In Vitro Cell Dev Biol 23:387.
Kelly JJ, Koury MJ, Bondurant MC, et al. 1993. Survival or death of individual proerythroblasts results from differing erythropoietin sensitivities:A mechanism for controlled rate of erythrocyte production. Blood 82:2340.
Kleinfeld D,Kahler KH,Hockberger PE.1988.Controlled outgrowth of dissociated neurons on patterned substrates. J Neurosci 8:4098.
Knauer DJ,Wiley HS,Cunningham DD.1984.Relationship between epidermal growth factor receptor occupancy and mitogenic response: Quantitative analysis using a steady-state model system. J Biol Chem 259:5623.
KundraV, Escobedo JA, Kazlauskas A, et al. 1994. Regulation of chemotaxis by the PDGF-receptor ß. Nature 367:474.
Kuo SC,Lauffenburger DA.1993.Relationship between receptor/ligand binding affinity and adhesion strength. Biophys J 65:2191.
Lauffenburger DA,Aebischer P.1993.Cell and tissue engineering:Overview.In Research Opportunities in Biomolecular Engineering:The Interface Between Chemical Engineering and Biology.US Dept of Health and Human Services Administrative Document,pp 109–113.
14-8 Biotechnology for Biomedical Engineers
Lauffenburger DA,Lindermann JJ.1993.Receptors: Models for Binding,Trafficking,and Signaling. NewYork, Oxford University Press.
Lotz MM, Burdsal CA, Erickson HP, McClay DR. 1989. Cell adhesion to fibronectin and tenascin: Quantitative measurements of initial binding and subsequent strengthening response. J Cell Biol 109:1795.
Mahama P, Lindermann JJ. 1994. Monte Carlo study on the dynamics of G-protein activation. Biophys J 67:1345.
Massia SP, Hubbell JA. 1991. An RGD spacing of 440 nm is sufficient for integrin avß3-mediated fibroblast spreading and 140 nm for focal contact and stress fiber formation. J Cell Biol 114:1089.
Nerem RM.1991.Cellular engineering.Ann Biomed Eng 19:529.
Nicosia RF,Bonanno E.1991.Inhibition of angiogenesis in vitro by RGD-containing synthetic peptide.
Am J Pathol 138:829.
Parkhurst M. Saltzman WM. 1992. Quantification of human neutrophil motility in three-dimensional collagen gels: Effect of collagen concentrations. Biophys J 61:306.
Powell EM,Sobarzo MR,SaltzmanWM.1990.Controlled release of nerve growth factor from a polymeric implant. Brain Res 515:309.
Reddy CC,WellsA,Lauffenburger DA.1993.Proliferative response of fibroblasts expressing internalizationdeficient EGF receptors is altered via differential EGF depletion effects. Biotech Progr 10:377.
RennerWA, HatzimanikatisV,Eppenberger HM,Bailey JE.1993.Recombinant cyclin E overexpression enables proliferation of CHO K1 cells in serumand protein-free medium.Preprint from Institute for Biotechnology,ETH-Hoenggerberg,Zurich,Switzerland.
Robb RJ.1982.HumanT-cell growth factor:Purification,biochemical characterization,and interaction with a cellular receptor.Immunobiology 161:21.
Schreiner CL,Bauer IS,DanilovYN,et al.1989.Isolation and characterization of chinese hamster ovary cell variants deficient in the expression of fibronectin receptor. J Cell Biol 109:3157.
Schultz GS,White M, Mitchell R, et al. 1987. Epithelial wound healing enhanced by TGFa andVGF. Science 235:350.
Singhvi R, Kumar A, Lopez GP, et al. 1994. Engineering cell shape and function. Science 264:696. Tranquillo RT, Lauffenburger DA, Zigmond SH. 1988. A stochastic model for leukocyte random
motility and chemotaxis based on receptor binding fluctuations. J Cell Biol 106:303.
Tranquillo RT,Durrani MA,Moon AG.1992.Tissue engineering science:Consequences of cell traction force. Cytotechnology 10:225.
Ward MD, Hammer DA. 1993. A theoretical analysis for the effect of focal contact formation on cellsubstrate attachment strength. Biophys J 64:936.

15
Metabolic Engineering
Craig Zupke
Massachusetts General Hospital
and the Shriners Burns Institute
15.1 |
Basic Principles |
|
15–2 |
15.2 |
Problem Definition |
|
15–2 |
|
Addition of New Activities |
• Improving Existing Metabolism |
|
15.3 |
Analysis of Metabolic Networks |
115–4 |
|
|
Metabolic Flux Analysis • |
Metabolic Control Analysis |
• Flux |
|
Control Coefficients from Transient Metabolite |
|
|
|
Concentrations • “Top Down” MCA • Large Deviations • |
||
|
Pathway Synthesis |
|
|
15.4 |
Implementing Changes |
|
15–9 |
|
Mutation-Selection • Recombinant DNA |
|
|
15.5 |
Analysis of Changes |
|
15–9 |
15.6 Summary |
|
15–9 |
|
Metabolic engineering can be defined as the modification of cellular metabolism to achieve a specific goal.Metabolic engineering can be applied to both prokaryotic and eukaryotic cells,although applications to prokaryotic organisms are much more common.The goals of metabolic engineering include improved production of chemicals endogenous to the host cell, alterations of the substrate required for growth and product synthesis, synthesis of new products foreign to the host cell, and addition of new detoxification activities.As metabolic engineering has evolved,some general principles and techniques have emerged. In particular, developments in genetic engineering enable highly specific modification of cellular biochemical pathways.However,the complexity of biologic systems and their control severely limits the ability to implement a rational program of metabolic engineering.Early attempts at metabolic engineering were based on a simplistic analysis of cellular biochemistry and did not live up to expectations [Stephanopoulos and Sinskey, 1993].An important realization is that metabolism must be considered as a network of interrelated biochemical reactions.The concept of a single rate-limiting step usually does not apply—instead, the control of a metabolic pathway is frequently distributed over several steps.The choice of specific modifications to achieve a desired goal is difficult because of this distributed nature of control.These issues are especially relevant in medical applications of metabolic engineering, where there is the added complication of interacting organ systems.
The field of metabolic engineering is still young,and advancements are continuing,especially in the analysis of metabolic networks and their control.Recent advances include techniques for the experimental determination of kinetic or control parameters necessary to apply established mathematical formalisms to metabolic networks. Coupled with computer optimization and simulation, these techniques should lead to a greater success rate for the directed modification of cellular metabolism. In addition, the knowledge and experience gained from engineering cellular metabolism can be applied to individual organs or to the whole body to help guide the development and evaluation of new drugs and therapies.
0-8493-1811-4/03/$0.00+$1.50 |
15-1 |
© 2003 by CRC Press LLC |
15-2 |
Biotechnology for Biomedical Engineers |
15.1 Basic Principles
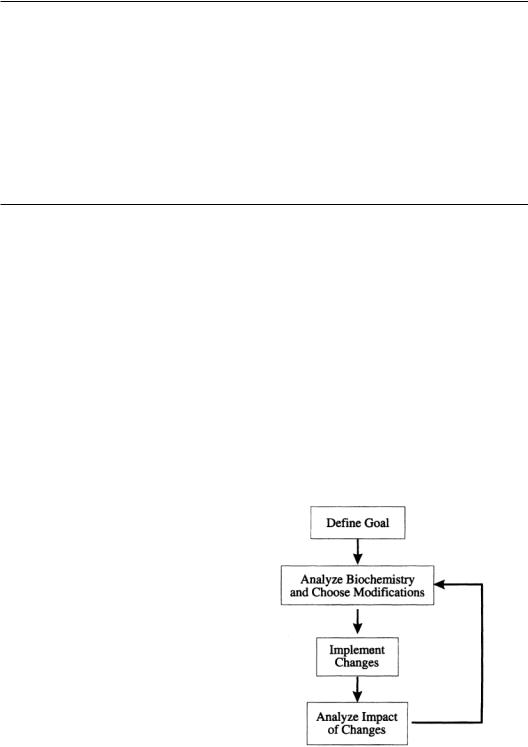
Metabolic engineering is inherently multidisciplinary, combining knowledge and techniques from cellular and molecular biology,biochemistry,chemical engineering,mathematics,and computer science. The basic cycle of metabolic engineering is summarized in the flow sheet in Fig. 15.1.The first step in the process is to define the problem or goal to which metabolic engineering will be applied.The next step is to analyze the relevant biochemistry to determine the specific modifications that will be attempted. Recombinant DNA techniques are then used to implement the modifications, and the analysis of their impact completes one pass through the metabolic engineering cycle.This process is continued in an iterative fashion until the desired result is achieved. In the discussion that follows, each step of the cycle will be addressed individually.
15.2 Problem Definition
As mentioned above, the typical goals of metabolic engineering include improving the production of endogenous chemicals, altering the organism substrate requirements, synthesizing new products, and adding new detoxification activities. There are a variety of ways that these goals can be achieved through genetic engineering and mutation and selection.Through genetic engineering, heterologous enzymes can be added to a cell, either singly or in groups.The addition of new enzymatic activities can be used to meet any of the metabolic engineering goals. Mutation and selection can be used to affect the regulation of particular enzymes and thus are most useful for altering metabolite flow.
Addition of New Activities
The distinction between product formation, substrate utilization, and detoxification is simply a matter of emphasizing different aspects of a metabolic pathway. In product formation, the end of a metabolic pathway is the focal point. In substrate utilization and detoxification, it is the input to the pathway that is important.With detoxification, there is the additional requirement that the toxin is converted to less harmful compounds, but what they are is not important. In the discussion that follows, the addition of new activity for the synthesis of new products will be emphasized. However, since they all involve adding new activity to a metabolic pathway, the same techniques used for the synthesis of new products also can be used to alter substrate requirements or add new detoxification activity.
There are several possible strategies for the synthesis of new products. The choice of strategy depends on the biochemistry present in the host organism and the specific product to be synthesized. In many instances, pathway completion can be used, which only involves the addition of a few enzymes that catalyze the steps missing from the existing metabolic pathway. Entire biochemical pathways also can be transferred to a heterologous host. The motivation for this type of transfer is that the host organism may be more robust,have a more desirable substrate requirement, or have inherently higher productivities than the organism that naturally possesses the biochemical pathway of interest. The transfer of multistep pathways to heterologous hosts has been used frequently for the production of antibiotics
Metabolic Engineering |
15-3 |
because of the clustering of the genes involved [Malpartida, 1990].When the genes are clustered, they can be cloned and inserted into the host organism as a single unit.
The procedures described above involve the transfer of a known metabolic activity from one organism to another. It is also possible to create completely new products, because many enzymes can function with multiple substrates. If an enzyme is introduced into a cell and is thus presented with a metabolite similar to its normal substrate but which was not present in the donor cell, a completely new reaction may be catalyzed. Similarly, if a foreign enzymatic activity produces an intermediate foreign to the host cell, that intermediate may undergo further reactions by endogenous enzymes and produce a novel product.This phenomenon has been used to synthesize novel antibiotics in recombinant Streptomyces [McAlpine, 1987; Epp, 1989] and to engineer an Escherichia coli for the degradation of trichlorethylene [Winter,1989]. Of course,the production of new products also may be an undesirable side effect of the introduction of a heterologous enzyme and could interfere with the production of the desired product.The complexity of enzyme activities makes the prediction of negative side effects extremely difficult.
Improving Existing Metabolism
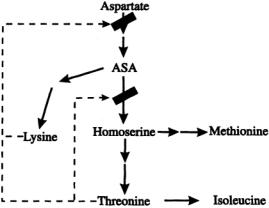
Although a cell or organism may possess a particular metabolic pathway, the flow of material through that pathway (metabolic flux) may be suboptimal. Both recombinant DNA techniques and classic mutation-selection techniques can help to redirect metabolic fluxes.The principal ways to redirect metabolic fluxes are by increasing or decreasing the activity of specific enzymes and by changing their regulation. The choice of which enzymes and how to alter them can be very complicated because of the distributed nature of metabolic control. However, some basic concepts can be illustrated by the analysis of an idealized metabolic network for threonine synthesis, as shown in Fig. 15.2. Aspartate is the biosynthetic precursor for threonine, as well as for lysine, methionine, and isoleucine. If our goal is to maximize the production of threonine, then we may want to decrease the activity of the enzymes that catalyze the production of the other amino acids derived from aspartate. This would result in less of the carbon flow from aspartate being drawn off by the unwanted amino acids, and thus a larger flux to threonine might be achieved.An alternative way of increasing the flux to threonine is to amplify the activity of the enzymes along the pathway from aspartate to threonine. Finally, accumulation of the desired product,threonine, will lead to the reduction of flux from aspartate to ASA and from ASA to homoserine because of feedback inhibition.This would result in a reduction in threonine synthesis as well.If the feedback inhibition were removed,threonine could then accumulate without affecting its rate of synthesis. In practice, multiple modifications would probably be required to achieve the desired goal.
FIGURE 15.2 A simple metabolic network for threonine synthesis.The solid arrows represent enzyme-catalyzed biochemical reactions.The dotted arrows indicate allosteric inhibition (ASA=aspartate semialdehyde).

15-4 |
Biotechnology for Biomedical Engineers |
5.3 Analysis of Metabolic Networks
Metabolic Flux Analysis
The measurement or estimation of metabolic fluxes is useful for the evaluation of metabolic networks and their control. Direct measure of intracellular fluxes is possible with in vivo nuclear magnetic resonance (NMR) spectroscopy. However, the inherent insensitivity of NMR limits its applicability.A more general strategy combines material balances with carefully chosen measurements to indirectly estimate metabolic fluxes. In isotopic tracer methods, a material balance is performed on the labeled isotope, and the measured isotope distribution is used to estimate the fluxes of interest.Alternatively, a total mass or carbon balance can be combined with extensive measurements of the rates of change of extracellular metabolic concentrations to calculate intracellular fluxes. Used individually or together, these methods can provide a great deal of information about the state of a biochemical system.
In isotope tracer methods, the cells to be studied are provided with a substrate specifically labeled with a detectable isotope (usually 14C or 13C).The incorporation of label into cellular material and by-products is governed by the fluxes through the biochemical pathways.The quantity and distribution of label are measured and combined with knowledge of the biochemistry to determine the intracellular fluxes.The choices of substrate labeling patterns, as well as which by-products to measure, are guided by careful analysis of the assumed biochemical network.These experiments are usually performed at isotopic steady state so that the flow of isotope into each atom of a metabolite equals the flux out. For the nth atom of the kth metabolite, the flux balance is [Blum, 1982]:
(15.1)
where Si(m) is the specific activity of the mth atom of the ith metabolite that contributes to the labeling of the nth atom of the kth metabolite, Sk(n), andVi,k andVo,k are the input and output fluxes of the kth metabolite, respectively.The system of equations represented by Eq. (15.1) can be solved for the fluxes (Vi,k,V0,k) from measurements of the specific activities.A similar analysis can be applied to the isotope isomers, or isotopomers, yielding more information from a single experiment. Isotopomer analysis is not just concerned with the average enrichment of individual atoms. Instead, it involves quantifying the amounts of the different isotopomers that occur at a specific metabolic state. The isotopomer distribution contains more information than that obtained from positional enrichments, making it generally a more powerful technique. Both mass spectrometry and NMR can be used to analyze isotopomer distributions.
Flux estimation based only on material balances is identical, in principle, to flux estimation using isotopic tracers and has been applied to many biochemical processes,including lysine synthesis [Vallino, 1989] and rat heart metabolism [Safer and Williamson, 1973]. Instead of following the fate of specific atoms (i.e., 13C or 14C), all are considered equally through the measurement of the rates of change of substrates and products.The analysis is simplified in some ways because only the stoichiometry of the biochemical reactions is important, and no knowledge of the chemical mechanisms is needed. Some resolving power is lost, however, with the loss of the ability to determine the source of individual reactions.The analysis is usually formulated as a matrix equation:
(15.2)
where r is a vector of metabolite rates of change,A is the matrix of stoichiometric coefficients for the biochemical network, and x is a vector of the metabolic fluxes. If the rates of change of the metabolites are measured, then Eq. (15.2) can be solved for the flux vector x by the method of least squares:
(15.3)
Metabolic Engineering |
15-5 |
Typically, extracellular metabolites are measured, while intracellular metabolites are assumed to be at pseudo-steady state and their rates of change are taken to be zero.
Metabolic Control Analysis
A biochemical network is a system of enzyme-catalyzed reactions that are interconnected through shared metabolites.At steady state, the fluxes through each pathway will be a function of the individual enzyme kinetic properties, as well as the network architecture.The activity of a particular enzyme will affect the concentration of its reactants and products and thus will influence the flux through pathways upstream and downstream.Metabolic control analysis (MCA) grew from the work originally presented by Kacser and Burns [1973] and Heinrich and Rapoport [1977]. MCA provides a framework for analyzing and quantifying the distributed control that enzymes exert in biochemical networks.
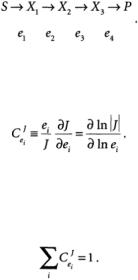
In the discussion that follows, a metabolic network consists of enzymes e, metabolites X, substrates S, and products P. For simplicity, we assume that the reaction rate vi is proportional to the enzyme concentration et. If this is not true, then some modifications of the analysis are required [Liao and Delgado, 1993]. The concentrations of the products and substrates are fixed, but the metabolite concentrations are free to change in order to achieve a steady-state flux /. An example of a simple, unbranched network is
MCA is essentially a sensitivity analysis that determines how perturbations in a particular parameter (usually enzyme concentration) affect a variable (such as steady-state flux).The measures of the sensitivities are control coefficients defined as follows:
(15.4)
The flux control coefficient  is a measure of how the flux / changes in response to small perturbations in the concentration or activity of enzyme i.The magnitude of the control coefficient is a measure of how important a particular enzyme is in the determination of the steady-state flux.The summation theorem relates the individual flux control coefficients:
(15.5)
A large value for  indicates that an increase in the activity of enzyme i(ei) should result in a large change in the metabolic flux.Thus enzymes with large flux control coefficients may be good targets for metabolic engineering. Usually, there are several enzymes in a network with comparably large C values, indicating that there is no single rate-limiting enzyme.
The challenge in analyzing a metabolic network is determination of the flux control coefficients. It is possible to determine them directly by “enzyme titration” combined with the measurement of the new steady-state flux. For in vivo systems, this would require alteration of enzyme expression through an inducible promoter and is not very practical for a moderately sized network. A more common method of altering enzyme activities involves titration with a specific inhibitor.However,this technique can be complicated by nonspecific effects of the added inhibitor and unknown inhibitor kinetics [Liao and Delgado,1993].
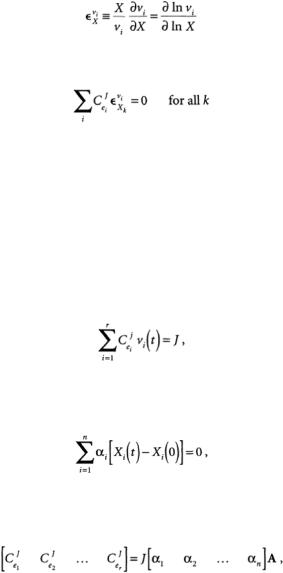
Although the control coefficients are properties of the network, they can be related to individual enzyme kinetics through elasticity coefficients. If a metabolic concentration X is altered, there will be
15-6 |
Biotechnology for Biomedical Engineers |
an effect on the reaction rates in which X is involved.The elasticity coefficient  is a measure of the effect changes in X have on vi, the rate of reaction catalyzed by enzyme ei:
(15.6)
The flux control connectivity theorem relates the flux control coefficients to the elasticity coefficients:
(15.7)
In principle, if the enzyme kinetics and steady-state metabolite concentrations are known, then it is possible to calculate the elasticities and through Eq. (15.7) determine the flux control coefficients.
Flux Control Coefficients from Transient Metabolite Concentrations
Recent efforts to address the difficulty of determining MCA parameters include the use of transient measurements of metabolite concentrations to give good estimates of the flux control coefficients [Delgado and Liao, 1992].The key assumption in the dynamic approach is that the reaction rates are reasonably linear around the steady state.When this is true and a transient condition is induced (by changing substrate or enzyme concentration), the transient fluxes vi(t) are constrained by the following equation:
(15.8)
where r equals the number of reactions in the network. Measurements of transient metabolite concentration allow the determination of regression coefficients ai from the following equation:
(15.9)
where n equals the number of metabolites measured.The flux control coefficients are then determined from
(15.10)
where A is the matrix of stoichiometric coefficients. Using this method requires the measurements of transient metabolite concentrations, which are used to calculate the ai, values, and the accumulation or depletion of external metabolites to determine the steady-state flux J.The measurement of transient metabolite concentrations can be difficult but is possible with in vivo NMR or from cell extracts taken at different time points.
“Top-Down” MCA
The traditional approach of MCA can be considered to be “bottom-up,” since all the individual enzyme flux control coefficients are determined in order to describe the control structure of a large network.The “top-down” approach makes extensive use of lumping of reactions together to determine
Metabolic Engineering |
15-7 |
group flux control coefficients [Brown, 1990]. These can give some information about the overall control of a metabolic network without its complete characterization.Consider a simple,multireaction pathway:
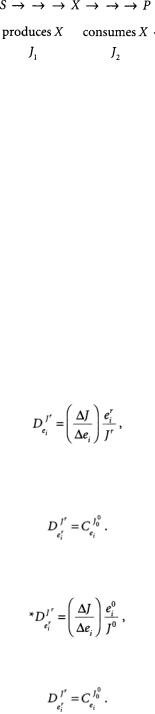
The reactions of a metabolic network are divided into two groups, those which produce a particular metabolite X and those which consume it. By manipulating the concentration X and measuring the resulting fluxes J1 and J2 “group” or “overall” elasticities *e of the X producers and X consumers can be determined. Application of the connectivity theorem (Eq. 15.7) then permits the calculation of the group control coefficient for both groups of reactions. Each pathway can subsequently be divided into smaller groups centered around different metabolites, and the process repeated.The advantage of the top-down approach is that useful information about the control architecture of a metabolic network can be obtained more quickly.This approach is particularly appropriate for highly complex systems such as organ or whole-body metabolism.
Large Deviations
One of the limitations of MCA is that it only applies when the perturbations from the steady state are small.Experimentally,it is much easier to induce large changes in enzyme or metabolite concentrations, and in terms of metabolic engineering, the desired perturbations are also likely to be large. Small and Kacser [1993a, 1993b] have developed an analysis based on large deviations and related it to MCA.
In this discussion,  the original concentration of enzyme
  where r is noninfinitesimal. Thus
  a large perturbation to the system. J° is the flux at the original steady state, and Jr is the flux after the large perturbation.A deviation index D is used to characterize the change from the original steady state:
(15.11)
where  By assuming that each individual enzymatic reaction rate is a linear function of the participating metabolites,it can be shown that the deviation index and control coefficients are equivalent:
(15.12)
Similarly, an alternate deviation index *D can be defined as
(15.13)
and it is equivalent to the control coefficient at the new steady state:
(15.14)