

Biotechnology for Biomedical Engineers - Martin L. Yarmush et al
.pdf7-8 |
Biotechnology for Biomedical Engineers |
TABLE 7.3 Ventilation-to-Perfusion Ratios from the Top to Bottom of the Lung of a Normal Man in the Sitting Position
Source: Used with permission from West [1962].
where p = pressure, N/m2
V = |
volume of gas, m3 |
n = |
number of moles, mol |
R = |
gas constant, (N×m)/(mol×K) |
T = |
absolute temperature, K. |
The ideal gas law can be applied without error up to atmospheric pressure; it can be applied to a mixture of gases, such as air, or to its constituents, such as oxygen or nitrogen.All individual gases in a mixture are considered to fill the total volume and have the same temperature but reduced pressures. The pressure exerted by each individual gas is called the partial pressure of the gas.
Dalton’s law states that the total pressure is the sum of the partial pressures of the constituents of a mixture:
where pi = partial pressure of the ith constituent, N/m2 N = total number of constituents.
Dividing the ideal gas law for a constituent by that for the mixture gives
so that
which states that the partial pressure of a gas may be found if the total pressure, mole fraction, and ratio of gas constants are known. For most respiratory calculations, p will be considered to be the pressure of
Respiratory System |
7-9 |
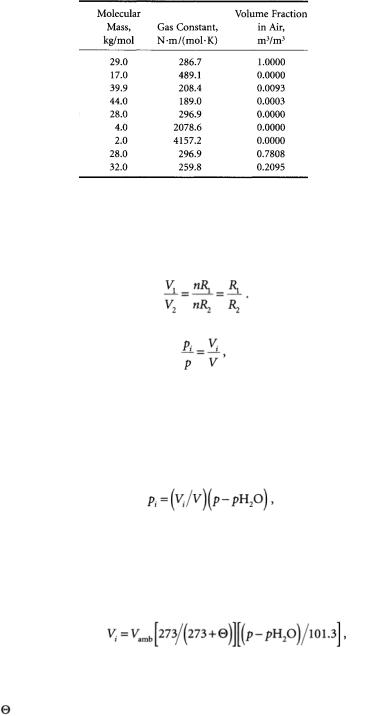
TABLE 7.4 Molecular Masses, Gas Constants, and Volume
Fractions for Air and Constituents
Note: Universal gas constant is 8314.43 N.m/kg.mol.K.
1 atmosphere, 101 kN/m2.Avogadro’s principle states that different gases at the same temperature and pressure contain equal numbers of molecules:
Thus
where Vi/V is the volume fraction of a constituent in air and is therefore dimensionless. Table 7.4 provides individual gas constants, as well as volume fractions, of constituent gases of air.
Gas pressures and volumes can be measured for many different temperature and humidity conditions. Three of these are body temperature and pressure,saturated (BTPS);ambient temperature and pressure (ATP); and standard temperature and pressure, dry (STPD).To calculate constituent partial pressures at STPD, total pressure is taken as barometric pressure minus vapor pressure of water in the atmosphere:
where p |
= |
total pressure, kN/m2 |
pH2O |
= |
vapor pressure of water in atmosphere, kN/m2, |
and Vi/V as a ratio does not change in the conversion process.
Gas volume at STPD is converted from ambient condition volume as
where Vi |
= |
volume of gas i corrected to STPD, m3 |
Vamb = |
volume of gas i at ambient temperature and pressure, m3 |
|
|
= |
ambient temperature, °C |
p |
= |
ambient total pressure, kN/m2 |
pH2O = |
vapor pressure of water in the air, kN/m2. |
|
7-10 |
Biotechnology for Biomedical Engineers |
TABLE7.5 Gas Partial Pressures (kN/m2) throughout the
Respiratory and Circulatory Systems
*Inspired air considered dry for convenience.
†Includes all other inert components.
Source: Used with permission from Astrand and Rodahl [1970].
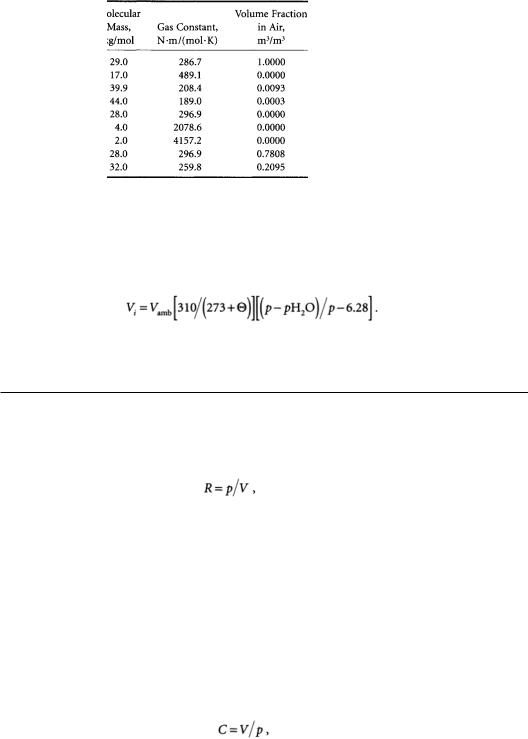
Partial pressures and gas volumes may be expressed in BTPS conditions. In this case, gas partial pressures are usually known from other measurements. Gas volumes are converted from ambient conditions by
Table 7.5 provides gas partial pressure throughout the respiratory and circulatory systems.
7.5 Pulmonary Mechanics
The respiratory system exhibits properties of resistance, compliance, and inertance analogous to the electrical properties of resistance,capacitance,and inductance.Of these,inertance is generally considered to be of less importance than the other two properties.
Resistance is the ratio of pressure to flow:
where R = |
resistance, N×s/m5 |
P = |
pressure, N/m2 |
V = |
volume flow rate, m3/s. |
Resistance can be found in the conducting airways, in the lung tissue, and in the tissues of the chest wall. Airways exhalation resistance is usually higher than airways inhalation resistance because the surrounding lung tissue pulls the smaller, more distensible airways open when the lung is being inflated.Thus airways inhalation resistance is somewhat dependent on lung volume, and airways exhalation resistance can be very lung volume-dependent [Johnson, 1991]. Respiratory tissue resistance varies with frequency, lung volume, and volume history.Tissue resistance is relatively small at high frequencies but increases greatly at low frequencies,nearly proportional to 1/f.Tissue resistance often exceeds airway resistance below 2 Hz. Lung tissue resistance also increases with decreasing volume amplitude [Stamenovic et al., 1990].
Compliance is the ratio of lung volume to lung pressure:
where C = compliance, m5/N, V = lung volume/m3 P = pressure,N/m2.

Respiratory System |
7-11 |
As the lung is stretched, it acts as an expanded balloon that tends to push air out and return to its normal size.The static pressure-volume relationship is nonlinear,exhibiting decreased static compliance at the extremes of lung volume [Johnson, 1991].As with tissue resistance, dynamic tissue compliance does not remain constant during breathing. Dynamic compliance tends to increase with increasing volume and decrease with increasing frequency [Stamenovic et al., 1990].
Two separate approaches can be used to model lung tissue mechanics. The traditional approach places a linear viscoelastic system in parallel with a plastoelastic system. A linear viscoelastic system consists of ideal resistive and compliant elements and can exhibit the frequency-dependence of respiratory tissue.A plastoelastic system consists of dry-friction elements and compliant elements and can exhibit the volume dependence of respiratory tissue [Hildebrandt, 1970].An alternate approach is to utilize a nonlinear viscoelastic system that can characterize both the frequency dependence and the volume dependence of respiratory tissue [Suki and Bates, 1991].
Lung tissue hysteresivity relates resistance and compliance:
= frequency, radians/s = resistance, N×s/m5 = hysteresivity, unitless
Cdyn= dynamic compliance, m5/n.
Hysteresivity, analogous to the structural damping coefficient used in solid mechanics, is an empirical parameter arising from the assumption that resistance and compliance are related at the microstructural level. Hysteresivity is independent of frequency and volume. Typical values range from 0.1 to 0.3 [Fredberg and Stamenovic, 1989].
7.6 Respiratory Control
Control of respiration occurs in many different cerebral structures [Johnson, 1991] and regulates many things [Hornbein, 1981]. Respiration must be controlled to produce the respiratory rhythm, ensure adequate gas exchange, protect against inhalation of poisonous substances, assist in maintenance of body pH, remove irritations, and minimize energy cost. Respiratory control is more complex than cardiac control for at least three reasons:
1.Airways airflow occurs in both directions.
2.The respiratory system interfaces directly with the environment outside the body.
3.Parts of the respiratory system are used for other functions, such as swallowing and speaking.
As a result, respiratory muscular action must be exquisitely coordinated; it must be prepared to protect itself against environmental onslaught, and breathing must be temporarily suspended on demand.
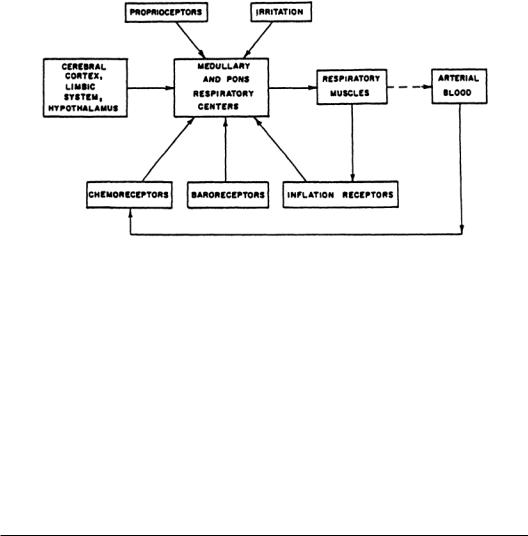
All control systems require sensors, controllers,and effectors. Figure 7.4 presents the general scheme for respiratory control.There are mechanoreceptors throughout the respiratory system. For example, nasal receptors are important in sneezing, apnea (cessation of breathing), bronchodilation, bronchoconstriction,and the secretion of mucus.Laryngeal receptors are important in coughing,apnea, swallowing,bronchoconstriction,airway mucus secretion,and laryngeal constriction.Tracheobronchial receptors are important in coughing, pulmonary hypertension, bronchoconstriction, laryngeal constriction, and mucus production. Other mechanoreceptors are important in the generation of the respiratory pattern and are involved with respiratory sensation.
Respiratory chemoreceptors exist peripherally in the aortic arch and carotic bodies and centrally in the ventral medulla oblongata of the brain.These receptors are sensitive to partial pressures of CO2 and O2 and to blood pH.
7-12 |
Biotechnology for Biomedical Engineers |
FIGURE 7.4 General scheme of respiratory control.
The respiratory controller is located in several places in the brain. Each location appears to have its own function. Unlike the heart, the basic respiratory rhythm is not generated within the lungs but rather in the brain and is transmitted to the respiratory muscles by the phrenic nerve.
Effector organs are mainly the respiratory muscles,as described previously.Other effectors are muscles located in the airways and tissues for mucus secretion. Control of respiration appears to be based on two criteria: (1) removal of excess CO2 and (2) minimization of energy expenditure. It is not the lack of oxygen that stimulates respiration but increased CO2 partial pressure that acts as a powerful respiratory stimulus. Because of the buffering action of blood bicarbonate, blood pH usually falls as more CO2 is produced in the working muscles. Lower blood pH also stimulates respiration.
A number of respiratory adjustments are made to reduce energy expenditure during exercise: Respiration rate increases, the ratio of inhalation time to exhalation time decreases, respiratory flow waveshapes become more trapezoidal, and expiratory reserve volume decreases. Other adjustments to reduce energy expenditure have been theorized but not proven [Johnson, 1991].
7.7 The Pulmonary Function Laboratory
The purpose of a pulmonary function laboratory is to obtain clinically useful data from patients with respiratory dysfunction.The pulmonary function tests (PFTs) within this laboratory fulfill a variety of functions.They permit (1) quantification of a patient’s breathing deficiency, (2) diagnosis of different types of pulmonary diseases, (3) evaluation of a patient’s response to therapy, and (4) preoperative screening to determine whether the presence of lung disease increases the risk of surgery.
Although PFTs can provide important information about a patient’s condition, the limitations of these tests must be considered. First, they are nonspecific in that they cannot determine which portion of the lungs is diseased,only that the disease is present.Second,PFTs must be considered along with the medical history, physical examination, x-ray examination, and other diagnostic procedures to permit a complete evaluation.Finally,the major drawback to some PFTs is that they require full patient cooperation and for this reason cannot be conducted on critically ill patients. Consider some of the most widely used PFTs: spirometry, body plethysmography, and diffusing capacity.
Spirometry
The simplest PFT is the spirometry maneuver.In this test,the patient inhales to total lung capacity (TLC) and exhales forcefully to residual volume.The patient exhales into a displacement bell chamber that sits on
Respiratory System |
7-13 |
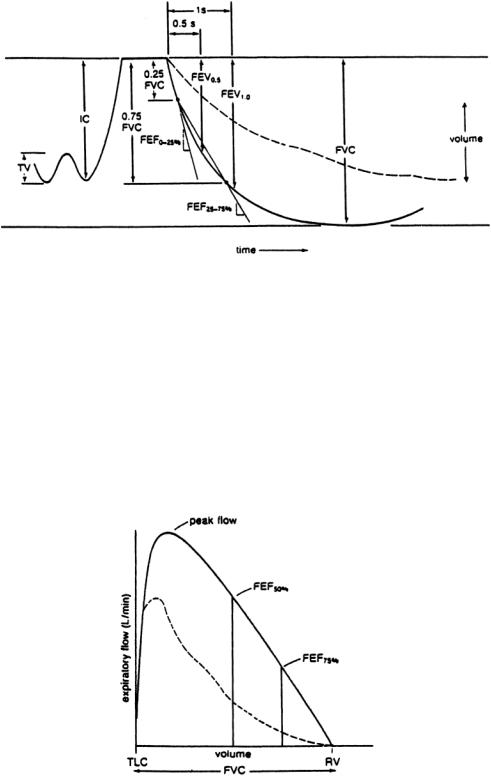
FIGURE 7.5 Typical spirometry tracing obtained during testing; inspiratory capacity (IC), tidal volume (TV), forced vital capacity (FVC), forced expiratory volume (FEV), and forced expiratory flows. Dashed line represents a patient with obstructive lung disease; solid line represents a normal, healthy individual.
a water seal.As the bell rises, a pen coupled to the bell chamber inscribes a tracing on a rotating drum. The spirometer offers very little resistance to breathing; therefore, the shape of the spirometry curve (Fig. 7.5) is purely a function of the patient’s lung compliance, chest compliance, and airway resistance. At high lung volumes, a rise in intrapleural pressure results in greater expiratory flows. However, at intermediate and low lung volumes,the expiratory flow is independent of effort after a certain intrapleural pressure is reached.
Measurements made from the spirometry curve can determine the degree of a patient’s ventilatory obstruction. Forced vital capacity (FVC), forced expiratory volumes (FEV), and forced expiratory flows (FEF) can be determined.The FEV indicates the volume that has been exhaled from TLC for a
FIGURE 7.6 Flow-volume curve obtained from a spirometry maneuver. Solid line is a normal curve; dashed line represents a patient with obstructive lung disease.
7-14 |
Biotechnology for Biomedical Engineers |
particular time interval. For example, FEV0.5 is the volume exhaled during the first half-second of expiration, and FEV1.0 is the volume exhaled during the first second of expiration; these are graphically represented in Fig. 7.5. Note that the more severe the ventilatory obstruction, the lower are the timed volumes (FEV0.5 and FEV1.0).The FEF is a measure of the average flow (volume/time) over specified portions of the spirometry curve and is represented by the slope of a straight line drawn between volume levels.The average flow over the first quarter of the forced expiration is the FEF0–25% whereas the average flow over the middle 50% of the FVC is the FEF25–75%.These values are obtained directly from the spirometry curves.The less steep curves of obstructed patients would result in lower values of FEF0_25%. and FEF25_75%. compared with normal values, which are predicted on the basis of the patient’s sex, age, and height. Equations for normal values are available from statistical analysis of data obtained from a normal population.Test results are then interpreted as a percentage of normal.
Another way of presenting a spirometry curve is as a flow-volume curve. Figure 7.6 represents a typical flow-volume curve.The expiratory flow is plotted against the exhaled volume, indicating the maximum flow that may be reached at each degree of lung inflation. Since there is no time axis, a time must mark the FEV0.5 and FEV1.0 on the tracing.To obtain these flow-volume curves in the laboratory, the patient usually exhales through a pneumotach.The most widely used pneumotach measures a pressure drop across a flow-resistive element.The resistance to flow is constant over the measuring range of the device; therefore, the pressure drop is proportional to the flow through the tube.This signal, which is indicative of flow, is then integrated to determine the volume of gas that has passed through the tube.
Another type of pneumotach is the heated-element type.In this device,a small heated mass responds to airflow by cooling. As the element cools, a greater current is necessary to maintain a constant temperature. This current is proportional to the airflow through the tube. Again, to determine the volume that has passed through the tube, the flow signal is integrated.
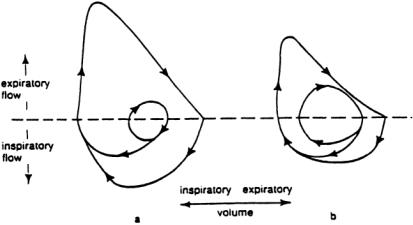
The flow-volume loop in Fig. 7.7 is a dramatic representation displaying inspiratory and expiratory curves for both normal breathing and maximal breathing.The result is a graphic representation of the patient’s reserve capacity in relation to normal breathing.For example,the normal patient’s tidal breathing loop is small compared with the patient’s maximum breathing loop. During these times of stress, this tidal breathing loop can be increased to the boundaries of the outer ventilatory loop.This increase in ventilation provides the greater gas exchange needed during the stressful situation.Compare this condition with that of the patient with obstructive lung disease. Not only is the tidal breathing loop larger than normal, but the maximal breathing loop is smaller than normal.The result is a decreased ventilatory reserve,limiting the individual’s ability to move air in and out of the lungs.As the disease progresses,the outer loop becomes smaller, and the inner loop becomes larger.
FIGURE 7.7 Typical flow-volume loops. (a) Normal flow-volume loop. (b) Flow-volume loop of patient with obstructive lung disease.
Respiratory System |
7-15 |
The primary use of spirometry is in detection of obstructive lung disease that results from increased resistance to flow through the airways.This can occur in several ways:
1.Deterioration of the structure of the smaller airways that results in early airways closure.
2.Decreased airway diameters caused by bronchospasm or the presence of secretions increases the airway’s resistance to airflow.
3.Partial blockage of a large airway by a tumor decreases airway diameter and causes turbulent flow.
Spirometry has its limitations,however.It can measure only ventilated volumes.It cannot measure lung capacities that contain the residual volume. Measurements ofTLC, FRC, and RV have diagnostic value in defining lung overdistension or restrictive pulmonary disease;the body plethysmograph can determine these absolute lung volumes.
Body Plethysmography
In a typical plethysmograph,the patient is put in an airtight enclosure and breathes through a pneumotach. The flow signal through the pneumotach is integrated and recorded as tidal breathing.At the end of a normal expiration (at FRC), an electronically operated shutter occludes the tube through which the patient is breathing.At this time the patient pants lightly against the occluded airway. Since there is no flow, pressure measured at the mouth must equal alveolar pressure. But movements of the chest that compress gas in the lung simultaneously rarify the air in the plethysmograph, and vice versa. The pressure change in the plethysmograph can be used to calculate the volume change in the plethysmograph, which is the same as the volume change in the chest.This leads directly to determination of FRC.
At the same time, alveolar pressure can be correlated to plethysmographic pressure.Therefore, when the shutter is again opened and flow rate is measured, airway resistance can be obtained as the ratio of alveolar pressure (obtainable from plethysmographic pressure) to flow rate [Carr and Brown,1993].Airway resistance is usually measured during panting, at a nominal lung volume of FRC and flow rate of ±1 liter/s.
Airway resistance during inspiration is increased in patients with asthma,bronchitis,and upper respiratory tract infections.Expiratory resistance is elevated in patients with emphysema,since the causes of increased expiratory airway resistance are decreased driving pressures and the airway collapse.Airway resistance also may be used to determine the response of obstructed patients to bronchodilator medications.
Diffusing Capacity
So far the mechanical components of airflow through the lungs have been discussed.Another important parameter is the diffusing capacity of the lung, the rate at which oxygen or carbon dioxide travel from the alveoli to the blood (or vice versa for carbon dioxide) in the pulmonary capillaries. Diffusion of gas across a barrier is directly related to the surface area of the barrier and inversely related to the thickness. Also, diffusion is directly proportional to the solubility of the gas in the barrier material and inversely related to the molecular weight of the gas.
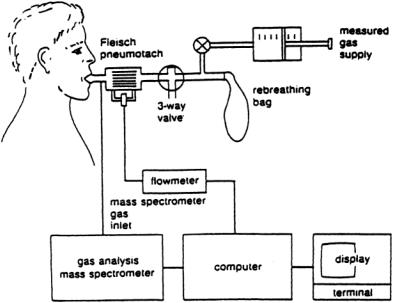
Lung diffusing capacity (DL) is usually determined for carbon monoxide but can be related to oxygen diffusion.The popular method of measuring carbon monoxide diffusion utilizes a rebreathing technique in which the patient rebreathes rapidly in and out of a bag for approximately 30 s. Figure 7.8 illustrates the test apparatus.The patient begins breathing from a bag containing a known volume of gas consisting of 0.3% to 0.5 carbon monoxide made with heavy oxygen, 0.3% to 0.5% acetylene, 5% helium, 21% oxygen, and a balance of nitrogen.As the patient rebreathes the gas mixture in the bag, a modified mass spectrometer continuously analyzes it during both inspiration and expiration. During this rebreathing procedure, the carbon monoxide disappears from the patient-bag system; the rate at which this occurs is a function of the lung diffusing capacity.
The helium is inert and insoluble in lung tissue and blood and equilibrates quickly in unobstructed patients, indicating the dilution level of the test gas.Acetylene, on the other hand, is soluble in blood and is used to determine the blood flow through the pulmonary capillaries. Carbon monoxide is bound very
7-16 |
Biotechnology for Biomedical Engineers |
FIGURE 7.8 Typical system configuration for the measurement of rebreathing pulmonary diffusing capacity.
tightly to hemoglobin and is used to obtain diffusing capacity at a constant pressure gradient across the alveolar-capillary membrane.
Decreased lung diffusing capacity can occur from the thickening of the alveolar membrane or the capillary membrane as well as the presence of interstitial fluid from edema. All these abnormalities increase the barrier thickness and cause a decrease in diffusing capacity. In addition, a characteristic of specific lung diseases is impaired lung diffusing capacity. For example, fibrotic lung tissue exhibits a decreased permeability to gas transfer, whereas pulmonary emphysema results in the loss of diffusion surface area.
Defining Terms
Alveoli: Respiratory airway terminals where most gas exchange with the pulmonary circulation takes place. Diffusion:The process whereby a material moves from a region of higher concentration to a region of
lower concentration.
BTPS: Body temperature (37°C) and standard pressure (1 atm), saturated (6.28 kN/m2). Chemoreceptors: Neural receptors sensitive to chemicals such as gas partial pressures.
Dead space:The portion of the respiratory system that does not take part in gas exchange with the blood. Expiration: The breathing process whereby air is expelled from the mouth and nose. Also called
exhalation.
Functional residual capacity: The lung volume at rest without breathing.
Inspiration:The breathing process whereby air is taken into the mouth and noise.Also called inhalation. Mass spectrometer: A device that identifies relative concentrations of gases by means of mass-to-
charge ratios of gas ions.
Mechanoreceptors: Neural receptors sensitive to mechanical inputs such as stretch,pressure,irritants,etc. Partial pressure: The pressure that a gas would exert if it were the only constituent.
Perfusion: Blood flow to the lungs.
Plethysmography: Any measuring technique that depends on a volume change. Pleura: The membrane surrounding the lung.
Respiratory System |
7-17 |
Pneumotach: A measuring device for airflow.
Pulmonary circulation: Blood flow from the right cardiac ventricle that perfuses the lung and is in intimate contact with alveolar membranes for effective gas exchange.
STPD: Standard temperature (0°C) and pressure (1 atm), dry (moisture removed). Ventilation: Airflow to the lungs.
References
Astrand PO, Rodahl K. 1970. Textbook of Work Physiology. NewYork, McGraw-Hill.
Carr JJ,Brown JM,1993.Introduction to Biomedical EquipmentTechnology. Englewood Cliffs,NJ,PrenticeHall. Fredberg JJ, Stamenovic D. 1989. On the imperfect elasticity of lung tissue. J Appl Physiol 67(6):2408–
2419.
Hildebrandt J. 1970. Pressure-volume data of cat lung interpreted by plastoelastic, linear viscoelastic model. J Appl Physiol 28(3):365–372.
Hornbein TF (ed). 1981. Regulation of Breathing. NewYork, Marcel Dekker. Johnson AT. 1991. Biomechanics and Exercise Physiology. NewYork,Wiley.
Jones NL. 1984. Normal values for pulmonary gas exchange during exercise. Am Rev Respir Dis 129: 544–546.
Kline J. (ed). 1976. Biologic Foundations of Biomedical Engineering. Boston, Little, Brown. Parker JF Jr,WestVR. (eds). 1973. Bioastronautics Data Book. Washington, NASA. Ruch TC, Patton HD. (eds). 1966. Physiology Biophysics. Philadelphia, Saunders.
Stamenovic D, Glass GM, Barnas GM, Fredberg JJ. 1990.Viscoplasticity of respiratory tissues. J Appl Physiol 69(3):973–988.
Suki B, Bates JHT. 1991.A nonlinear viscoelastic model of lung tissue mechanics. J Appl Physiol 71(3): 826–833.
Weibel, ER. 1963. Morphometry of the Human Lung. NewYork,Academic Press.
West J.1962. Regional differences in gas exchange in the lung of erect man. J Appl Physiol 17:893–898. West JB (ed). 1977. Bioengineering Aspects of the Lung. NewYork, Marcel Dekker.
Additional References
Fredberg JJ, Jones KA, Nathan A, Raboudi S, PrakashYS, Shore SA, Butler JP, Sieck GC. 1996. Friction in airway smooth muscle: mechanism, latch, and implications in asthma. J Appl Physiol 81(6): 2703–2712.
Hantos Z,Daroczy B,CsendesT,Suki B,Nagy S.1990.Modeling of low-frequency pulmonary impedance in dogs. J Appl Physiol 68(3):849–860.
Hantos Z, Daroczy B, Suki B, Nagy S. 1990. Low-frequency respiratory mechanical impedance in rats.
J Appl Physical 63(l):36–43.
Hantos Z, Petak F, Adamicza A, Asztalos T,Tolnai J, Fredberg JJ. 1997. Mechanical impedance of the lung periphery. J Appl Physiol 83(5):1595–1601.
Maksym GN, Bates JHT. 1997. A distributed nonlinear model of lung tissue elasticity. J Appl Physiol 82(1):32–41.
Petak F, Hall GL, Sly PD. 1998. Repeated measurements of airway and parenchymal mechanics in rats by using low frequency oscillations. J Appl Physiol 84(5): 1680–1686.
Thorpe CW, Bates JHT. 1997. Effect of stochastic heterogeneity on lung impedance during acute bronchoconstriction:A model analysis. J Appl Physiol 82(5):1616–1625.
Yuan H, Ingenito EP,Suki B.1997. Dynamic properties of lung parenchyma:mechanical contributions of fiber network and interstitial cells. J Appl Physiol 83(5): 1420–1431.