

Network Plus 2005 In Depth
.pdf552 Chapter 12 TROUBLESHOOTING NETWORK PROBLEMS
NET+ Network Monitors
4.2A network monitor is a software-based tool that continually monitors network traffic from a
4.8server or workstation attached to the network. Network monitors typically can interpret up to Layer 3 of the OSI Model. They can determine the protocols passed by each frame, but can’t interpret the data inside the frame. By capturing data, they can provide either a snapshot of network activity at one point in time or a historical record of network activity over a period of time.
Some NOSs come with network monitoring tools. Microsoft Network Monitor is the tool that ships with Windows Server 2003 as well as with Windows NT and Windows 2000 Server. Novell NETMON, an NLM (NetWare Loadable Module), comes with NetWare 5.x and 6.x. In addition, you can purchase or download for free network monitoring tools written by other software companies. Hundreds of such programs exist. After you have worked with one network monitoring tool, you will find that other products work in much the same way. Most even use very similar graphical interfaces.
NOTE
To take advantage of network monitoring and analyzing tools, the network adapter installed in the machine running the software must support promiscuous mode. In promiscuous mode, a device driver directs the NIC to pick up all frames that pass over the network—not just those destined for the node served by the card. You can determine whether your network adapter supports promiscuous mode by reading its manual or checking with the manufacturer. Some network monitoring software vendors may even suggest which network adapters to use with their software.
Network monitoring tools can perform at least the following functions:
Continuously monitor network traffic on a segment
Capture network data transmitted on a segment
Capture frames sent to or from a specific node
Reproduce network conditions by transmitting a selected amount and type of data
Generate statistics about network activity (for example, what percentage of the total frames transmitted on a segment are broadcast frames)
Some network monitoring tools can also:
Discover all network nodes on a segment
Establish a baseline, or a record of how the network operates under normal conditions, including its performance, collision rate, utilization rate, and so on

TROUBLESHOOTING TOOLS |
Chapter 12 553 |
NET+ |
Store traffic data and generate reports |
4.2Trigger alarms when traffic conditions meet preconfigured conditions (for example,
4.8 |
if usage exceeds 50% of capacity) |
How can capturing data help you solve a problem? Imagine that traffic on a segment of the network you administer suddenly grinds to a halt one morning at about 8:00. You no sooner step in the door than everyone from the help desk calls to tell you how slowly the network is running. Nothing has changed on the network since last night, when it ran normally, so you can think of no obvious reasons for problems.
At the workstation where you have previously installed a network monitoring tool, you capture all data transmissions for approximately five minutes. You then sort the frames in the network monitoring software, arranging the nodes in order based on the volume of traffic each has generated. You might find that one workstation appears at the top of the list with an inordinately high number of bad transmissions. Or, you might discover that a server has been compromised by a hacker and is generating a flood of data over the network.
Before adopting a network monitor or protocol analyzer, you should be aware of some of the data errors that these tools can distinguish. The following list defines some commonly used terms for abnormal data patterns and packets, along with their characteristics:
Local collisions—Collisions that occur when two or more stations are transmitting simultaneously. A small number of collisions are normal on an Ethernet network. Excessively high collision rates within the network usually result from cable or routing problems.
Late collisions—Collisions that take place outside the window of time in which they would normally be detected by the network and redressed. Late collisions are usually caused by one of two problems: (1) a defective station (for example, a card or transceiver) that is transmitting without first verifying line status, or (2) failure to observe the configuration guidelines for cable length, which results in collisions being recognized too late.
Runts—Packets that are smaller than the medium’s minimum packet size. For instance, any Ethernet packet that is smaller than 64 bytes is considered a runt. Runts are often the result of collisions.
Giants—Packets that exceed the medium’s maximum packet size. For example, an Ethernet packet larger than 1518 bytes is considered a giant.
Jabber—A device that handles electrical signals improperly, usually affecting the rest of the network. A network analyzer will detect a jabber as a device that is always retransmitting, effectively bringing the network to a halt. A jabber usually results from a bad NIC. Occasionally, it can be caused by outside electrical interference.
Negative frame sequence checks—The result of the CRC (Cyclic Redundancy Check) generated by the originating node not matching the checksum calculated from the data received. It usually indicates noise or transmission problems on the

554 Chapter 12 TROUBLESHOOTING NETWORK PROBLEMS
NET+ |
LAN interface or cabling. A high number of negative CRCs usually result from |
4.2 |
excessive collisions or a station transmitting bad data. |
4.8Ghosts—Frames that are not actually data frames, but aberrations caused by a device misinterpreting stray voltage on the wire. Unlike true data frames, ghosts have no starting delimiter.
Protocol Analyzers
A protocol analyzer (or network analyzer) is another tool that can capture traffic. But a protocol analyzer can also analyze frames, typically all the way to Layer 7 of the OSI Model. For example, it can identify that a frame uses TCP/IP and, more specifically, that it is an ARP request from one particular workstation to a server. Analyzers can also interpret the payload portion of frames, translating from binary or hexadecimal code to human-readable form. As a result, network analyzers can capture passwords going over the network, if their transmission is not encrypted. Some protocol analyzer software packages can run on a standard PC, but others require PCs equipped with special network adapters and operating system software.
As with network monitoring software, a variety of protocol analyzer software is available. One popular example is the free program called Ethereal. Essentially, a protocol analyzer performs the same features as the network monitor software discussed previously, plus a few extras. It can also generate traffic in an attempt to reproduce a network problem and monitor multiple network segments simultaneously. Its graphical interface makes this product very easy to use, readily revealing the traffic flow across the network. In addition, protocol analyzer software typically supports a multitude of protocols and network topologies.
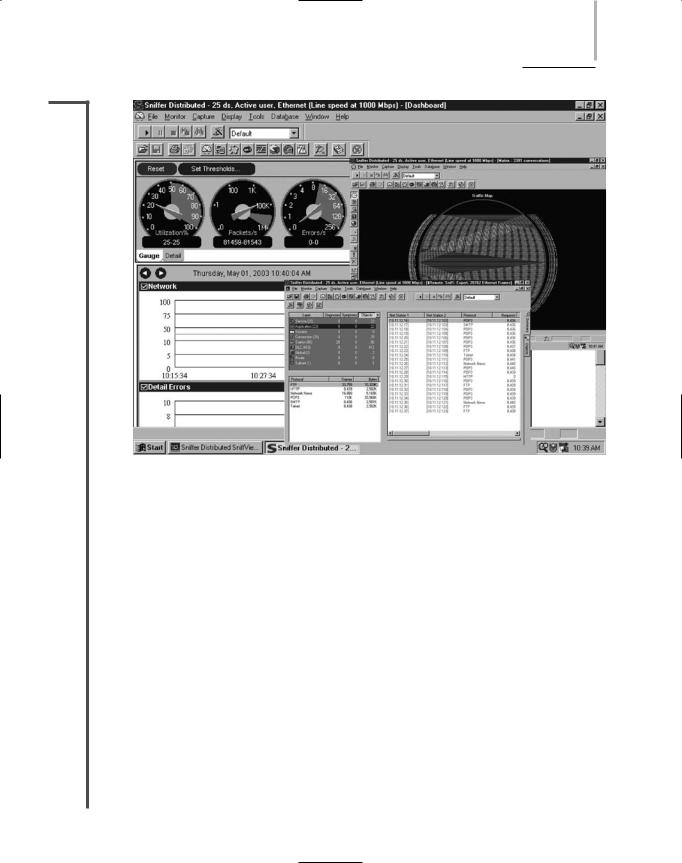
Some protocol analyzers are not merely software tools, but hardware tools as well. Sniffer Technologies has led the way in developing hardware-based protocol analyzers, under the Sniffer brand name. (Following the popularity of the Sniffer Technologies product, some networking professionals generically refer to any hardware-based protocol analyzer as a “sniffer.”) Hard- ware-based protocol analyzers usually resemble regular laptops, but are equipped with a special network adapter and network analysis software. The sole job of this device is to identify and assess network problems. Unlike laptops that have a network monitoring tool installed, hardware-based protocol analyzers typically cannot be used for other purposes, because they don’t depend on a familiar desktop operating system such as Windows. They have their own proprietary operating system. Because they do not rely on a desktop operating system such as Windows, hardware-based network analyzers have an advantage over network monitoring software. They do not rely on Windows device drivers (for the NIC), for example, so they can capture information that the NIC would automatically discard, such as runt packets. Figure 12-8 illustrates how Sniffer Portable software can display network data. In this case, the screen depicts the distribution of traffic captured by protocol type.
Hardware-based protocol analyzers are tailored to a particular type of network. For example, one may be able to analyze both Ethernet and Token Ring networks, but another may be necessary to analyze fiber-optic networks. Still others are designed especially for analyzing
TROUBLESHOOTING TOOLS |
Chapter 12 555 |
NET+
4.2
4.8
FIGURE 12-8 Traffic displayed by protocol type
wireless network traffic. A hardware-based protocol analyzer represents a significant investment, with costs ranging from $10,000 to $30,000.
Protocol analyzers offer a great deal of versatility in the type and depth of information they can reveal. The danger in using this type of tool is that it may collect more information than you or the machine can reasonably process, thus rendering your exercise futile. To avoid this problem, you should set filters on the data gathered. For example, if you suspect that a certain workstation is causing a traffic problem, you should filter the data collection to accept only frames to or from that workstation’s MAC address. If you suspect that you have a gatewayrelated TCP/IP problem, you would set a filter to capture only TCP/IP frames and to ignore other protocols from the gateway’s MAC address.
Before using a network monitor or protocol analyzer on a network, it’s important to know what traffic on your network normally looks like. To obtain this information, you can run the program and capture data for a period of time on a regular basis—for example, every weekday between 8:00 A.M. and noon. You’ll generate a lot of data, but you’ll also learn a lot about your network. From this data, you can establish a baseline to use as a comparison with future traffic analyses.

TROUBLESHOOTING TOOLS |
Chapter 12 557 |
NET+ |
and discover all the APs and wireless stations transmitting in the area. This is useful for deter- |
4.8mining whether an AP is functioning properly, whether it is positioned correctly so that all the stations it serves are within its range, and whether stations and APs are communicating over the proper channels within a frequency band. Some programs can also capture the data transmitted between stations and APs. This information is useful for troubleshooting wireless connection problems (for example, poor performance or intermittent faults) after you’ve verified that connectivity is present. And some programs contain a spectrum analyzer, a tool that can assess the quality of the wireless signal. Spectrum analysis is useful, for example, to ascertain where noise (or interference) is greatest.
Software that can perform wireless network assessment is often available for free and may be provided by the AP’s manufacturer. Following is a list of specific capabilities common to wireless network testing tools:
Identify transmitting APs and stations and the channels over which they are communicating
Measure signal strength from and determine the range of an access point
Indicate the effects of attenuation, signal loss, and noise
Interpret signal strength information to rate potential AP locations (from “very good” to “poor”)
Ensure proper association and reassociation when moving between APs
Capture and interpret traffic exchanged between wireless APs and stations
Measure throughput and assess data transmission errors
Analyze the characteristics of each channel within a frequency band to indicate the clearest channels
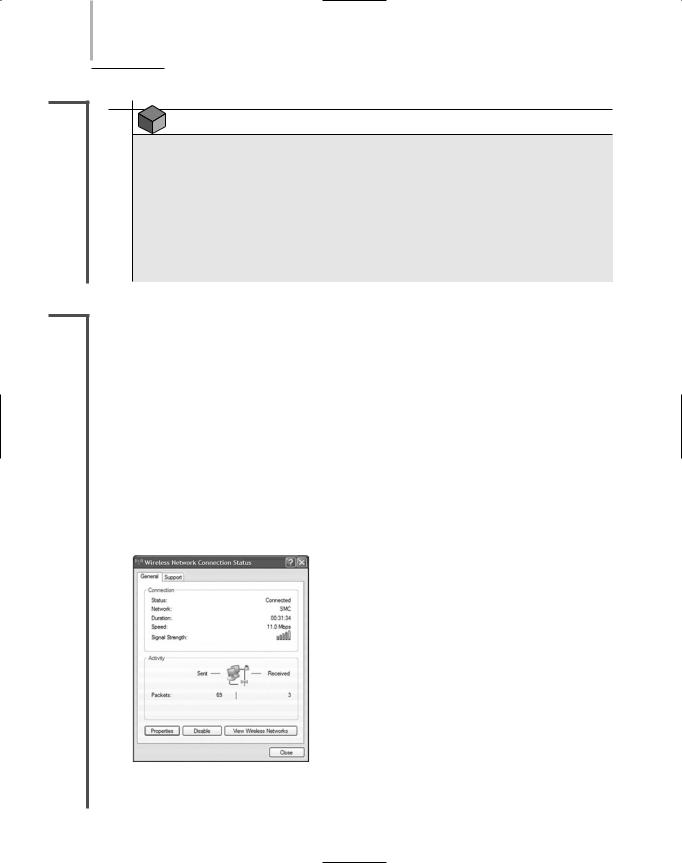
Some companies have created testing instruments whose sole purpose is to assess the status of wireless networks. These tools can perform the same detection, data capture, and spectrum analysis functions as the software tools described previously. One advantage to using such devices, however, is that they are typically more portable than a laptop or desktop workstation. Second, they come installed with all the wireless network analysis tools you’ll need, and these are usually accessible from one simple, graphical interface. A third advantage is that most wireless testing tools contain more powerful antennas than a workstation NIC. A more powerful antenna could mean the difference between assessing the wireless network for an entire building from your desk versus walking around to each floor with your laptop. Figure 12-10 shows one example of such a wireless network testing tool.
NOTE
Wireless testing tools—both softwareand hardware-based—are not only used for troubleshooting, but are also critical for wireless site selection, or determining the optimal placement for APs on a wireless LAN.

558 Chapter 12 TROUBLESHOOTING NETWORK PROBLEMS
NET+
4.8
FIGURE 12-10 Wireless network testing tool
Chapter Summary
The key to solving network problems is to approach them methodically and logically, using your experience to inform your decisions, and knowing when to ask for someone else’s help.
The first step in troubleshooting is identifying the symptoms and potential causes for a problem. Symptoms may include error messages, the inability to perform certain functions on the network, or the inability to connect to a network. Record what you learn about symptoms.
Next identify the affected area. In general, a network problem may be limited to one user; all users on a segment; all users on a network; certain types of users, departments, or locations; or certain times of the day or week.
At each point in the troubleshooting process, stop to consider what kind of changes have occurred on the network that might have created a problem. Changes pertaining to hardware may include the addition of a new device, the removal of an old device, a component upgrade, a cabling upgrade, or an equipment move. Changes pertaining to software may include an operating system upgrade, a device driver upgrade, a new application, or a changed configuration.

CHAPTER SUMMARY Chapter 12 559
Based on an analysis of the symptoms and how changes might have affected the network, select a probable cause for the problem. First ensure that the user is performing all functions correctly, then attempt to reproduce the problem’s symptoms, check the physical connectivity of clients and devices involved in the problem, and determine whether software and hardware are configured correctly.
After you have identified the probable cause, implement an action plan and your solution, while considering the potential effects of the solution. Consider the number of users affected, costs, potential down time, and scalability of your solution. Collect documentation about the hardware or software configuration you are working with and keep this handy while implementing your solution.
After implementing your solution, test your result to ensure that you solved the problem and haven’t created new problems. The type of testing you perform will depend on your solution. Enlist the help of users to test the solution. If the solution required significant network changes, revisit the solution a day or two after you implement it to verify that it has truly worked and not caused additional problems.
Next identify the effects and results of your solution. Verify that you have solved the problem you set out to solve and that you have not created any new problems inadvertently as a result.
Finally, document the solution and the process of solving the problem. Some organizations use a software program for documenting problems, known as a call tracking system (or help desk software). These programs provide a user-friendly graphical interface that prompts the user for every piece of information associated with the problem.
When troubleshooting, record the following details about a problem: the originator’s name, department, and phone number; whether the problem is softwareor hard- ware-related; if the problem is software-related, the package to which it pertains; if the problem is hardware-related, the device or component to which it pertains; the symptoms of the problem, including when it was first noticed; the name and telephone number of the network support contact; the amount of time spent troubleshooting the problem; and the resolution of the problem.
A tone generator and tone locator are used to identify the terminating location of a wire pair. This combination of devices may also be known as a fox and hound.
A multimeter is a simple device that can measure the voltage, resistance, impedance, and other characteristics of an electrical circuit.
Basic cable continuity testers determine whether your cabling can provide connectivity. In the case of copper-based cables, they apply a small voltage to each conductor at one end of the cable, and then check whether that voltage is detectable at the other end. They may also verify that voltage cannot be detected on other conductors in the cable. A good cable checker will also verify that the wires are paired correctly and that they are not shorted, exposed, or crossed.

560Chapter 12 TROUBLESHOOTING NETWORK PROBLEMS
A cable performance tester accomplishes the same continuity and fault tests as a continuity tester, but also ensures that the cable length is not too long, measures the distance to a cable fault, measures attenuation along a cable, measures near-end crosstalk between wires, measures termination resistance and impedance, issues pass/fail ratings for CAT 3, CAT 5, CAT 6, and CAT 7 standards, and stores and prints test results.
A network monitor is a software-based tool that monitors network traffic from a server or workstation attached to the network. Network monitors typically can interpret up to Layer 3 of the OSI Model. They can determine the protocols passed by each packet, but can’t interpret the data inside the packet.
Network Monitor is the name of the network monitoring software that comes with Windows Server 2003 (and earlier versions of the Windows NOS). NETMON is the network monitoring NLM provided with the NetWare NOS. Many other types of network monitoring software are available.
Protocol analyzers can typically interpret data up to Layer 7 of the OSI Model. They can also interpret the payload portion of packets, translating from binary or hexadecimal code to human-readable form. Protocol analyzers may be software programs or devices dedicated to protocol analysis.
Wireless network testing tools can be dedicated instruments or software that runs on a workstation (usually a laptop). They can: discover wireless APs and stations, measure signal strength and interference, capture and interpret wireless data, measure throughput and identify data errors, and ensure proper association and reassociation between stations and APs.
Key Terms
baseline—A record of how a network operates under normal conditions (including its performance, collision rate, utilization rate, and so on). Baselines are used for comparison when conditions change.
cable checker—See continuity tester.
cable performance tester—A troubleshooting tool that tests cables for continuity, but can also measure crosstalk, attenuation, and impedance; identify the location of faults; and store or print cable testing results.
cable tester—A device that tests cables for one or more of the following conditions: continuity, segment length, distance to a fault, attenuation along a cable, near-end crosstalk, and termination resistance and impedance. Cable testers may also issue pass/fail ratings for wiring standards or store and print cable testing results.
call tracking system—A software program used to document technical problems and how they were resolved (also known as help desk software).

KEY TERMS |
Chapter 12 561 |
change management system—A process or program that provides support personnel with a centralized means of documenting changes made to the network.
continuity tester—An instrument that tests whether voltage (or light, in the case of fiber-optic cable) issued at one end of a cable can be detected at the opposite end of the cable. A continuity tester can indicate whether the cable will successfully transmit a signal.
fox and hound—Another term for the combination of devices known as a tone generator and a tone locator. The tone locator is considered the hound because it follows the tone generator (the fox).
ghost—A frame that is not actually a data frame, but rather an aberration caused by a device misinterpreting stray voltage on the wire. Unlike true data frames, ghosts have no starting delimiter.
giant—A packet that exceeds the medium’s maximum packet size. For example, any Ethernet packet that is larger than 1518 bytes is considered a giant.
jabber—A device that handles electrical signals improperly, usually affecting the rest of the network. A network analyzer will detect a jabber as a device that is always retransmitting, effectively bringing the network to a halt. A jabber usually results from a bad NIC. Occasionally, it can be caused by outside electrical interference.
late collision—A collision that takes place outside the normal window in which collisions are detected and redressed. Late collisions are usually caused by a defective station (such as a card, or transceiver) that is transmitting without first verifying line status or by failure to observe the configuration guidelines for cable length, which results in collisions being recognized too late.
local collision—A collision that occurs when two or more stations are transmitting simultaneously. Excessively high collision rates within the network can usually be traced to cable or routing problems.
multimeter—A simple instrument that can measure multiple characteristics of an electric circuit, including its resistance and voltage.
negative frame sequence check—The result of the CRC (cyclic redundancy check) generated by the originating node not matching the checksum calculated from the data received. It usually indicates noise or transmission problems on the LAN interface or cabling. A high number of (nonmatching) CRCs usually results from excessive collisions or a station transmitting bad data.
NETMON—Novell’s network monitoring NLM. NETMON is included in NetWare 5.x and 6.x.
network analyzer—See protocol analyzer.
network monitor—A software-based tool that monitors traffic on the network from a server or workstation attached to the network. Network monitors typically can interpret up to Layer 3 of the OSI Model.