

6.6 Durabilty
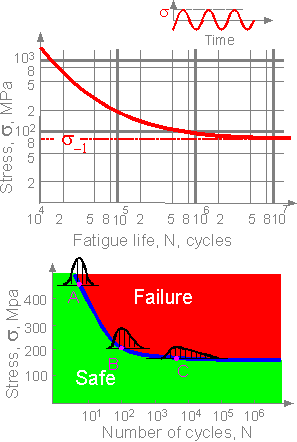 Durability
of structures is connected with degradation processes such as
fatigue, creep and others. "Stress
- Number
ofциклы
на неудачу» (S-N)
диаграмма описывает усталость металлов.
Усталость прочности s-1
соответствует горизонтальный сегмент
кривой. Если нет горизонтального
сегмента, значение можно предположить
при N
= 106 или N
= 107. На высоких напряжений усталость
жизни и его дисперсия малы. При низком
давлении функция плотности вероятности
не симметрично и его дисперсия
больше.
Durability
of structures is connected with degradation processes such as
fatigue, creep and others. "Stress
- Number
ofциклы
на неудачу» (S-N)
диаграмма описывает усталость металлов.
Усталость прочности s-1
соответствует горизонтальный сегмент
кривой. Если нет горизонтального
сегмента, значение можно предположить
при N
= 106 или N
= 107. На высоких напряжений усталость
жизни и его дисперсия малы. При низком
давлении функция плотности вероятности
не симметрично и его дисперсия
больше.
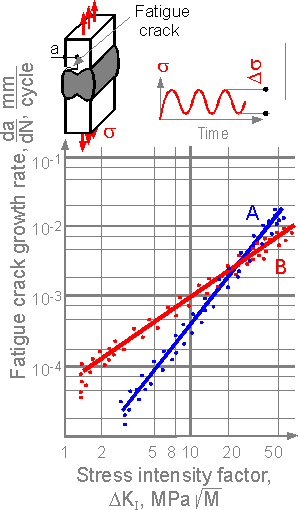 Initiation
and growth of fatigue cracks occur under cyclic loading. The figure
shows an experimental diagram "fatigue crack growth rate vs
stress intensity factor" for two butt-welds made from different
steels. The smaller the fatigue crack growth rate, the better. The
smaller the fatigue crack growth rate at small values of stress
intensity factor, A, the longer the fatigue macrocrack growth is in
the initial stage.
Initiation
and growth of fatigue cracks occur under cyclic loading. The figure
shows an experimental diagram "fatigue crack growth rate vs
stress intensity factor" for two butt-welds made from different
steels. The smaller the fatigue crack growth rate, the better. The
smaller the fatigue crack growth rate at small values of stress
intensity factor, A, the longer the fatigue macrocrack growth is in
the initial stage.
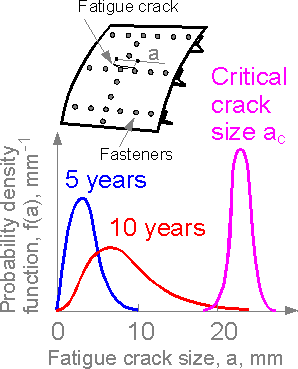 The
dispersion increases with time for fatigue cracks. Short cracks have
no significant increase, but the longer cracks grow faster.
Theoretical distributions for fatigue crack go from zero to infinity.
This means that the theoretical reliability measure cannot be equal
to 1.0.
The
dispersion increases with time for fatigue cracks. Short cracks have
no significant increase, but the longer cracks grow faster.
Theoretical distributions for fatigue crack go from zero to infinity.
This means that the theoretical reliability measure cannot be equal
to 1.0.
 A
fatigue crack grows in a structural element from initial size ao
to its critical size ac.
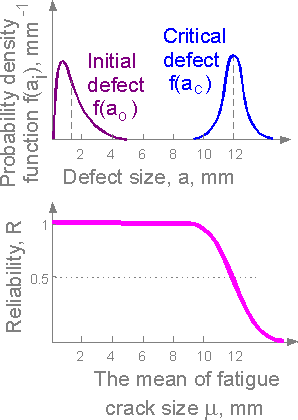
The reliability is approximately equal to 1 for a small crack. The
fatigue crack reaches its critical size at failure and the
reliability decrease. When the means coincide, the reliability is
equal to 0.5.
A
fatigue crack grows in a structural element from initial size ao
to its critical size ac.
The reliability is approximately equal to 1 for a small crack. The
fatigue crack reaches its critical size at failure and the
reliability decrease. When the means coincide, the reliability is
equal to 0.5.
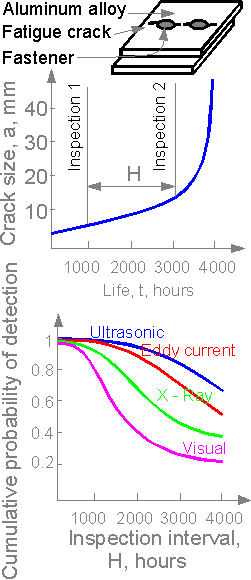 Airplane
fuselages are periodically inspected for fatigue crack
identification. Probability of crack detection depends on the method
of nondestructive testing (NDT) and the inspection interval.
Probability of crack detection is approximately equal to 1 for short
intervals and decreases as the intervals increase. The ultrasonic NDT
is the most effective technique.
Airplane
fuselages are periodically inspected for fatigue crack
identification. Probability of crack detection depends on the method
of nondestructive testing (NDT) and the inspection interval.
Probability of crack detection is approximately equal to 1 for short
intervals and decreases as the intervals increase. The ultrasonic NDT
is the most effective technique.
 The
figure shows the dependence of maximum stress on the number of cycles
sustained by an element of a pressure vessel. The engineers can
suppose service at different stress, for example:
1000
MPa - 100 cycles
500 MPa - 500 cycles
100 MPa - 50000
cycles
The element fails if the sum damage parameter
exceeds 1.
In our case:
w = 100/200 + 500/1000 +
50000/100000 = 0.5 + 0.5 + 0.5 = 1.5 > 1.0
The element
fails.
The
figure shows the dependence of maximum stress on the number of cycles
sustained by an element of a pressure vessel. The engineers can
suppose service at different stress, for example:
1000
MPa - 100 cycles
500 MPa - 500 cycles
100 MPa - 50000
cycles
The element fails if the sum damage parameter
exceeds 1.
In our case:
w = 100/200 + 500/1000 +
50000/100000 = 0.5 + 0.5 + 0.5 = 1.5 > 1.0
The element
fails.
6.7 Design by reliability criterion
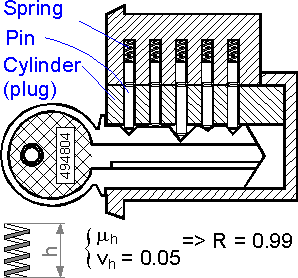 Geometrical
characteristics of a machine's parts can be selected by reliability
criterion. The parameters (thickness, length, cross-section area) can
be chosen so that the total reliability of machine is equal to the
required value. If the height dimension h of a spring corresponds to
the required reliability, the reliability of the safety lock
consisting of 5 springs is smaller. In this example the geometrical
parameter is the height. This means that the variation coefficient
defines the reliability of a "spring-pin" set and, together
with other geometric characteristics, the reliability of the whole
lock.
Geometrical
characteristics of a machine's parts can be selected by reliability
criterion. The parameters (thickness, length, cross-section area) can
be chosen so that the total reliability of machine is equal to the
required value. If the height dimension h of a spring corresponds to
the required reliability, the reliability of the safety lock
consisting of 5 springs is smaller. In this example the geometrical
parameter is the height. This means that the variation coefficient
defines the reliability of a "spring-pin" set and, together
with other geometric characteristics, the reliability of the whole
lock.
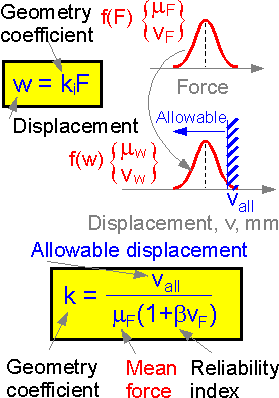
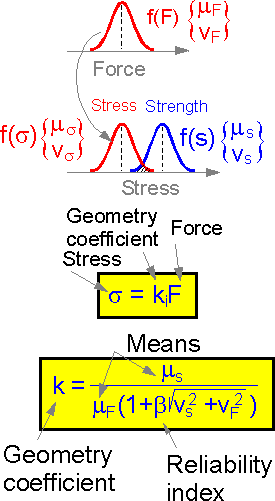 The
condition of failure is defined at the stress coordinate axis. To
transform the known statistical data for force at the axis, a special
geometrical coefficient ki
is used. Variation coefficients for force and stress are equal if the
cross-sectional area is constant. The last formula relates the
geometry coefficient and the reliability index.
The
condition of failure is defined at the stress coordinate axis. To
transform the known statistical data for force at the axis, a special
geometrical coefficient ki
is used. Variation coefficients for force and stress are equal if the
cross-sectional area is constant. The last formula relates the
geometry coefficient and the reliability index.
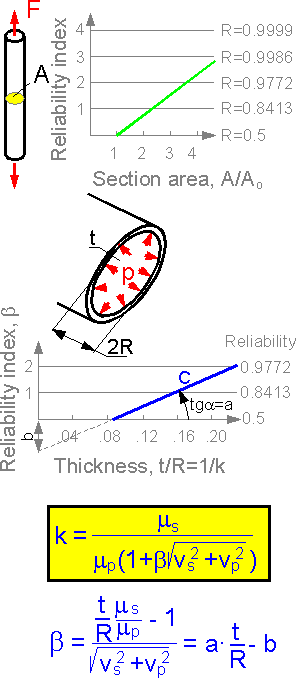 There
is linear dependence between the cross-sectional area A and the
reliability index for the bar if all other variables are constant.
The dependence "reliability index - thickness"
is also linear for the pipe.
There
is linear dependence between the cross-sectional area A and the
reliability index for the bar if all other variables are constant.
The dependence "reliability index - thickness"
is also linear for the pipe.
 A
restriction can be specified for maximum deflection, linear
displacement or angle of twist. For such a restriction, the
dependence between the geometrical coefficient and the reliability
index is also linear. There are one-sided (A and B) and two-sided (C)
restrictions. The last condition, C or two-sided restrictions, is
more severe.
A
restriction can be specified for maximum deflection, linear
displacement or angle of twist. For such a restriction, the
dependence between the geometrical coefficient and the reliability
index is also linear. There are one-sided (A and B) and two-sided (C)
restrictions. The last condition, C or two-sided restrictions, is
more severe.
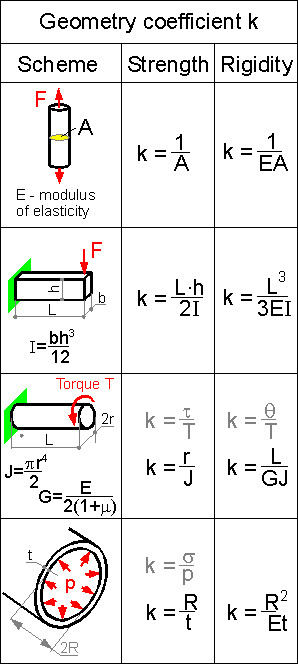 The
table shows values of geometrical coefficients for different loading
conditions. The geometrical coefficient is the ratio of Stress /
Force for tension if the strength criterion is used.
The
table shows values of geometrical coefficients for different loading
conditions. The geometrical coefficient is the ratio of Stress /
Force for tension if the strength criterion is used.
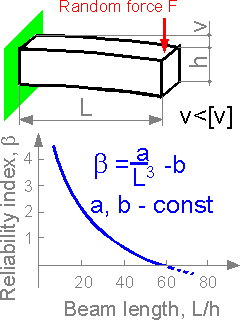 To
meet a rigidity criterion for a cantilevered beam, the reliability
index b is inversely proportional to L3.
With beam length increase the reliability for the rigidity criterion
decreases.
To
meet a rigidity criterion for a cantilevered beam, the reliability
index b is inversely proportional to L3.
With beam length increase the reliability for the rigidity criterion
decreases.
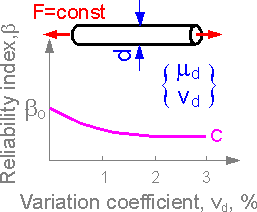 Dispersion
in the size of wire (the variation coefficient) is reflected in
dispersion of inner stress or inner force. The bigger dispersion of
the force, the smaller the reliability index b.
Dispersion
in the size of wire (the variation coefficient) is reflected in
dispersion of inner stress or inner force. The bigger dispersion of
the force, the smaller the reliability index b.
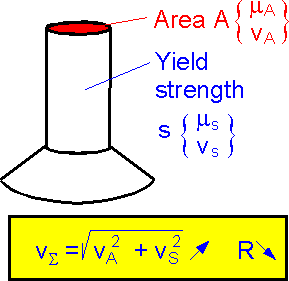 The
yield strength and cross-sectional area are independent variables.
The bigger the dispersion, the smaller the reliability of the
rivet.
The
yield strength and cross-sectional area are independent variables.
The bigger the dispersion, the smaller the reliability of the
rivet.